Transcription
International Journal of Scientific & Engineering Research Volume 9, Issue 4, April-2018ISSN 2229-551819Analysis of Network Traffic Data UsingHadoop and Apache HiveSwathi Prabhu[1], Pooja Parashuram Bajantri[2], Prajna B Nayak[3], Priya Shetty[4], Rachana N[5]Abstract— Computer network traffic can be classified into various classifications based on parameters such as port number, IP address orprotocol. The sequence and pattern of the traffic in the network is illuminated using flow analysis. This helps network administrator tounderstand the network usage and to examine the behavior of the user using the network and to monitor the operations going on in thenetwork. Flow analysis helps in fault tolerance, resource allocation and network capacity planning. Since this is data age, due to the fastgrowing network day by day the volume of the traffic is getting huge. So it is very difficult to collect, store and analyze this large data on asingle machine. It requires scalable tools to measure, classify and analyze this traffic data. Due to the limited computational capability andstorage capacity traditional tools are failed. Hadoop is a leading distributed framework which is designed to execute tremendous data thatcan be of hundreds of terabytes and even petabytes of data. In this paper a Hadoop framework based network traffic data analysis is done.Here the input is appended to the Hadoop Distributed File System (HDFS) and process the data using Map-Reduce, Hive. The output isdisplayed using Tableau and RStudio.Index Terms— Hadoop, HDFS, Hive, Internet Traffic, Map-Reduce, Network flow analysis.—————————— ——————————1 INTRODUCTIONAIJSERnetwork consists of two or more computers that arelinked in order to share resources, exchange files or allowelectronic communications. The computers on a networkmay be linked through cables, telephone lines, radio waves,satellites or infrared light beams.Data analytics has become a key element of the businessdecision process over the last decade. Classic systems basedon relational databases and expensive hardware, while stilluseful for some applications, are increasingly unattractivecompared to the scalability, economics, processing power,availability offered by today's network driven distributed solutions.Network traffic analysis [1] is nothing but analyzing theamount of data moving across a network at a given point oftime. Network packets which are mostly the network data arethe loads in the network. The main objective of monitoringnetwork traffic is to check the availability and smooth operations of the network. Network traffic requires reviewing ofeach incoming and outgoing packets. It can be classified usingHTTP, IP, ICMP, TCP and UDP. To address the challenges inthe traditional systems we use Apache Hadoop. It is an opensource software framework for storage and large scale processing of �——[1] Assistant Professor, Dept. of CSE, SMVITM, Bantakal.prabhuswathi2@gmail.com[2][3][4][5] Student, Dept. of CSE, SMVITM, Bantakal.poojaupadhya96@gmail.com [2], nayak.prajna97@gmail.comshettypriya495@gmail.com [4], rachanasmvitm@gmail.com [5][3],1.Scalability: Ability to store data in a distributedfashion in a large set of servers2. Cost-effective Solution: Hadoop’s scale out architecture with Map-Reduce programming model,allows the storage and processing of BigData inaffordable manner.3. Flexibility: The Map-Reduce model of HadoopFramework can deal with both structured andunstructured datasets.4. Fast: Parallel Processing allows multiple processesto divide the task and hence take fewer-time.The data analysis is carried out through Hadoop MapReduce and Apache Hive.Map-Reduce[7] is a programming model used in theHadoop ecosystem to process large amount of data in a distributed manner. Map-Reduce programs are inherently parallel, thus able to perform very large-scale data analysis. Although it is a powerful tool for processing, it is harder to understand and to develop. Hence we can use Apache Hive, aproject developed on top of Hadoop framework which is easyto understand and develop.Apache Hive is the SQL-On-Hadoop technology to queryheterogeneous data stored in different databases andfilesystems that are fused with Hadoop. This approach is significantly faster and has new features that will support performing inserts and updates to tables. To visualize the data,we made use of Tableau Public and RStudio.Tableau public is an open source tool for pattern discoveryusing data visualization. Learning and using Tableau is a verylow time consuming activity. But there are limitations, such aswe can only read from txt, Excel or Odata sources and there isno security for the data. Hence we used RStudio for analysis.RStudio provides enhanced security and authentication,advanced resource management and priority email support.Advantages of Hadoop System are as follows:IJSER 2018http://www.ijser.org
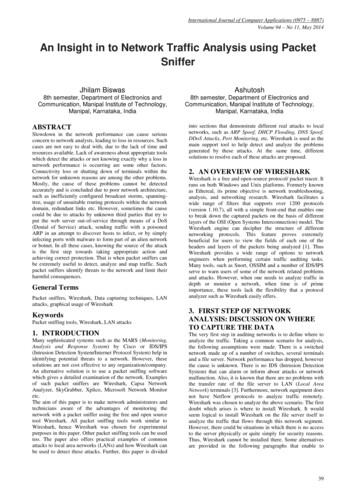
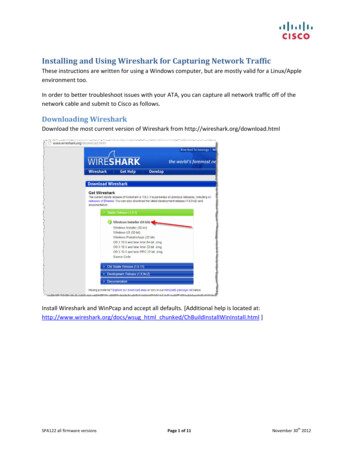
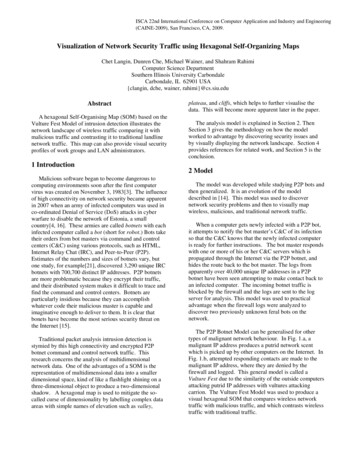
International Journal of Scientific & Engineering Research Volume 9, Issue 4, April-2018ISSN 2229-55182 ARCHITECTURE2.1 Apache HadoopApache Hadoop 1.0 and apache Hadoop 2.0 are the two versions of Hadoop. The 1.0 version was the initial release, wherethere were only two modules: Map-Reduce and HDFS(Hadoop Distributed File System). The Map-Reduce was theprogramming model used for large scale processing and wasalso taking care of cluster resource management. The HDFS isused to manage the storage across the network of machines.Apache Hadoop 2.0 represents a generational shift of architecture in the apache Hadoop. With the introduction of YARN(Yet another Resource Negotiator), Apache Hadoop became asignificantly strong platform. YARN module takes care ofcluster resource management in Hadoop 2.0, which allows themultiple applications to run in Hadoop. Only the data processing is done by Map-Reduce module. The Fig 1. depicts theHadoop Architecture.20platform used to develop SQL like scripts to do Map-Reduceoperations.Some of the features are as follows: It stores schema in the database and process the datainto HDFS. It provides SQL like query language called HiveQL orHQL. It is designed for OLAP.2.3 Comparison between Map-Reduce and HiveThe data processing is done using both Hadoop’s Map-Reduceprogramming model and Apache Hive. The comparison between the two programming model is given in Table 1.TABLE 1COMPARISON BETWEEN MAP-REDUCE AND HIVEHadoop Map-ReduceApache HiveCompiled languageSQL-Like query languageLow level of abstractionHigher level of abstractionIJSERMore lines of codeLesser lines of codeMore development effort isrequiredDevelopment effort is lessCode efficiency is highCode efficiency is less2.4 Tableau PublicFig 1. Hadoop Architecture2.2 Map-ReduceGoogle[3] was the first to propose the Map-Reduce programming model for page ranking or web log analysis. MapReduce is a programming model and an associated implementation for processing and generating big datasets with the parallel, distributed algorithm on a cluster. A Map-Reduce program is composed of two phases: a Map phase and a Reducephase. Each phase has key-value[7] pairs as input and output.Map phase: Master node takes large problem input andslices it into smaller sub problems and attributes these toworker nodes.Reduce Phase: Master node collects the answers to the subproblems from the worker nodes and combines them in a predefined way to get the output.2.2 Apache HiveApache Hive is a data warehouse software project built on topof Apache Hadoop for providing data summarization, queryand analysis. Initially Hive was developed by Facebook, laterthe Apache software foundation took it up and further developed as an opensource under the name Apache Hive. It is aTableau is a Business Intelligence tool for visually analyzingthe data. Users can create and distribute an interactive andshareable dashboard, which depicts the Trends, Variationsand Density of the data in the form of Graphs and Charts. Tableau can connect to files, relational and Big Data sources toacquire and process the data.The software allows data blending and real time collaborations which makes it unique. It isused by businesses, academic researchers and many government organizations for visualize data analysis.Tableau provides solutions for all kinds of industries, departments anddata environments. Speed of analysis, Self-reliant, Visual discovery, Blend diverse data sets, Real-time collaborations andCentralized data are some of the features of the Tableau Public.2.5 RStudioRStudio is a free and open-source integrated developmentenvironment for R, a programming language for statisticalcomputing and graphics. RStudio was founded by JJ Allaire.RStudio integrates with R as an IDE (Integrated DevelopmentEnvironment) to facilitate the user with further functionality.RStudio is a development environment facilitates with soucecode editor, build automation tools and the debugger. Interactive, Easy debugging, Friendly environment for package development are some of the advantages of using RStudio.3 SYSTEM OVERVIEWThe proposed system involves four main phases: CollectionIJSER 2018http://www.ijser.org
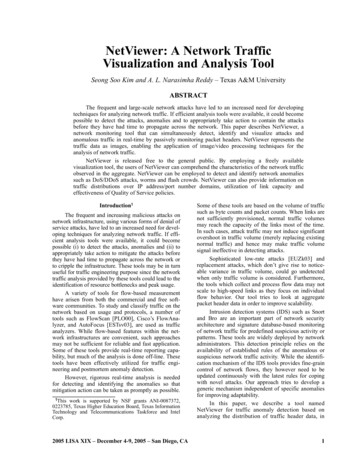
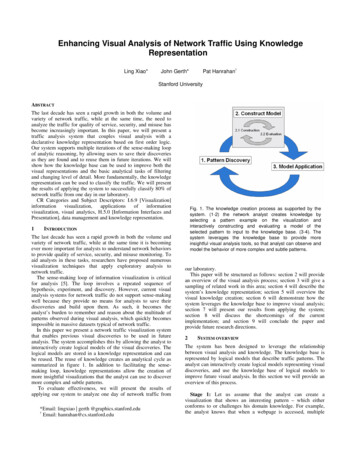
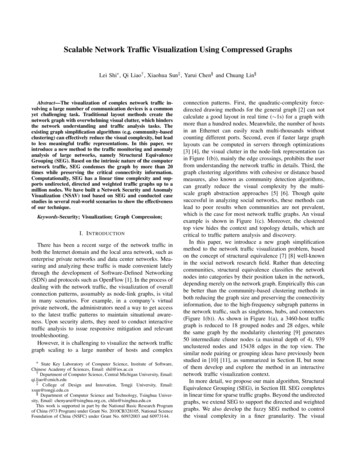
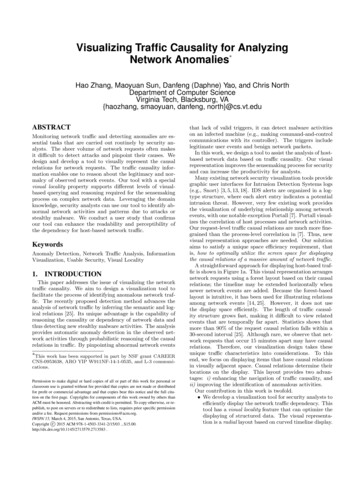
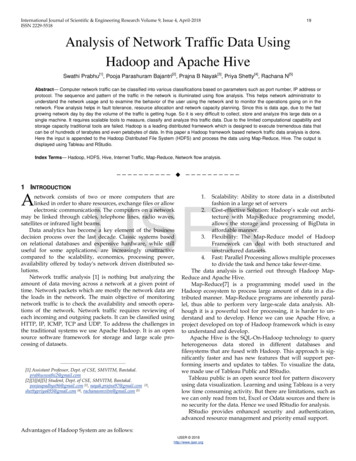
International Journal of Scientific & Engineering Research Volume 9, Issue 4, April-2018ISSN 2229-5518and Conversion of input data set, storing in HDFS, processingof data using Map-Reduce and Hive, visualization using Tableau Public and RStudio.The working procedure of the systemis represented by Fig 2.Fig. 2 Proposed System Architecture21Hadoop: we used Hadoop 2.7.4 version with Multi-node Cluster containing one master and a slave.Apache Hive: we used Hive 2.2.0 version which runs on top ofHadoop Distributed File System (HDFS).Tableau Public: A visualization tool of version 10.5 to displayresults graphically.RStudio: A statistics Computational tool of version 1.1 to display the results.4.2 Overall Results1.PCAP datasetThe dataset employed here is basically a pcap filewhich contains fields such as time of the packet capture, source IP address, destination IP address, protocol, length and other information about the packet. Ascreenshot of dataset is shown in Fig 3.IJSERFour phases are as follows:A. First Phase:a) Collection of dataset: We are using pcap file as adataset, collected from [6]. And also we usedWireshark tool to capture the packets.b) Conversion of data set from .pcap format to .csvfile format: Wireshark tool is used for conversionof file format.B. Second Phase:a) Setting up of Hadoop platform: Installed Hadoopon Ubuntu 16.04 LTS version.b) Load dataset into HDFSC. Third Phase:a) Processing by Map-Reduce: We used MapReduce programming model in which we definedseparate mapper and reducer class to process thepcap data.b) Processing by Hive: Initially we loaded the datainto External hive table and then the data queriedusing HiveQL, a SQL like querying language.D. Fourth Phase:Analysis using visualization tool: Tableau Public, anopen source visualization tool is used to display theanalyzed result. We have also made use of RStudiofor analysis.Fig3.Example Dataset4 EXPERIMENTS4.1 Experimental SetupPre-requisites: RAM: Minimum 4GB Operating System: Ubuntu 16.04 LTS Java Version: JDK 1.82.Copying the Network Traffic data on HDFS is shownin the Fig 4.Fig 4. File Storage in HDFS3.Processing the dataset using Map-ReduceIJSER 2018http://www.ijser.org
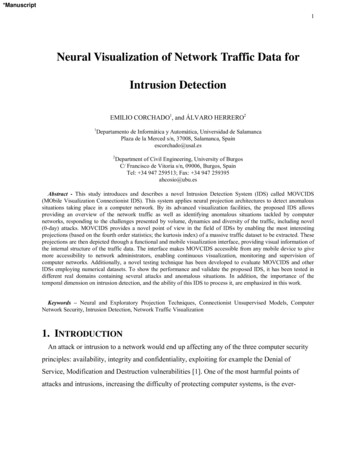
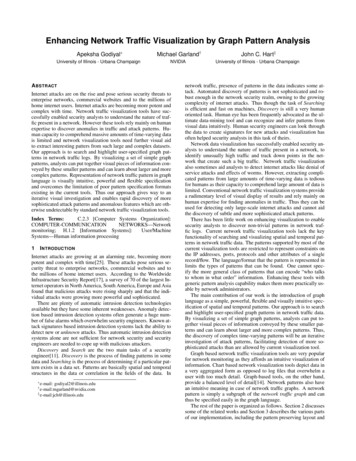
International Journal of Scientific & Engineering Research Volume 9, Issue 4, April-2018ISSN 2229-551822The Fig 5. shows the result of Map-Reduce on multinode cluster. The time taken is 19.23 seconds.Fig 8. IP address based analysisFig 5. Result of Map-Reduce4.Visualization for Top-10 IP addresses that generatesmore traffic using RStudio is shown in Fig 9.Processing the data using Hive toolThe time taken to retrieve the Top-20 IP addresswhich generates more traffic from the input datasetusing Hive on multi-node cluster is 17.442 secondswhich is given in Fig 6.IJSERFig 9. IP based analysis using RStudioFig 6. Hive Query processing5.5 CONCLUSION AND FUTURE WORKVisualization for Top-20 protocols used in the datatransmission using Tableau Public is given in Fig 7.The network traffic analysis is very useful for the networkadmins at ISP level to monitor the packet flow and plan for thefuture. In this paper, we have compared between Hive andHadoop’s Map-Reduce programming model.As a future work, if the input dataset is unstructured wecan use Apache Pig for processing and for the dynamic (Realtime) data processing we can use Apache Spark. Also, the sizeof the cluster can be increased for the faster and massive dataprocessing.Fig 7. Procol based analysisThe Top-20 IP address that generates more traffic inthe network is shown in Fig 8.REFERENCES[1]Preethi Joshi, Arati Bhandari, Kalyani jamunkar, Kanchan Warghade,IJSER 2018http://www.ijser.org
International Journal of Scientific & Engineering Research Volume 9, Issue 4, April-2018ISSN 2229-5518[2][3][4][5][6][7]Priyanka Lokhande, “Network Traffic Analysis Measurement and Classification using Hadoop”, IJARCCE, vol. 5, Issue 3, March 2016.Rakshitha Kiran P, “Hadoop Technology for Flow Analysis of the InternetTraffic”, International Journal of Innovative Research in Computer andCommunication Engineering, vol. 3, Issue 2, February 2015.Youngseok Lee, Wonchul Kang, Hyeongu Son, “An Internet TrafficAnalysis method with MapReduce”, IEEE, 2010.Hadoop, http://hadoop.apache.org.Wireshark, http://wireshark.org.The training dataset collection – http://www.netresec.com/.Tom White, Hadoop-The Definitive Guide, 4th Edition, 2015.IJSERIJSER 2018http://www.ijser.org23
Apache Hadoop 1.0 and apache Hadoop 2.0 are the two ver-sions of Hadoop. The 1.0 version was the initial release, where there were only two modules: Map-Reduce and HDFS (Hadoop Distributed File System). The MapReduce was the -