Transcription
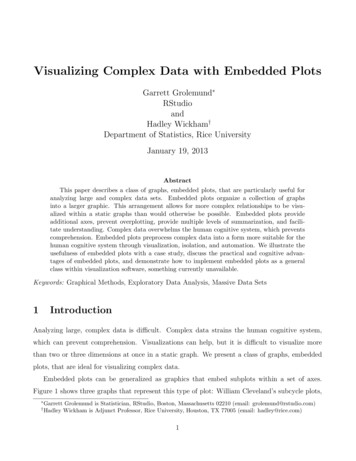
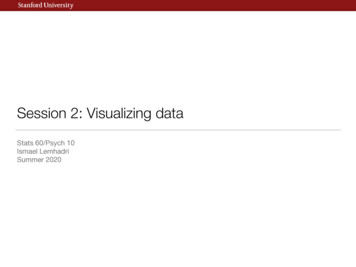
Visualizing Traffic Causality for AnalyzingNetwork Anomalies Hao Zhang, Maoyuan Sun, Danfeng (Daphne) Yao, and Chris NorthDepartment of Computer ScienceVirginia Tech, Blacksburg, VA{haozhang, smaoyuan, danfeng, north}@cs.vt.eduABSTRACTMonitoring network traffic and detecting anomalies are essential tasks that are carried out routinely by security analysts. The sheer volume of network requests often makesit difficult to detect attacks and pinpoint their causes. Wedesign and develop a tool to visually represent the causalrelations for network requests. The traffic causality information enables one to reason about the legitimacy and normalcy of observed network events. Our tool with a specialvisual locality property supports different levels of visualbased querying and reasoning required for the sensemakingprocess on complex network data. Leveraging the domainknowledge, security analysts can use our tool to identify abnormal network activities and patterns due to attacks orstealthy malware. We conduct a user study that confirmsour tool can enhance the readability and perceptibility ofthe dependency for host-based network traffic.KeywordsAnomaly Detection, Network Traffic Analysis, InformationVisualization, Usable Security, Visual Locality1.INTRODUCTIONThis paper addresses the issue of visualizing the networktraffic causality. We aim to design a visualization tool tofacilitate the process of identifying anomalous network traffic. The recently proposed detection method advances theanalysis of network traffic by inferring the semantic and logical relations [25]. Its unique advantage is the capability ofreasoning the causality or dependency of network data andthus detecting new stealthy malware activities. The analysisprovides automatic anomaly detection in the observed network activities through probabilistic reasoning of the causalrelations in traffic. By pinpointing abnormal network events This work has been supported in part by NSF grant CAREERCNS-0953638, ARO YIP W911NF-14-1-0535, and L-3 communications.Permission to make digital or hard copies of all or part of this work for personal orclassroom use is granted without fee provided that copies are not made or distributedfor profit or commercial advantage and that copies bear this notice and the full citation on the first page. Copyrights for components of this work owned by others thanACM must be honored. Abstracting with credit is permitted. To copy otherwise, or republish, to post on servers or to redistribute to lists, requires prior specific permissionand/or a fee. Request permissions from permissions@acm.org.IWSPA’15, March 4, 2015, San Antonio, Texas, USA.Copyright c 2015 ACM 978-1-4503-3341-2/15/03 . 15.00.http://dx.doi.org/10.1145/2713579.2713583 .that lack of valid triggers, it can detect malware activitieson an infected machine (e.g., making command-and-controlcommunications with its controller). The triggers includelegitimate user events and benign network packets.In this work, we design a tool to assist the analysis of hostbased network data based on traffic causality. Our visualrepresentation improves the sensemaking process for securityand can increase the productivity for analysts.Many existing network security visualization tools providegraphic user interfaces for Intrusion Detection Systems logs(e.g., Snort) [3, 5, 13, 18]. IDS alerts are organized in a logtype structure, where each alert entry indicates a potentialintrusion threat. However, very few existing work providesthe visualization of underlying relationship among networkevents, with one notable exception Portall [7]. Portall visualizes the correlation of host processes and network activities.Our request-level traffic causal relations are much more finegrained than the process-level correlation in [7]. Thus, newvisual representation approaches are needed. Our solutionaims to satisfy a unique space efficiency requirement, thatis, how to optimally utilize the screen space for displayingthe causal relations of a massive amount of network traffic.A straightforward approach for displaying host-based traffic is shown in Figure 1a. This visual representation arrangesnetwork requests using a forest layout based on their causalrelations; the timeline may be extended horizontally whennewer network events are added. Because the forest-basedlayout is intuitive, it has been used for illustrating relationsamong network events [14, 25]. However, it does not usethe display space efficiently. The length of traffic causality structure grows fast, making it difficult to view relatedevents that are temporally far apart. Statistics shows thatmore than 90% of the request causal relation falls within a30-second interval [25]. Although rare, we observe that network requests that occur 15 minutes apart may have causalrelations. Therefore, our visualization design takes theseunique traffic characteristics into considerations. To thisend, we focus on displaying items that have causal relationsin visually adjacent space. Causal relations determine theirlocations on the display. This layout provides two advantages: i) enhancing the navigation of traffic causality, andii) improving the identification of anomalous activities.Our contribution in this work is twofold. We develop a visualization tool for security analysts toefficiently display the network traffic dependency. Thistool has a visual locality feature that can optimize thedisplaying of structured data. The visual representation is a radial layout based on curved timeline display.
Compared to the straightforward forest layout, our design maximizes the use of the screen by bending thetimeline into a circle, which achieves high visual locality and extensibility. We conduct a user study to evaluate our system with10 participants and real-world network traffic. Resultsof the study show that our tool is well suited for security analysts to perform manual inspection and analysis on network events based on their causal relations.U1TimeCasual relationshipU2H1H7H2H3H4H8 H9 H11H5H6H10H12 H13 H14(a) A straightforward representation of TRG.U4U3H15TimeU5U6H19H16H17 H18TimeH25H29H30H20 H23H21 H22 H24 H26UserUi inputNetworkHi requestHiMaliciousrequest(b) Two crossing edges.H27 H28(c) Malicious requests.Figure 1: Schematic drawing of traffic causality for outbound network requests on a computer. Nodes are indexedby their relative occurrence time.2.TRG AND SECURITY MODELDefinition 1 (Triggering Relation Graph [25]).TRG is composed of two types of nodes, user input andnetwork request. The edges in TRG refer to the triggeringrelations that describe the causal relationship betweennodes. The dependencies are defined by two types of edges:i) root-trigger dependency defines the relation between alegitimate user’s input (e.g., mouse clicks on hyperlinks)and its generated first network request and ii) inter-requestdependency is the relation between two network requestswhere one directly triggers the other.Figure 1a shows an example of a TRG, where U1 H1 isan example of a root-trigger dependency edge and H1 H2is an example of an inter-request dependency edge.Triggering relations can be computed by using rule-basedmethods [24] or machine learning techniques [25]. TRG isbuilt on the application layer packets and used to find alltriggering relations to understand how a user interacts withapplications and how applications respond to the user bysending out network requests. Therefore, it reveals the logical structure of the requests, which can be used to detectabnormal network activities originated from the host. In thismodel, the events having triggering relations to a legitimatecause are benign ones.However, there is no existing tool to display the triggeringrelation graph. Straightforward attempts to visualize theTRG (e.g., using conventional straight timeline layout) maynot satisfy the high visual locality requirement. In addition,the requests with causality do not necessarily situate closeaccording to the time, as illustrated in Figure 1b (H15 -H18 ).The crossed edges make the TRG messy and hard to analyze.Definition 2 (High visual locality). Items havinglogical relations are placed close to each other on display.In our context, we define high visual locality as our primary goal to optimize our visualization designs. It enablesanalysts to easily identify related requests. To meet this requirement, our design prioritizes the causality that clustersnodes around their root-triggers and forms trees separately.Within each tree, the nodes are organized by their temporal and other logical information. In our security model, weconsider two types of stealthy malicious network traffic. Network requests without valid root triggers are referred to as vagabond (H29 in Figure 1c). Network requests sent to malicious hosts with validreferrer information are referred to as grafted (H26 -H28in Figure 1c).The vagabond requests are events without legitimatecausal relations and likely due to stealthy malware activities. The grafted requests take place when the servers aremisconfigured or compromised, and thus are hard to formalize rules to identify. Blocking the malware network activitieseffectively isolates the malware, such as spyware exfiltratingsensitive information through outbound traffic. Our TRGmodel is general and needs no priori knowledge about aparticular malware class.Analysis Using All Triggering Relations. One of thedesign choices for visualizing TRG is whether or not to display all the discovered triggering relations. A simple visualrepresentation is to only display vagabond requests, i.e.,abnormal network events. However, analysts may neglectsome attacks by viewing this type of display, because suspicious requests could be hidden from legitimate ones (i.e.,the grafted requests). For example, a common attack on webservers is to exploit web vulnerabilities (e.g., SQL injection,cross site scripting, format string injection [8]). After theservers are compromised, attackers can modify the websitesby injecting malicious codes, then the clients get infectedwhen they visit the websites. These grafted requests are often of the Javascript type with long and obfuscated requeststrings in URLs, because Javascript requests have diversified functions to be leveraged by attackers. Domain expertshave to reason the legitimacy by integrating with other information (e.g., system logs).Our TRG model provides a good visual representation fora host-based overview. The grafted requests, sent by compromised servers, can be identified by their deeper levels inTRG, late-arriving timestamps, and unusual host domains.Therefore, the analysts need to leverage the inner logic toinfer the legitimacy of requests, which makes the displayingof all triggering relations more desirable.3.VISUALIZATION DESIGNOur design for the visualization tool is based on characteristics of traffic triggering relations. We run a pilot studythat contains 12MB network data (10-hour HTTP traffic ona host, 45000 requests) to investigate the characteristics oftraffic dependency. We summarize our findings as follows.Wide-and-shallow trees. The nodes on the top threelevels in TRG account for above 90% of the total amount.There are respectively 68% and 21% of requests on the second and third levels, so the trees are extremely wide on their
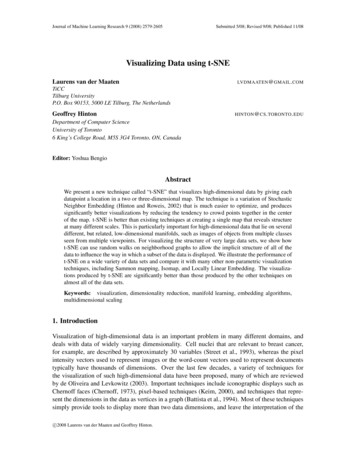
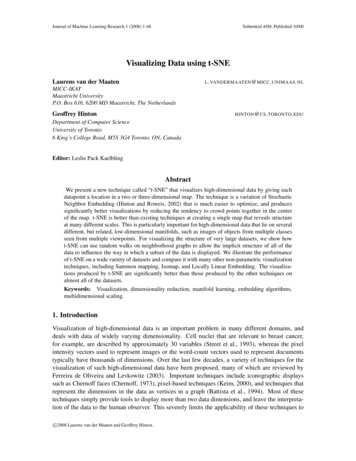
top levels. Besides, 99.7% of trees in TRG have less than 6levels, while there is only 0.3% of trees whose depth is 7 to9 levels, which illustrates the shallowness of the trees.Temporally adjacent events. We further check thetime difference between any two requests that have a triggering relationship. Statistics shows that about 93% of HTTPrequests trigger their dependencies within 3 minutes. If thetime window is enlarged to 15 minutes, then 99.8% of HTTPrequests and their dependencies are included. Therefore, theHTTP requests with dependents are temporally close to eachother, despite some rare cases.Sparsity of vagabonds. The vagabond requests areclassified into two groups. Malicious and misconfiguredpackets represent 0.3% and 0.5% respectively of the totalnumber of nodes. Malicious requests are sent when a uservisits a compromised website or the host is infected by malware. Misconfigured requests are not sent to malicious hostsbut contain some missing fields in the request header.Automatic update requests. The updates are the legitimate requests sent to upgrade the system or softwareperiodically, without user interaction. In our design, wemaintain a list of known programs and their official upgrade domains to reduce the false alarms (e.g., Java UpdateChecker and its update domains javadl-esd.sun.com andjavadl.oracle.com).Our design aims to visualize the traffic dependency of network requests by meeting the high visual locality principle,so users can identify and analyze the anomalies with ease.We utilize a radial design for displaying traffic triggering relations. This design has a curved timeline that is centeredat the display, and the radiating branches represent networktraffic events and their trigger relations. The advantage ofthis view design is that it maximizes the utilization of thedisplay screen. It is more convenient for users to interactwith this view than a conventional straight timeline view.We further provide a condensed view to simplify the displayby merging the trivial nodes. In addition, our design uses aheatmap to show the distribution of the requests over timeand store original logs in each color-coded tile.3.1Visual Locality Design for AnalystsWe design a radial layout to display the traffic dependencywith high visual locality. A straightforward visualization ofTRG would be an axial layout in Figure 2a, however it isnot suitable for visualizing large-scale traffic dependencies.This layout is not efficient at displaying hierarchy structures,as the tree structure spans unilaterally and leads to muchunused space. In addition, the length of the forests growsas the data size increases. Users have to scroll up and downfor browsing and searching. In the radial layout shown inFigure 2b, we arrange the nodes in a clockwise manner. Inthis design, time line defines the positive direction and thestart point is at 12 o’clock position, which is consistent withan analog clock and intuitive to users.Our prototype arranges the nodes and allocates the spaceof the radial layout as follows.(1) We sort the root-triggers by their timestamps and plotthem in the innermost ring. We cluster the nodes under their root-triggers. Clustering nodes of each treeguarantees there is no cross edges in the display.(2) The rendering space is allocated in proportion to thenumber of nodes on its second level, rather than thetimespan of the tree in TRG. The time spans of each treeUser EventHTTP RequestTriggeringRelationTime LineLevel Line(a) Axial layout.(b) Radial layout.Figure 2: Schematic diagrams of two visualization designsfor the structured network data.in TRG may overlap. Requests from different trees mayarrive simultaneously. Our layout, based on indexingnodes, eliminates the overlapping issue.(3) We render the nodes by their levels. The level lines areused to align the nodes on the same level. The nodeson the same level are lined up on the concentric arcs.The innermost ring is used to place the user inputs, andis divided into sectors whose angles correspond to thesizes of its dependent nodes.Our design maximizes the usage of display space. The radial layout presents hierarchies of events in concentric rings.Users using the conventional forest-like layout need to scrolltwice more than our design. Additionally, by concentratingnodes at the center of the screen, the radial layout enablesusers to easily manipulate the display.3.2Interactive Heatmap for Accessing Original Traffic LogsHeatmap is a graphical data presentation approach whereeach value in the matrix is color-coded. Our design is composed of LogMap, an instance of Heatmap (see Figure 4). TheLogMap reveals the density information of the network requests. It provides an overview of the request distributionover the observed period. The LogMap accommodates different levels of time-period granularities, e.g., seconds, minutes,hours, etc. Last, security analysts often resort to the original logs for more details. In our design, the LogMap supportsusers to access the original logs by clicking on the coloredtiles in the heatmap.The LogMap divides the timeline into fixed windows and organizes network events occurred in each time window into asub-block. In our design, there are sixty tiles in a sub-block,which represents sixty seconds. The color coding in each tilecorresponds to the number of requests. The granularity ofevents displayed on the LogMap can be adjusted according toanalysts’ needs.3.3Condensed View to Distill InformationAccording to our pilot study, more than 90% of networkrequests are situated on the top three levels in the TRG. Toavoid visual clutter, we provide a condensed view for securityanalysts. We design a condensing algorithm to merge thenodes that meet all the following criteria. Legitimate requests that are of the same type; Requests that are on the same level in the TRG; Requests that are the leaf nodes in the TRG.The algorithm iterates a list of chronologically sorted requests and outputs a list of condensed nodes. We use an
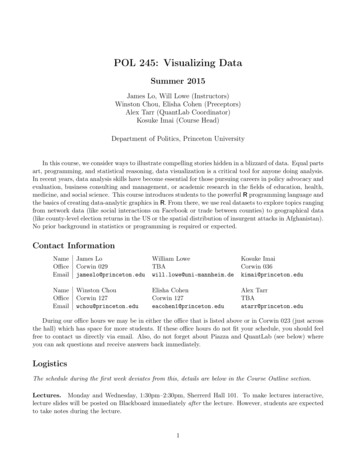
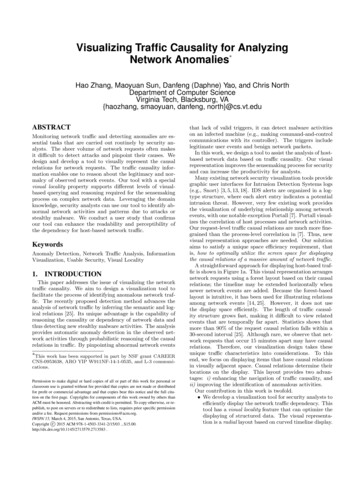
auxiliary dictionary to store each newly generated node anda list of requests being condensed. In the condensing algorithm, we only merge the benign requests, so as to avoidlosing any information of abnormal requests. Our condensing algorithm does not merge the nodes on the different(sub)trees, which guarantees that the dependency structurein a TRG is preserved. Therefore, the condensed views arecompatible to the original radial and axial layouts.We categorize the HTTP requests into six types, which areweb, CSS, Javascript, multimedia, data, and others. Around50% of browser-generated HTTP requests are used to fetchthe multimedia objects (e.g., image or streaming data) inour pilot study. Unlike Javascript objects, these requests toobtain static files do not trigger further HTTP traffic.To evaluate the effectiveness of the condensing algorithmfor reducing the redundancy and emphasizing the anomalies,we test our tool on the pilot study dataset. Shown in Table 1, we compare the number of nodes in both original andcondensed views. Compression ratio is defined to qualify theeffectiveness of the algorithm. The root-triggers are on thefirst level, and thus cannot be compressed. There are 68%of total requests situated on the second level, and 87.5% ofthem are merged, which significantly saves space. Overall,the total compression ratio is 82.2%. Multimedia requestsmostly serve as leaf nodes and can be compressed as muchas 91%. Compared with the original view, our condensedview significantly reduces the redundancy of displaying leafnodes. Therefore, it helps users identify abnormal nodes dueto its visually salient.Levelin TRG1234567-9Total# of nodes inoriginal view (n)# of nodes incondensed view 549248203Compressionc)ratio (1 n0.0%87.5%77.5%76.6%73.1%75.6%67.6%82.2%Table 1: The number of HTTP requests on each level in theTriggering Relation Graph for original and condensed views.4.PROTOTYPE IMPLEMENTATIONWe build ReView, a visualization tool for viewing and analyzing the triggering relations for network requests. It is designed based on the three-tier architecture and implementedas a web-based tool. The workflow is illustrated in Figure 3.Data StorageUser InputLogNetworkTraffic LogVulnerabilityDatabaseData TierReasoningEngineVisualizationEngineHierarchical Data ParserFilteringHighlight(node, path)Condensed dataStatisticsLogic Tierlibrary. The features of an HTTP request include its timestamp, process ID, source and destination IP address, andrequest semantic information (e.g., HTTP host domain andreferrer). In the dat
Visualization, Usable Security, Visual Locality 1. INTRODUCTION This paper addresses the issue of visualizing the network tra c causality. We aim to design a visualization tool to facilitate the process of identifying anomalous network traf- c. The recently proposed detection method ad