Transcription
Non Parametric Tests: Hands on SPSSNon Parametric Tests: Hands on SPSSN. Uttam Singh, Aniruddha Roy & A. K. TripathiICAR Research Complex for NEH Region, Umiam, Meghalayauttamba@gmail.com, aniruddhaubkv@gmail.com, aktripathi2020@yahoo.co.inChapter 1:IntroductionWhich is more powerful (parametric and non-parametric tests)Parametric AssumptionsNonparametric AssumptionsAdvantages of Nonparametric TestsDisadvantages of nonparametric testsFew important points on nonparametric testMeasurementParametric vs. non-parametric testsNonparametric MethodsChapter2:Tests of relationships between variablesChi-square TestBinomial TestRun Test for RandomnessOne-Sample Kolmogorov-Smirnov TestChapter 3:Two-Independent-Samples TestsMann-Whitney U testThe two-sample Kolmogorov-Smirnov testWlad-Walfowitz RunMozes Extreme ReactionsChapter 4:Multiple Independent Samples TestsMedian testKruskal-Wallis HJonckheere-terpstra testChapter 5:Tests for Two Related SamplesWilcoxon signed-ranksMcNemarMarginal-homogeinitySign testChapter 6:Tests for Multiple Related SamplesFriedmanCochran’s QKendall’s WChapter 7:Exact Tests and Monte Carlo MethodThe Exact MethodThe Monte Carlo MethodWhen to Use Exact TestsTest Questions:References:N. Uttam Singh, Aniruddha Roy & A. K. Tripathi – 20131
Non Parametric Tests: Hands on SPSSThey are called nonparametric because they make no assumptions about the parameters (such as the mean andvariance) of a distribution, nor do they assume that any particular distribution is being used.IntroductionA parametric statistical test is one that makes assumptions about the parameters (defining properties) of the populationdistribution(s) from which one's data are drawn.A non-parametric test is one that makes no such assumptions. In this strict sense, "non-parametric" is essentially a nullcategory, since virtually all statistical tests assume one thing or another about the properties of the source population(s).Which is more powerful?Non-parametric statistical procedures are less powerful because they use less information in their calculation. Forexample, a parametric correlation uses information about the mean and deviation from the mean while a non-parametriccorrelation will use only the ordinal position of pairs of scores.Parametric Assumptions The observations must be independent The observations must be drawn from normally distributed populations These populations must have the same variances The means of these normal and homoscedastic populations must be linear combinations of effects due to columnsand/or rowsNonparametric AssumptionsCertain assumptions are associated with most nonparametric statistical tests, but these are fewer and weaker thanthose of parametric tests.Advantages of Nonparametric Tests Probability statements obtained from most nonparametric statistics are exact probabilities, regardless of theshape of the population distribution from which the random sample was drawn If sample sizes as small as N 6 are used, there is no alternative to using a nonparametric test Easier to learn and apply than parametric tests Based on a model that specifies very general conditions. No specific form of the distribution from which the sample was drawn. Hence nonparametric tests are also known as distribution free tests.Disadvantages of nonparametric tests Losing precision/wasteful of data Low power False sense of security Lack of software Testing distributions only Higher-ordered interactions not dealt with Parametric models are more efficient if data permit. It is difficult to compute by hand for large samples Tables are not widely available In cases where a parametric test would be appropriate, non-parametric tests have less power. In other words,a larger sample size can be required to draw conclusions with the same degree of confidence.Few points The inferences drawn from tests based on the parametric tests such as t, F and Chi-square may be seriouslyaffected when the parent population’s distribution is not normal. The adverse effect could be more when sample size is small. Thus when there is doubt about the distribution of the parent population, a nonparametric method should beN. Uttam Singh, Aniruddha Roy & A. K. Tripathi – 20132
Non Parametric Tests: Hands on SPSSused. In many situations, particularly in social and behavioral sciences, observations are difficult or impossible totake on numerical scales and a suitable nonparametric test is an alternative under such situations.MeasurementThe 4 levels of measurement1. Nominal or Classificatory Scale Gender, ethnic background, colors of a spectrum In research activities a YES/NO scale is nominal. It has no order and there is no distancebetween YES and NO.2. Ordinal or Ranking Scale Hardness of rocks, beauty, military ranks The simplest ordinal scale is a ranking. There is no objective distance between any two points on your subjective scale.3. Interval Scale Celsius or Fahrenheit. It is an interval scale because it is assumed to have equidistantpoints between each of the scale elements.4. Ratio Scale Kelvin temperature, speed, height, mass or weight Ratio data is interval data with a natural zero pointParametric vs. non-parametric testsParametricNon-parametricAssumed distributionNormalAnyAssumed varianceHomogeneousAnyTypical dataRatio or IntervalOrdinal or NominalData set relationshipsIndependentAnyUsual central measureMeanMedianBenefitsCan draw more conclusionsSimplicity; Less affected by outliersTestsChoosingChoosing parametric testChoosing a non-parametric testCorrelation testPearsonSpearmanIndependent measures, 2 groupsIndependent-measures t-testMann-Whitney testIndependent measures, 2 groupsOne-way, independent-measuresANOVAKruskal-Wallis testRepeated measures, 2 conditionsMatched-pair t-testWilcoxon testRepeated measures, 2 conditionsOne-way, repeated measures ANOVAFriedman's testN. Uttam Singh, Aniruddha Roy & A. K. Tripathi – 20133
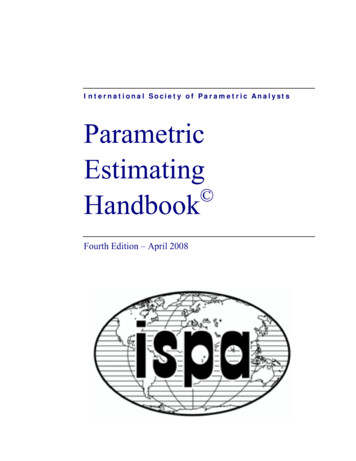
Non Parametric Tests: Hands on SPSSNonparametric MethodsThere is at least one nonparametric test equivalent to a parametric testTests of relationships between variablesChi-square TestThis goodness-of-fit test compares the observed and expected frequencies in each category to test either that all categoriescontain the same proportion of values or that each category contains a user-specified proportion of values.ExamplesThe chi-square test could be used to determine if a basket of fruit contains equal proportions of apples, bananas, oranges,and mon4banana3orange1lemon4lemon4N. Uttam Singh, Aniruddha Roy & A. K. Tripathi – 20134
Non Parametric Tests: Hands on SPSSSPSS Steps:Get the data.Follow the steps as shownN. Uttam Singh, Aniruddha Roy & A. K. Tripathi – 20135
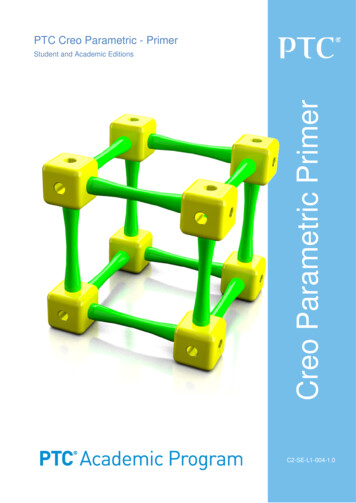
Non Parametric Tests: Hands on SPSSGet the count in the test variable listClick OK and get the output as shown belowInterpretation:Here p value is 0.981 which is more than 0.05. Hence it is not significant and we fail to reject the null hypothesis andconclude that there is no significant difference in the proportions of apples, bananas, oranges, and peaches.We could also test to see if a basket of fruit contains 10% apples, 20% bananas, 50% oranges, and 20% peaches. For thiswe have to define the proportions by checking the button “Values” and keep on adding.Binomial TestThe Binomial Test procedure is useful when you want to compare a single sample from a dichotomous variable to anexpected proportion. If the dichotomy does not exist in the data as a variable, one can be dynamically created based upona cut point on a scale variable (take age as example from the data). If your variable has more than two outcomes, try theChi-Square Test procedure. If you want to compare two dichotomous variables, try the McNemar test in theTwo-Related-Samples Tests procedure.N. Uttam Singh, Aniruddha Roy & A. K. Tripathi – 20136
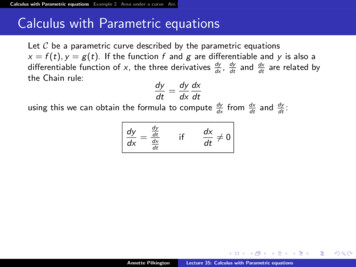
Non Parametric Tests: Hands on SPSSExampleSay we wish to test whether the proportion of females from the variable “gender” differs significantly from 50%, i.e.,from 0.5. We will use the exact statement to produce the exact p-values.Age Marital Status Family Size Land Holding Achievement Market Orientation Problem 11113141000010101011001111000110SPSS Steps:Get the data.N. Uttam Singh, Aniruddha Roy & A. K. Tripathi – 20137
Non Parametric Tests: Hands on SPSSFollow the steps as shown belowGet the variable gender in the test variable list.N. Uttam Singh, Aniruddha Roy & A. K. Tripathi – 20138
Non Parametric Tests: Hands on SPSSClick OK and get the outputInterpretation:Since p value is 1 it is not significant and we fail to reject null hypothesis and conclude that the proportion of femalesfrom the variable “gender” does not differ significantly from 50%.Run Test for RandomnessRun test is used for examining whether or not a set of observations constitutes a random sample from an infinitepopulation. Test for randomness is of major importance because the assumption of randomness underlies statisticalinference. In addition, tests for randomness are important for time series analysis. Departure from randomness can takemany forms. The cut point is based either on a measure of central tendency (mean, median, or mode) or a custom value. Asample with too many or too few runs suggests that the sample is not random.ExampleLet’s see whether the variable “AGE” in the dataset below is random.Table: Cancer datasetIDTRTAGEWEIGHIN STAGE TOTALCIN TOTALCW2 TOTALCW4 77501601642681658154172.8478108N. Uttam Singh, Aniruddha Roy & A. K. Tripathi – 20139
Non Parametric Tests: Hands on SPSSSPSS Steps:Load the data.Follow the following steps.N. Uttam Singh, Aniruddha Roy & A. K. Tripathi – 201310
Non Parametric Tests: Hands on SPSSSelect “AGE” in the test variables list.This variable “AGE” must be divided into two spate groups. Therefore we must indicate a cut point. Now lets takeMedian as the cut point. Any value blow the median point will belong to one group and any value greater than or equal tomedian will belong to the other group. Now click OK to get output.Interpretation:Now p value is 0.450. So it is not significant and we cannot say that AGE is not random.One-Sample Kolmogorov-Smirnov TestThe One-Sample Kolmogorov-Smirnov procedure is used to test the null hypothesis that a sample comes from a particulardistribution. Four theoretical distribution functions are available-- normal, uniform, Poisson, and exponential. If we wantto compare the distributions of two variables, use the two-sample Kolmogorov-Smirnov test in theTwo-Independent-Samples Tests procedure.Example: Let us test the variable “AGE” in the cancer dataset used for Run test above is normal distribution or uniformdistribution.N. Uttam Singh, Aniruddha Roy & A. K. Tripathi – 201311
Non Parametric Tests: Hands on SPSSSPSS StepsGet the data as done before. Then Select “AGE” in the test variable list.Check the distribution for which you want to test. Click OK and get the output.N. Uttam Singh, Aniruddha Roy & A. K. Tripathi – 201312
Non Parametric Tests: Hands on SPSSInterpretation:The p value is 0.997 which is not significant and therefore we cannot say that “AGE” does not have an approximatenormal distribution. If the p value were less than 0.05 we would say it is significant and AGE does not follow anapproximate normal distribution.Two-Independent-Samples TestsThe nonparametric tests for two independent samples are useful for determining whether or not the values of a particularvariable differ between two groups. This is especially true when the assumptions of the t test are not met. Mann-Whitney U test: To test for differences between two groups The two-sample Kolmogorov-Smirnov test: To test the null hypothesis that two samples have the samedistribution Wlad-Walfowitz Run: Used to examine whether two random samples come from populations having samedistribution Mozes Extreme Reactions: Exact TestExample: We want to find out whether the sales are different between two 3222628N. Uttam Singh, Aniruddha Roy & A. K. Tripathi – 20131111122222333344444store size123451234512341234513
Non Parametric Tests: Hands on SPSSSPSS Steps:Open the datasetLet’s compare between design 1 and 2.Enter variable sales in test variable list and design in grouping variable.N. Uttam Singh, Aniruddha Roy & A. K. Tripathi – 201314
Non Parametric Tests: Hands on SPSSSince we are performing two independent sample tests we have to designate which two groups in our factor design wewant to compare. So click “Define groups”.Here we type group 2 and 1. Order is not important, only we have to enter two distinct groups. Then click continue andOK to get output.Interpretation:Now two p values are displayed, asymptotic which is appropriate for large sample and exact which is independent ofsample size. Therefore we will take the exact p value i. e. 0.548 which is not significant and we conclude that there is nosignificant difference in sales between the design group 1 and group 2.N. Uttam Singh, Aniruddha Roy & A. K. Tripathi – 201315
Non Parametric Tests: Hands on SPSSMultiple Independent Samples TestsThe nonparametric tests for multiple independent samples are useful for determining whether or not the values of aparticular variable differ between two or more groups. This is especially true when the assumptions of ANOVA are notmet. Median test: This method tests the null hypothesis that two or more independent samples have the samemedian. It assumes nothing about the distribution of the test variable, making it a good choice when yoususpect that the distribution varies by group Kruskal-Wallis H: This test is a one-way analysis of variance by ranks. It tests the null hypothesis thatmultiple independent samples come from the same population. Jonckheere-terpstra test: Exact testExample:We want to find out whether the sales are different between the designs (Comparing more than two samplessimultaneously)SPSS Steps:Get the data in SPSS window as done before. Then N. Uttam Singh, Aniruddha Roy & A. K. Tripathi – 201316
Non Parametric Tests: Hands on SPSSDefine rangeClick continue then OK to get output.Interpretation:P value is 0.003 which is significant. Therefore we conclude that there is significant difference between the groups(meaning- at least two groups are different)Tests for Two Related SamplesThe nonparametric tests for two related samples allow you to test for differences between paired scores when you cannot(or would rather not) make the assumptions required by the paired-samples t test. Procedures are available for testingnominal, ordinal, or scale variables. Wilcoxon signed-ranks: A nonparametric alternative to the paired-samples t test. The only assumptionsmade by the Wilcoxon test are that the test variable is continuous and that the distribution of the differencescores is reasonably symmetric. McNemar method tests the null hypothesis that binary responses are unchanged. As with the Wilcoxon test,the data may be from a single sample measured twice or from two matched samples. The McNemar test isparticularly appropriate with nominal or ordinal test variables for binary data. Unlike the Wilcoxon test, theMcNemar test is designed for use with nominal or ordinal test variables. Marginal-homogeinity: If the varialbles are mortinomial i.e if they have more than two levels. Sign test: Wilkoxon and Sign are used for contineous data and of the two wilkoxon is more powerfulN. Uttam Singh, Aniruddha Roy & A. K. Tripathi – 201317
Non Parametric Tests: Hands on SPSSExample: Use the cancer data deployed in Run Test to test whether the condition of the cancer patient at the end of 2ndweek and 4th week are significantly different. (here higher the reading, better is the condition)N. Uttam Singh, Aniruddha Roy & A. K. Tripathi – 201318
Non Parametric Tests: Hands on SPSSOutput:Interpretation:P value is 0.006 which is significant. This indicates that the condition of cancer patient at the end of 2nd week and 4th weekare different.Tests for Multiple Related SamplesThe nonparametric tests for multiple related samples are useful alternatives to a repeated measures analysis of variance.They are especially appropriate for small samples and can be used with nominal or ordinal test variables.Friedman test is a nonparametric alternative to the repeated measures ANOVA. It tests the null hypothesis thatmultiple ordinal responses come from the same population. As with the Wilcoxon test for two related samples, thedata may come from repeated measures of a single sample or from the same measure from multiple matched samples.The only assumptions made by the Friedman test are that the test variables are at least ordinal and that theirdistributions are reasonably similar.Cochran’s Q: It tests the null hypothesis that multiple related proportions are the same. Think of the Cochran Q testas an extension of the McNemar test used to assess change over two times or two matched samples. Unlike theFriedman test, the Cochran test is designed for use with binary variables.Kendall’s W: is a normalization of Friedman test and can be interpreted as a measure of agreementN. Uttam Singh, Aniruddha Roy & A. K. Tripathi – 201319
Non Parametric Tests: Hands on SPSSSPSS steps:OutputN. Uttam Singh, Aniruddha Roy & A. K. Tripathi – 201320
Non Parametric Tests: Hands on SPSSInterpretation:P value is less than 0.05. Hence there is significant difference between the four groups (meaning- at least two groups aredifferent)Exact Tests and Monte Carlo MethodThese new methods, the exact and Monte Carlo methods, provide a powerful means for obtaining accurate results whenyour data set is small, your tables are sparse or unbalanced, the data are not normally distributed, or the data fail to meetany of the underlying assumptions necessary for reliable results using the standard asymptotic method.The Exact MethodBy default, IBM SPSS Statistics calculates significance levels for the statistics in the Crosstabs and NonparametricTests procedures using the asymptotic method. This means that p values are estimated based on the assumption that thedata, given a sufficiently large sample size, conform to a particular distribution.However, when the data set is small, sparse, contains many ties, is unbalanced, or is poorly distributed, the asymptoticmethod may fail to produce reliable results. In these situations, it is preferable to calculate a significance level based onthe exact distribution of the test statistic. This enables you to obtain an accurate p value without relying on assumptionsthat may not be met by your data.The Monte Carlo MethodAlthough exact results are always reliable, some data sets are too large for the exact p value to be calculated, yet don’tmeet the assumptions necessary for the asymptotic method. In this situation, the Monte Carlo method provides anunbiased estimate of the exact p value, without the requirements of the asymptotic method.The Monte Carlo method is a repeated sampling method. For any observed table, there are many tables, each with thesame dimensions and column and row margins as the observed table. The Monte Carlo method repeatedly samples aspecified number of these possible tables in order to obtain an unbiased estimate of the true p value.The Monte Carlo method is less computationally intensive than the exact method, so results can often be obtained morequickly. However, if you have chosen the Monte Carlo method, but exact results can be calculated quickly for your data,they will be provided.When to Use Exact TestsCalculating exact results can be computationally intensive, time-consuming, and can sometimes exceed the memory limitsof your machine. In general, exact tests can be performed quickly with sample sizes of less than 30. Table 1.1 provides aguideline for the conditions under which exact results can be obtained quickly.N. Uttam Singh, Aniruddha Roy & A. K. Tripathi – 201321
Non Parametric Tests: Hands on SPSSTest QuestionsReferencesNONPARAMETRIC TESTSEldho Varghese and Cini VargheseIndian Agricultural Statistics Research Institute, New Delhi - 110 012eldho@iasri.res.in, cini v@iasri.res.inIBM SPSS Exact TestsCyrus R. Mehta and Nitin R. PatelIBM SPSS Statistics Base 20N. Uttam Singh, Aniruddha Roy & A. K. Tripathi – 201322
Choosing Choosing parametric test Choosing a non-parametric test Correlation test Pearson Spearman Independent measures, 2 groups Independent-measures t-test Mann-Whitney test Independent measures, 2 groups One-way, independent-measures ANOVA Kruskal-Wallis test Repeated measures, 2 conditions Matched-pair t-test Wilcoxon test