Transcription
NetViewer: A Network TrafficVisualization and Analysis ToolSeong Soo Kim and A. L. Narasimha Reddy – Texas A&M UniversityABSTRACTThe frequent and large-scale network attacks have led to an increased need for developingtechniques for analyzing network traffic. If efficient analysis tools were available, it could becomepossible to detect the attacks, anomalies and to appropriately take action to contain the attacksbefore they have had time to propagate across the network. This paper describes NetViewer, anetwork monitoring tool that can simultaneously detect, identify and visualize attacks andanomalous traffic in real-time by passively monitoring packet headers. NetViewer represents thetraffic data as images, enabling the application of image/video processing techniques for theanalysis of network traffic.NetViewer is released free to the general public. By employing a freely availablevisualization tool, the users of NetViewer can comprehend the characteristics of the network trafficobserved in the aggregate. NetViewer can be employed to detect and identify network anomaliessuch as DoS/DDoS attacks, worms and flash crowds. NetViewer can also provide information ontraffic distributions over IP address/port number domains, utilization of link capacity andeffectiveness of Quality of Service policies.Introduction1The frequent and increasing malicious attacks onnetwork infrastructure, using various forms of denial ofservice attacks, have led to an increased need for developing techniques for analyzing network traffic. If efficient analysis tools were available, it could becomepossible (i) to detect the attacks, anomalies and (ii) toappropriately take action to mitigate the attacks beforethey have had time to propagate across the network orto cripple the infrastructure. These tools may be in turnuseful for traffic engineering purpose since the networktraffic analysis provided by these tools could lead to theidentification of resource bottlenecks and peak usage.A variety of tools for flow-based measurementhave arisen from both the commercial and free software communities. To study and classify traffic on thenetwork based on usage and protocols, a number oftools such as FlowScan [PLO00], Cisco’s FlowAnalyzer, and AutoFocus [ESTsv03], are used as trafficanalyzers. While flow-based features within the network infrastructures are convenient, such approachesmay not be sufficient for reliable and fast application.Some of these tools provide real-time reporting capability, but much of the analysis is done off-line. Thesetools have been effectively utilized for traffic engineering and postmortem anomaly detection.However, rigorous real-time analysis is neededfor detecting and identifying the anomalies so thatmitigation action can be taken as promptly as possible.1This work is supported by NSF grants ANI-0087372,0223785, Texas Higher Education Board, Texas InformationTechnology and Telecommunications Taskforce and IntelCorp.2005 LISA XIX – December 4-9, 2005 – San Diego, CASome of these tools are based on the volume of trafficsuch as byte counts and packet counts. When links arenot sufficiently provisioned, normal traffic volumesmay reach the capacity of the links most of the time.In such cases, attack traffic may not induce significantovershoot in traffic volume (merely replacing existingnormal traffic) and hence may make traffic volumesignal ineffective in detecting attacks.Sophisticated low-rate attacks [EUZk03] andreplacement attacks, which don’t give rise to noticeable variance in traffic volume, could go undetectedwhen only traffic volume is considered. Furthermore,the tools which collect and process flow data may notscale to high-speed links as they focus on individualflow behavior. Our tool tries to look at aggregatepacket header data in order to improve scalability.Intrusion detection systems (IDS) such as Snortand Bro are an important part of network securityarchitecture and signature database-based monitoringof network traffic for predefined suspicious activity orpatterns. These tools are widely deployed by networkadministrators. This detection principle relies on theavailability of established rules of the anomalous orsuspicious network traffic activity. While the identification mechanism of the IDS tools provides fine-graincontrol of network flows, they however need to beupdated continuously with the latest rules for copingwith novel attacks. Our approach tries to develop ageneric mechanism independent of specific anomaliesfor improving adaptability.In this paper, we describe a tool namedNetViewer for traffic anomaly detection based onanalyzing the distribution of traffic header data, in1
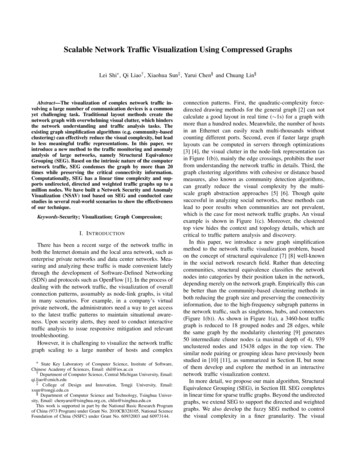
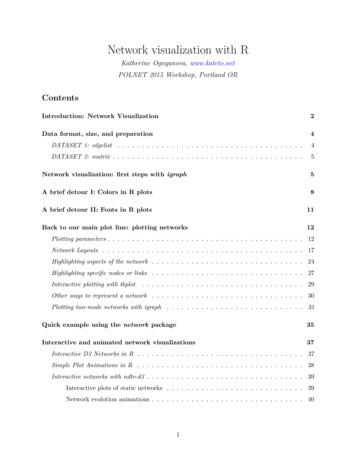
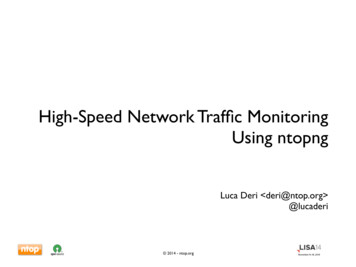
NetViewer: A Network Traffic Visualization and Analysis Toolpostmortem and in real-time. We adopt a networkmeasurement-based approach that can simultaneouslydetect, identify and visualize attacks and anomaloustraffic in real-time. We propose to represent samplesof network packet header data as frames or images.With such a formulation, a series of samples canbe seen as a sequence of frames or video. This enablestechniques from image processing and video compression such as scene change analysis and motion prediction to be applied to the packet header data to revealinteresting properties of traffic. Our work here bringstechniques from image processing and video analysis tovisualization and real-time analysis of traffic patterns.We show that ‘‘scene change analysis’’ canreveal sudden changes in traffic behavior or anomalies[LELs03, ZHAks93, LIEke97, SHEd95, GYAkc03].We show that ‘‘motion prediction’’ techniques can beemployed to understand the future patterns of some ofthe attacks. We show that it may be feasible to represent multiple pieces of data as different colors of animage enabling a uniform treatment of multidimensional packet header data. NetViewer can give an intuitive and descriptive illustration of network traffic,with visible features, to network operators.A .D .In tern etA .D .in g ressro u tereg ressro u te rco rero u terV ictim sA ttac k ersFigure 1: The installation locations of NetViewer. Foringress/egress filtering, it can be employed in arouter or at the boundary of an administrativedomain.EnvironmentThe visibility of fields in the network packetsmay be impacted by the location where traffic isobserved. NetViewer can be applied for analyzinginbound/outbound traffic at administrative domain(AD) edge router as shown in Figure 1. The AD represents the access link, ISP (Internet Service Provider)and intra-domain IP-based networks such as enterprisenetworks and campus networks.Employing ingress filtering with NetViewermonitors the flow of traffic as it enters a networkunder administrative control. NetViewer can be combined with a Quality of Service (QoS) policy framework to rate limit high-bandwidth flows identified byNetViewer.2Kim and ReddyEgress filtering with NetViewer inspects the flowof traffic as it leaves a network under administrativecontrol. There are typically policy regulations forinner machines initiating outgoing connections to theInternet. Outbound filtering has been advocated forlimiting the possibility of address spoofing, i.e., tomake sure that source addresses correspond to the designated addresses for the AD. Traffic monitoring at asource network enables a detector to detect attacksearly, to control hijacking of AD machines, and tolimit the liability from such attacks and the squandering of resources. NetViewer can help prevent compromised systems on a network from attacking systemselsewhere through egress filtering.Our traffic attack/anomaly filtering efforts havebeen targeted at the edge environment due to resourceutilization issues and source address spoofing concerns.GoalsNetViewer ’s goal is not to detect and eliminatethe anomalies eradicatively, but to bring the anomalous traffic under control in real-time so that the mitigation mechanisms could be deployed fast to counterthe threats of the anomalies. We also want NetViewerto not contain any legitimate traffic in the process ofcontaining attack traffic. Our goal is to detect and contain 99.7% of the attack and anomalous traffic at afalse alarm rate of 0.3%. Given the current and growing network link speeds, anything we implementneeds to be fast and efficient enough to not excessively burden existing network infrastructure.As an operational goal, we want that the containment is centrally processed at a router level, ratherthan something that the end users would have to dealwith. Netviewer can work with packets on the fly at arouter in real-time mode and packet traces in libpcapor NetFlow format in post-mortem mode.ArchitectureNetViewer ’s architecture is mainly focused onperformance, simplicity, and versatility. NetViewersystem’s architecture consists of five major softwarecomponents: the packet parser, the signal computingengine, the detection engine, the visualization engineand the alerting engine, which are programmed inANSI C and Matlab language [MAT01].The Packet ParserThe packet parser engine is responsible for collecting and processing raw packets and traffic dataexported from routers. NetViewer can work with traffic records in postmortem or work with more aggregate data upon packet arrival in real-time. It can parsepackets on the fly and parse network packet headertraces with libpcap (packet capture library) [PCAP94],Cisco’s NetFlow [NETF] and NLANR formats[NLA02] such as DAG, Coral, and TSH (timesequenced headers).2005 LISA XIX – December 4-9, 2005 – San Diego, CA
Kim and ReddyNetViewer: A Network Traffic Visualization and Analysis ToolTraffic volume, such as packet counts, bytecounts and the number of flows, can be used as a signal, and fields in the packet header, such as addresses,port numbers and protocols, can be employed as anobserved domain. According to operator’s concern,NetViewer then generates images of the distribution oftraffic intensity in the chosen domain. Based on thekinds of traffic data and the header domain, we categorize the image-based signals into address-based,flow-based and port-based signals. Address-based signal employs packet count distribution over addressdomain (either source address alone, or destinationaddress alone, or a 2-dimensional source and destination address domain). Flow-based signal employs theflow number distribution over address domain(s).Port-based signal employs packet count distributionover port number domain.Traffic headers such as addresses and port numbers have larger spaces over which data is distributed,that is, 232 IPv4 addresses and 216 port numbers. Anydeveloped technique should be simple enough to bedeployable, i.e., should not be expensive in terms ofmemory and processing resources. In order to addressthe problem of large domain spaces, we haveemployed a concise data structure for reducing thedomain space [KIMrv04]. We explain this data structure using address-based signal as an example. Thisdata structure count[i][j][t] represents the data sampleat time t.The data structure consists of 4 arrays count [4]for the 4 bytes of the IP address. Within each array, wehave 256 locations, for a total of 4*256 locations 1024 locations. By default, the size of one location isset to 16 bits. A location count[i][j][t] is used torecord the packet count for the address j in ith field ofthe IP address in time interval t. This provides a concise description of the address instead of 232 locationsthat would be required to store the address occurrenceuniquely. Upon packet arrival, the corresponding fourpositions of the data structure are updated throughscaling.The Signal Computing EngineEach sampling period, the packet counts of theentire traffic are recoded to the corresponding positionsof each IP address byte-segment, and the normalizedpacket count is quantized and represented using Equation (1). Each resultant normalized packet count thenrepresents the intensity of the corresponding pixel in theimage representation of the traffic as shown in Figure 2.count[i][j][t]i 0, 1, 2, 3pijt 255,(1)j 0, . . . , 255Σ count[i][j][t]j 0In order to quantitatively analyze the networktraffic anomalies, we compute correlation and deltasbased on normalized packet counts. Consider twoadjacent sampling instants. We can define correlation2005 LISA XIX – December 4-9, 2005 – San Diego, CAsignal at sampling point t by (2-1), which measurescorrelation of traffic intensity at a particular address.Delta is defined as the difference of normalized packetcounts by (2-2), which is a useful signal at the beginning and ending of attacks.Cijt pijt pijt 1(2-1) pijt pijt pijt 1(2-2)We employ the variance of pixel intensities in theimage as traffic signal for scene change analysis,which is denoted by Sσ . Using the variance of theseimage signals for deriving thresholds, we can obtainan approximation of the energy distribution of the normalized packet counts within the observation domainas follows:1 2 1 3 2552p)Sσ (p ijtijtΣΣ 1024 i 1 j 0(3)3 255where pijt are pixel intensities and pijt Σ Σ pijt .i 0 j 0Upon each sampling instant, the aggregate trafficsignal is instantaneously calculated based on accumulated data structure for real-time analysis.The Detection EngineThe detection engine employs a theoretical basisfor deriving thresholds for analyzing traffic signalsand anomaly detection. For 3σ-based statistical analysis, we set two kinds of thresholds, a high thresholdTH and a low threshold TL . When we respectively setthe TH and TL thresholds to 3σ of aforementionedtraffic signal distributions in ambient traffic, attackscan be detected with an error rate of 0.3% (if the signal is normally distributed) which can be expected astarget false alarm rate as (4-1) [NIS05]. For derivinginitial thresholds from background traffic, a tune-upprocedure is necessary just after powering up. Bydefault, it is set to 120 samples; that is 2 hours in caseof 1 minute samples. To analyze the statistical properties of normal traffic dynamically, we employed anexponential weighted moving average (EWMA) ofnormal traffic free of attacks. The dynamic average ofthe traffic is updated at every sampling point excluding attack periods.The detection engine can judge the current trafficstatus by calculating the standard intensity deviationof signals in each sampling instant by (4-2). The analyzed information will be compared with historicalthresholds of traffic to see whether the traffic’s characteristics are out of regular norms. Sudden changesover 3σ in the analyzed signal are expected to indicateanomalies.X N(µ, σ2 ) Pr(µ 3σ X µ 3σ) 99. 7% (4-1) normal, if TL Sσ THtraffic status (4-2) attack, if Sσ TL or TH SσAlso, with mean, standard deviation and signalvalue at every sampling point, the detection engine3
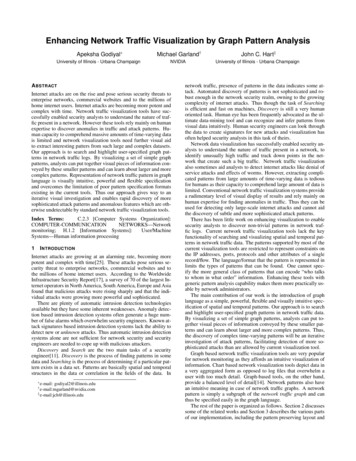
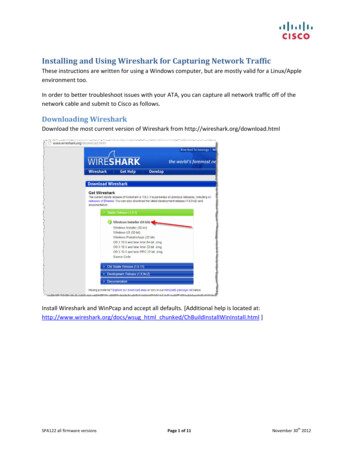
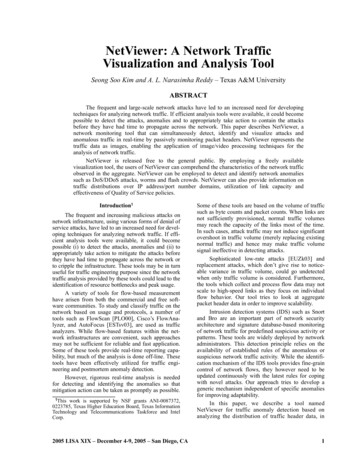
NetViewer: A Network Traffic Visualization and Analysis Toolwould compute the probability of anomaly assumingthe normal distribution [KILn02, NIS05].The Visualization EngineThe visualization engine employs graphic libraryof Matlab (in this implementation) for displaying traffic signals and images. The visualization engine produces user-friendly, images of network traffic. Asshown in Figure 2, the visual parts of NetViewer ’smain screen make up four primary components: thegeneral traffic profile, traffic distribution signals, traffic images and anomaly reports. While the profilingand reporting components are expressed in text, thetraffic signals and images are visualized in graphs.The visualization engine enables NetViewer to offerthese visual measurements as a real-time motion picture. It could help the network operators recognize thetrends and transitions in network traffic.The visualization engine plots the standard deviation of traffic intensity computed by (3) versus thesampling instant in source and destination domainsrespectively as network traffic signals. If the anomalyis detected, a red dot is marked on the bottom andcalls the network operator’s attention. NetViewer ’sKim and Reddyviewing window is controllable for short-term andlong-term analysis purposes. By default, the windowis 60 sampling points, which is the latest j1 hour withj1 minute samples.Each element of the data structure computed by(1) corresponds to a rectangular area (or pixel) in thetraffic image. The values of the elements of the datastructure are indexed into the current color-table thatdetermines the color of each pixel. The color of eachpixel shows the intensity of traffic at the source or destination or (source, destination) pair in 2-dimensions.The descending order of intensity is black, red,orange, yellow and white. Each quadrant correspondsto each byte in IP address structure. In 1-dimensionalsource or destination domain, each quadrant consistsof 16 by 16 pixels for mapping 256 elements of onebyte of IP address as shown in Figure 3(a). Each quadrant maps the 0 to 255 values of one byte of IP addressin a row-major order. Thus four quadrants consist ofthe entire 4-byte IP address. The four bytes 0 to 3 of IPaddress are also organized as quadrants in a row-majororder. In 2-dimensional image, the x-axis in each quadrant corresponds to the distribution of the destinationFigure 2: A running example of NetViewer.42005 LISA XIX – December 4-9, 2005 – San Diego, CA
Kim and ReddyNetViewer: A Network Traffic Visualization and Analysis ToolIP addresses, and y-axis that of the source addresses asshown in Figure 3(b). In each quadrant, source anddestination addresses consist of 256 by 256 pixels.The Alerting EngineOnce anomalies are detected through scenechange analysis, the alerting engine scrutinizes theabove quantities by (1) and (2) for identification purposes. From the predefined correlation and deltathresholds, the alerting engine can identify the IPaddresses of suspicious attackers and victims. Basedon the revealed IP addresses, we closely investigateeach address on the basis of statistical measurements.This inspection will lead to some form of a detectionsignal that could be used to alert the network administrator of the potential anomalies in the network traffic. The alerting engine generates the detection reportsin online image as well as in an offline file.NetViewer’s FunctionalityNetViewer and its component engines areresponsible for profiling and monitoring raw packetsor trace data exported from routers. NetViewer monitors each packet and maintains data structures basedon the observed domain (address, port numbers etc.).When anomalies are detected, NetViewer reports itsdetection results and may optionally take containmentactions. It may be configured to either archive forpostmortem analysis or discard the counter contentsafter processing.Controllable parameters, such as window size fordetermining the amount of retained data and thresholds,can be configured before or after the packet parserengine takes an action. By default, a sampling interval isset to 60 seconds for deriving most stable traffic images,and a sampling duration ratio is 1:1. That is to say, wesampled for 30 seconds and paused for 30 seconds forreducing the processing requirements. Our techniquesare light-weight enough for traffic to be continuouslysampled without any pause periods.Figure 2 is a sample NetViewer graph of realtraffic with attack at an access link.Traffic Profiling FunctionThe upper right text in Figure 2 shows the general information of current network traffic. The profileincludes the selected signal type, the local time, theselected sampling period, number of bits used to represent traffic intensity of individual pixels in the datastructure, and the bandwidth in Kbps (bits per second)and Kpps (packets per second).The next line illustrates the proportion occupiedby each traffic protocol. It is possible to determinewhether the current traffic is behaving normallythrough correlating it to that of previous states of traffic from a protocol viewpoint. This is based on theobservation that during the attacks, the protocolemployed by the attack
NetViewer: A Network Traffic Visualization and Analysis Tool Kimand Reddy postmortem and in real-time. Weadopt a network measurement-based approach that can simultaneously detect, identify and visualize attacks and anomalous traffic in real-time. Wepropose to represent s