Transcription
Enhancing Network Traffic Visualization by Graph Pattern AnalysisApeksha Godiyal Michael Garland†John C. Hart‡University of Illinois - Urbana ChampaignNVIDIAUniversity of Illinois - Urbana ChampaignA BSTRACTInternet attacks are on the rise and pose serious security threats toenterprise networks, commercial websites and to the millions ofhome internet users. Internet attacks are becoming more potent andcomplex with time. Network traffic visualization tools have successfully enabled security analysts to understand the nature of traffic present in a network. However these tools rely mainly on humanexpertise to discover anomalies in traffic and attack patterns. Human capacity to comprehend massive amounts of time-varying datais limited and network visualization tools need further visual aidto extract interesting patters from such large and complex datasets.Our approach is to search and highlight user-specified graph patterns in network traffic logs. By visualizing a set of simple graphpatterns, analysts can put together visual pieces of information conveyed by these smaller patterns and can learn about larger and morecomplex patterns. Representation of network traffic pattern in graphlanguage is visually intuitive, powerful and flexible specificationand overcomes the limitation of poor pattern specification formatsexisting in the current tools. Thus our approach gives way to aniterative visual investigation and enables rapid discovery of moresophisticated attack patterns and anomalous features which are otherwise undetectable by standard network traffic visualization tools.Index Terms:C.2.3 [Computer Systems workmonitoring; H.1.2 [Information Systems]:User/MachineSystems—Human information processing1I NTRODUCTIONInternet attacks are growing at an alarming rate, becoming morepotent and complex with time[25]. These attacks pose serious security threat to enterprise networks, commercial websites and tothe millions of home internet users. According to the WorldwideInfrastructure Security Report[17], a survey of 70 of the largest Internet operators in North America, South America, Europe and Asiafound that malicious attacks were rising sharply and that the individual attacks were growing more powerful and sophisticated.There are plenty of automatic intrusion detection technologiesavailable but they have some inherent weaknesses. Anomaly detection based intrusion detection systems often generate a huge number of false alarms which overwhelm security engineers. Known attack signatures based intrusion detection systems lack the ability todetect new or unknown attacks. Thus automatic intrusion detectionsystems alone are not sufficient for network security and securityengineers are needed to cope up with malicious attackers.Discovery and Search are the two main tasks of a securityengineer[11]. Discovery is the process of finding patterns in somedata and Searching is the process of determining if a particular pattern exists in a data set. Patterns are basically spatial and temporalstructures in the data or correlation in the fields of the data. In e-mail:godiyal2@illinois.edu† e-mail:mgarland@nvidia.com‡ e-mail:jch@illinois.edunetwork traffic, presence of patterns in the data indicates some attack. Automated discovery of patterns is not sophisticated and robust enough in the network security realm, owning to the growingcomplexity of internet attacks. Thus though the task of Searchingis efficient and fast on machines, Discovery is still a very humanoriented task. Human eye has been frequently advocated as the ultimate data-mining tool and can recognize and infer patterns fromvisual data intuitively. Human security engineers can look throughthe data to create signatures for new attacks and visualization hasoften helped security analysts in this task of theirs.Network data visualization has successfully enabled security analysts to understand the nature of traffic present in a network, toidentify unusually high traffic and track down points in the network that create such a big traffic. Network traffic visualizationalso sometimes aid analysts to detect internet attacks like denial ofservice attacks and effects of worms. However, extracting complicated patterns from large amounts of time-varying data is tediousfor humans as their capacity to comprehend large amount of data islimited. Conventional network traffic visualization systems providea rudimentary level of visual display of results and rely mainly onhuman expertise for finding anomalies in traffic. Thus they can beused for detecting only large-scale internet attacks and cannot aidthe discovery of subtle and more sophisticated attack patterns.There has been little work on enhancing visualization to enablesecurity analysts to discover non-trivial patterns in network traffic logs. Current network traffic visualization tools lack the keyfunctionality of searching and visualizing spatial and temporal patterns in network traffic data. The patterns supported by most of thecurrent visualization tools are restricted to represent constraints onthe IP addresses, ports, protocols and other attributes of a singlerecord/flow. The language/format that the pattern is represented inlimits the types of patterns that can be found. One cannot specify the more general class of patterns that can encode “who talksto whom in what order” information. Enhancing these tools withgeneric pattern analysis capability makes them more practically usable by network administrators.The main contribution of our work is the introduction of graphlanguage as a simple, powerful, flexible and visually intuitive specification of spatial and temporal patterns. Our approach is to searchand highlight user-specified graph patterns in network traffic data.By visualizing a set of simple graph patterns, analysts can put together visual pieces of information conveyed by these smaller patterns and can learn about larger and more complex patterns. Thus,the discovery of complex time-varying patterns will be an iterativeinvestigation of attack patterns, facilitating detection of more sophisticated attacks than are allowed by current visualization tool.Graph based network traffic visualization tools are very popularfor network monitoring as they affords an intuitive visualization ofinformation. Chart based network visualization tools depict data ina very aggregated form as opposed to log files that overwhelm auser with too much detail. Graph-based tools, on the other hand,provide a balanced level of detail[14]. Network patterns also havean intuitive meaning in case of network traffic graphs. A networkpattern is simply a subgraph of the network traffic graph and canthus be specified easily in the graph language.The rest of the paper is organized as follows. Section 2 discussessome of the related works and Section 3 describes the various partsof our implementation, including the pattern preserving layout and
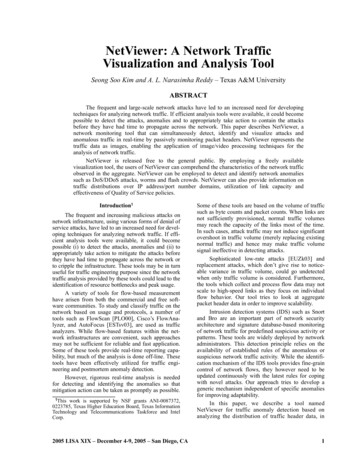
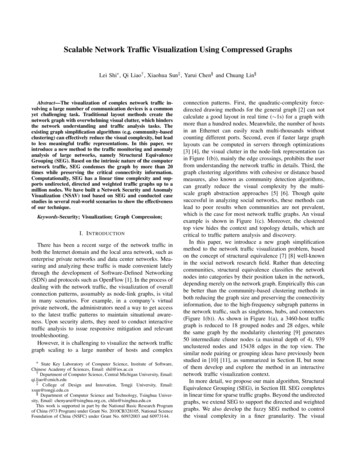
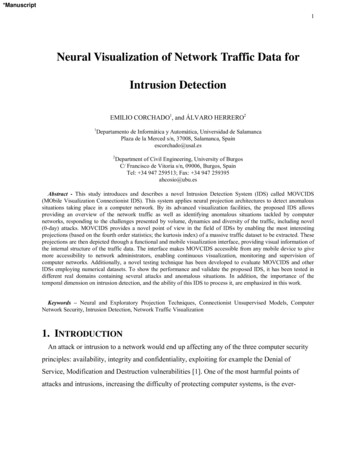
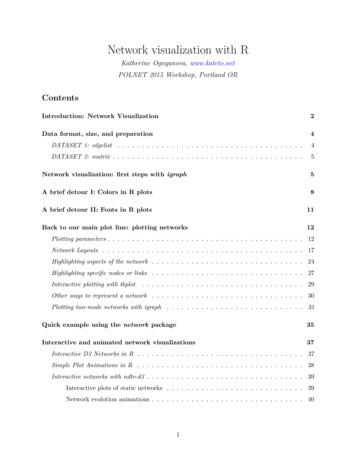
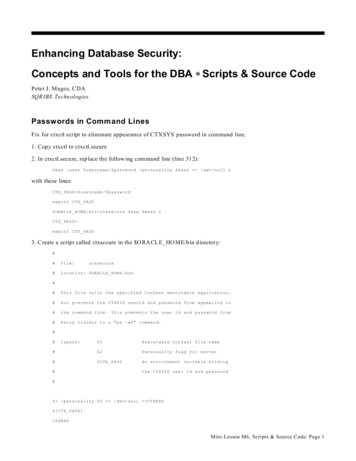
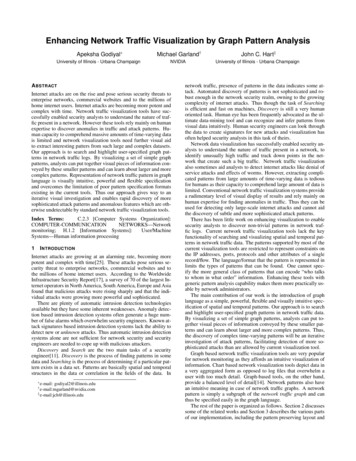
graph isomorphism algorithm. Section 4 visualizes various attacksignatures as graph patterns which can be used as templates whilesearching for the presence of those attacks. In sections 5.1 and 5.2we have used our method to understand two real world attacks andwe demonstrate how effective graph pattern visualization was inunderstanding those attacks. We conclude and talk about some ofthe future work in section 6.2R ELATED W ORKThere are several graph-based visualization tools in the networktraffic monitoring domain. There are both real time monitoringsolutions[16, 18, 21] and offline interactive tools that support different time slots comparison and analysis[14]. These approaches,however, do not support graph pattern search and visualization feature and thus are not well suited for finding sophisticated time varying patterns.NVisionIP[12] is a chart-based interactive network flow visualization tool. It does support searching of patterns in flow data [11],but the patterns are restricted to represent constraints on the IP addresses, ports and protocols of a single record/flow. Searching for apattern involves finding all records/flows in a set of netflow that satisfy the constraints of the pattern. [1] reduces the time required formultiresolution data filtering and querying of network data usingcompressed bitmap indexing. The n-dimensional data is displayedusing n-dimensional histograms. In this approach too, the queriesrepresents constraints on attributes of flows like IP address, portand protocol. In these approaches, one cannot express the moregeneral class of spatial and temporal patterns, i.e. patterns specifying “who talks to whom in what order” information. Our graphbased approach has the advantage that one can specify arbitrarynetwork traffic patterns spanning any number of nodes over timeby constructing a subgraph representing it.[29] proposes visual analysis with a declarative knowledge representation based on first-order logic. Though the declarative language used makes pattern specification more flexible as comparedto that in [11, 1] and does capture some temporal relations, but sinceit involves fixed number of predicates over flow variables (individual flow records), it is not as powerful or intuitive as our subgraphpattern specification. The use of first-order declarative languagealso makes the pattern specification cumbersome and lengthy foranalysts. For even simple patterns, the specification tends to involve many clauses and is thus quite complicated.Visual data mining (VDM)[23] focuses on using visualization todescribe the data and patterns created by data mining algorithms.The visualization allows the user to discover more patterns in thedata, evaluate the current patterns and then re-run the data miningalgorithms with different inputs. The goals of VDM are similar toours, but while they focus on modifying the working of a data mining algorithm, we focus on highlighting the user-defined patterns tofacilitate the discovery of more complex pattern.3I MPLEMENTATIONOur visualization system accepts both flow level logs (Argus [28])and packet level logs (pcap files) as input and generates a networktraffic graph. A network traffic graph is defined as a directed graphin which the nodes represent network devices and directed edgesrepresent communication between these devices. A node is eitherthe source or the target of a record/flow and has attributes like it’sIP address and position. There is one edge for each record of theinput log and has attributes like the source port, destination port,protocol used, size/number of packets, starting and ending time ofthe record.Our tool produces network traffic graphs in the DOT format[6]which is a plain text graph description language. DOT is partof the Graphviz[3] package and is a simple way of describinggraphs. We calculate the force directed layout[4] of a graph using GraphViz library[3] and then visualize the layout using Scalable Vector Graphics (SVG)[27] drawings. Figure 1 shows a smallArgus log file, the corresponding .dot file produced and the SVGdrawing of its force directed layout. Our visualization can produceboth static and dynamic layouts. The former is useful for understanding the whole picture of the network and not focus on everysingle data transfer (flow) individually. In dynamic layout, the flowedges are animated over time and this layout is desirable for a morein depth inspection of a log file as it might give a better insight intothe network events.A user can input any interesting pattern to be searched for inthe network traffic graph. If the user-specified pattern exits in thenetwork traffic graph, all instances of the pattern occurrences arehighlighted in the visualization. To highlight a pattern in a network traffic graph, we draw the edges belonging to the pattern withbolder strokes. A pattern is simply a subgraph of the network trafficgraph and the pattern searching problem boils down to the problemof subgraph isomorphism[7]. Section 3.2 defines the subgraph isomorphism problem and describes the algorithm we have used tosolve it.3.1Pattern SpecificationThe pattern to be searched for in the network traffic graph can bespecified as a subgraph in the DOT format[6]. For example, tosearch for a denial of service attack pattern, one can specify a graphwhere there are a number of nodes attacking (sending packets to) asingle victim node around the same time. Figure 2(a) shows sucha DOT graph. Note how one can specify various attributes in thisspecification. If node or edge attribute matching is activated, thespecified attributes are matched while finding patterns in the inputgraph. Enabling attribute matching provides a lot of flexibility incomposing patterns. Attributes can be composed of the followingtypes: string, position coordinates (pair of comma separated realnumbers, eg. ”10.25, 5.33”), number and number range (eg. 1100).Node Attributes: One can specify the IP address and the position of a node in a pattern. For example, in Figure 2(a), the IPaddresses are victim, attacker0, attacker1 etc and their corresponding positions are also given. IP addresses can be specified in theformat: “part1.part2.part3.part4” and each of the four parts of theIPv4 address can be specified as either a number, a number range or*. For example, “128.174.240.0 100” will match with all recordswith host numbers from 0 to 100 on the network 128.174.240.0/24.“128.174. .98” will match with all records that have an IP addressin the domain 128.174 with a host number of 98. The IP addressattribute can be an or( ) list, like:“128.174.240.0-100 128.174.*.98 ”.Edge Attributes: Edge attributes include source port, destinationport, packet size, protocol used, time of occurrence of the flow(starting time) and any other related info. For example in Figure2(a), the protocol used by the attacker is the ICMP ‘ping’ and itis an ICMP ECHO REQUEST. Source and destination port canbe an ‘or’ list of strings, numbers or number range. Example:sourcePort “netbios-ssn 100-15”. Packet size can be an ‘or’ listof numbers or number range. Protocol and info attributes can bean ‘or’ list of strings. The time attribute can be a number and is animportant attribute that orders the packets over time. By specifyinga timestamp for each packet/flow one can specify time-varyingpatterns in which flow occurs in some particular order over time.For example a simple TCP three way handshake can be representedby the following pattern:digraph TCP3WayHandshakePattern {client server [time 0, protocol “TCP”, info “[SYN]”;server client [time 1, protocol “TCP”, info “[SYN, ACK]”];client server [time 2, protocol “TCP”, info “[ACK]”]; }
(a)(b)(c)Figure 1: (a) A sample argus netflow format data, (b) Its generated DOT graph, (c) SVG drawing of its force directed layoutThis pattern enforces the order of the [SYN] packet being exchanged first, then the [SYN,ACK] packet and then the [ACK]packet. Note that timestamps enforce an order, rather than a stricttiming of the packets/flows. This means that even if in the input logfile there are other packets being exchanged in between the packets of a handshake, the pattern will still be said to be present inthe log. Similarly, the pattern shown in Figure 2(a), does not meanthat attacker0 to attacker4 sends their packets at the same instant oftime. It means that attacker0 to attacker4 attacks the victim beforeattacker5 to attacker9. Dynamic drawings of input traces with pattern matches are animated in the pattern order instead of the actualtimings of the packets. Thus in the dynamic drawing of a networktraffic log containing the pattern in Figure 2(a), all the flows fromthe first five attackers will be drawn at the same time, even if inthe input log they occur at different times. Any other flow occurring during the timeframe of these five attack flows will also bedrawn at the same time. The flows from the next five attackers willbe drawn in the next instant of time, along with other flows whichoccur during the timeframe of these five flows. Flows that do notmatch the pattern and occur before the first flow(with time 0) orafter the last flow of the pattern are drawn according to the actualtimings.Thus we can see that subgraph pattern is a simple and intuitiveyet powerful representation of events in a network.and a subgraph of G1 . It is well known that subgraph isomorphismis a NP-complete problem [7] and so the worst-case time requirements of matching algorithms increase exponentially with the sizeof the input graphs. However, there are some deterministic matching methods available for verifying graph-subgraph isomorphismwhich are based on intelligent guessing and backtracking. In thispaper, we have used Cordella et al’s algorithm for matching largegraphs[2], which gives a good performance in practice.In Cordella’s algorithm[2], the process of finding the mappingfunction is described by a state representation. Each state s ofthe matching process can be associated to a partial mapping solution M(s), which contains only a subset of M. A transition froma generic state s to a successor s0 involves adding a pair (n, m) ofmatched nodes to s. Among all the possible states, only a smallsubset is consistent with morphism. The algorithm specifies a setof rules that is able to verify the consistency conditions and makesit possible to generate only consistent states. Moreover, the number of states generated is reduced by adding a set of ‘k-look-aheadrules’ for checking in advance if a consistent state s has no consistent successors after k steps. For an attributed graph of 1000 nodesand a subgraph of around 400 nodes, this algorithm takes less thantwo seconds for computing the subgraph isomorphism. This speedworks for offline analysis of network logs, but is slow for real timemonitoring purposes.3.33.2Pattern MatchingGiven two graphs G1 (N1 , E1 ) and G2 (N2 , E2 ), a mappingM N1 N2 is said to be an isomorphism if it is a bijective functionthat preservers the edge structure of the two graphs, that is, M mapseach edge of G1 onto a edge of G2 and vice versa. M is said to be agraph-subgraph isomorphism iff M is an isomorphism between G2Pattern Preserving LayoutHighlighting the desired pattern alone is not sufficient for easy comprehension of the pattern. A single pattern might appear in a number of regions across the network traffic graph and each occurrenceof the pattern might have a different layout, not necessarily the onemost intuitive to the user. Thus we need a pattern preserving layout algorithm that starts with an initial layout of the pattern and
(a)(b)Figure 2: (a)DDos pattern graph in DOT langauge (b)Presence of the DDos Pattern in a network traffic logpreserves that layout in all occurrences of the pattern across theinput graph. Since all the pattern matches have a uniform layout,the pattern matches are easily recognizable and this enables betterunderstanding of the events occurring around the pattern.Preserving the initial layout of a pattern means that the relativeposition of the nodes in the pattern does not change. The initiallayout can be specified by the user (like shown in Figure2(a)) or ifthe user does not specify the starting positions, the tool computesforce directed layout[4] of the pattern as the initial layout.We use a pattern preserving graph layout algorithm[10] whichproduces an overall force directed layout of the network trafficgraph. This algorithm works for disjoint pattern matches only.We enhanced the fdp layout implementation[4] of GraphViz withthis pattern-preserving layout. fdp is an implementation of theFruchterman-Reingold algorithm[5] for symmetric layouts. Fdpuses spring force between nodes connected with an edge, an electrical repulsive force between all pairs of nodes and achieves a layoutby minimizing these forces.The pattern-preserving algorithm[10] works as follows: Initially,the vertices not belonging to a pattern match are placed randomly.Then all vertices of the matches are pl
Network data visualization has successfully enabled security an- alysts to understand the nature of traffic present in a network, to identif