Transcription
*Manuscript1Neural Visualization of Network Traffic Data forIntrusion DetectionEMILIO CORCHADO1, and ÁLVARO HERRERO21Departamento de Informática y Automática, Universidad de SalamancaPlaza de la Merced s/n, 37008, Salamanca, Spainescorchado@usal.es2Department of Civil Engineering, University of BurgosC/ Francisco de Vitoria s/n, 09006, Burgos, SpainTel: 34 947 259513; Fax: 34 947 259395ahcosio@ubu.esAbstract - This study introduces and describes a novel Intrusion Detection System (IDS) called MOVCIDS(MObile Visualization Connectionist IDS). This system applies neural projection architectures to detect anomaloussituations taking place in a computer network. By its advanced visualization facilities, the proposed IDS allowsproviding an overview of the network traffic as well as identifying anomalous situations tackled by computernetworks, responding to the challenges presented by volume, dynamics and diversity of the traffic, including novel(0-day) attacks. MOVCIDS provides a novel point of view in the field of IDSs by enabling the most interestingprojections (based on the fourth order statistics; the kurtosis index) of a massive traffic dataset to be extracted. Theseprojections are then depicted through a functional and mobile visualization interface, providing visual information ofthe internal structure of the traffic data. The interface makes MOVCIDS accessible from any mobile device to givemore accessibility to network administrators, enabling continuous visualization, monitoring and supervision ofcomputer networks. Additionally, a novel testing technique has been developed to evaluate MOVCIDS and otherIDSs employing numerical datasets. To show the performance and validate the proposed IDS, it has been tested indifferent real domains containing several attacks and anomalous situations. In addition, the importance of thetemporal dimension on intrusion detection, and the ability of this IDS to process it, are emphasized in this work.Keywords – Neural and Exploratory Projection Techniques, Connectionist Unsupervised Models, ComputerNetwork Security, Intrusion Detection, Network Traffic Visualization1. INTRODUCTIONAn attack or intrusion to a network would end up affecting any of the three computer securityprinciples: availability, integrity and confidentiality, exploiting for example the Denial ofService, Modification and Destruction vulnerabilities [1]. One of the most harmful points ofattacks and intrusions, increasing the difficulty of protecting computer systems, is the ever-
2changing nature of attack technologies and strategies.For this reason among others, Intrusion Detection Systems (IDSs) have become a requiredasset in addition to the computer security infrastructure of most organizations. In the context ofcomputer networks, an IDS can roughly be defined as a tool designed to detect suspiciouspatterns that may be related to a network or system attack. Intrusion Detection (ID) is then a fieldfocused on the identification of attempted or ongoing attacks in a computer system (Host IDS HIDS) or network (Network IDS - NIDS). The accurate detection of computer and networksystem intrusions in real-time has always been an interesting and intriguing problem for systemadministrators and information security researchers. It could mainly be attributed to the dynamicnature of systems and networks, the creativity of attackers, the wide range of computer hardwareand operating systems and so on. Such complexity rises when dealing with distributed networkbased systems and insecure networks such as the Internet.This study introduces an NIDS characterized by the use of an unsupervised connectionistprojection technique providing a novel approach based on the visual analysis of the internalstructure of the flow of traffic data. Unsupervised learning meets the ID requirements as in a reallife situation there is no target reference with which to compare the response of the network.Additionally, this soft-computing approach is quite useful for identifying unknown or notpreviously faced attacks, known as 0-day attacks, based on the well-know generalizationcapability of the Artificial Neural Networks (ANNs).It is important to note that the authors propose MOVCIDS (MObile VisualizationConnectionist Intrusion Detection System) also as a complementary tool to other networksecurity ones, this is, MOVCIDS can work in unison with other defence mechanisms (even ifthey are IDSs), to provide an intuitive depiction of both normal and anomalous traffic.The remaining five sections of this study are structured as follows: section 2 contains a briefstate of the art of IDSs (mainly visualization-based). Section 3 describes the neural projectionstechniques applied in this work, while section 4 provides an overview of the proposed IDS, inwhich each step forming this system is described in detail. Some experimental results arepresented and described in section 5; the proposed IDS is tested in some different ways in section6; authors discuss the considered main advantages of MOVCIDS in section 7 and finally, section8 puts forward a number of conclusions and pointers for future work.
32. PREVIOUS WORKID has been approached from several different points of view up to now; many differentintelligent and Soft Computing techniques (such as Genetic Programming [2, 3], Data Mining [410], Expert Systems [11, 12], Fuzzy Logic [13, 14], or Neural Networks [15-20] among others)together with statistical [21] and signature verification [22] techniques have been applied mainlyto perform a 2-class classification (normal/anomalous or intrusive/non-intrusive). Most of thesesystems can generate different alarms when an anomalous situation is detected, but they can notprovide a general overview of what is happening inside a computer network.From an opposite point of view, a great variety of visualization-based approaches to ID havebeen proposed as well [23-34]. In this case, the ID task is enabled by providing a visual depictionof the network or the traffic. Thus, the identification of attacks must be performed through visualfeatures because no alarms are triggered. Visualization tools rely on the human ability torecognize different features and detect anomalies through graphical devices [35]. One of the mainadvantages is that apart from enabling the anomalies detection, this approach could provide ageneral snapshot of network traffic. As this study focuses on visualization of network traffic datarather than network structure or topology, previous work only on network data visualization isconsidered.Network data are summarized in previous work by: IP addresses: that is the case of the Galaxy View of NVisionIP [36]. In [37], BorderGateway Protocol data are visualized by a diagram based on IP addresses. A matrixbased on IP addresses is proposed as well in [30] to detect the propagation of theWelchia and Sasser. D worms. The Time-based Network Traffic Visualizer [31]combines a matrix display of host IP address and packets timestamp. IP segments areused in NIVA [38] to locate and colour the data. Port numbers: in [24] the main visualization proposed is based on port and timeinformation. Stacked histograms of aggregate port activity are proposed in [25]. In thecase of NVisionIP [36], the previously mentioned Galaxy View is completed by theSmall Multiple View, that uses port numbers to visualize the data. By using portnumbers and IP addresses, the system proposed in [25] is able to see the penetrationand subsequent activity of the Sasser worm.
4 Different measurements of network traffic: the Multi Router Traffic Grapher [26]shows the incoming/outgoing traffic in Bits per Second while IDGraphs [33] uses thenumber of unsuccessful connections [39]. Alarm data: generated by different IDSs, such as Snort [40] or StealthWatch IDS [41]. Others: additional kinds of data can be also processed by different visualization tools,such as VIAssist [42] or IDtk [28] that are applied to raw TCP packet data or alertsgenerated by IDS tools.In contrast to other security tools, IDSs need to be monitored [43]. So, an IDS can be useless ifnobody is looking at its outputs. In keeping with this idea, MOVCIDS goes beyond the state ofthe art in relation to previously mentioned visualization tools, combining features extracted frompacket headers to depict each simple packet by using neural unsupervised methods based onExploratory Projection Pursuit (EPP) [44] [45] . It provides the network administrator with asnapshot of network traffic, protocol interactions, and traffic volume generally in order toidentify anomalous situations. To do so, an unsupervised neural model (see section 3) is applied.Most of the solutions described in this section use a glyph metaphor [28, 38, 46] to encodeinformation by changing different features (colour, size, opacity, etc.) in addition to the spatialcoordinates, while others use traditional representation techniques such as histograms [25, 47,48], histographs [39] or other graphs [29, 32]. The novel IDS proposed in this work employs theglyph metaphor as well, using different colours and shapes in addition to the spatial coordinatesto offer information about the protocol each packet belongs to.The connectionist visualization approach is not a new one; [34] proposes a visualization basedon the information stored in event logs. These events are considered as multidimensional vectors,and a 2D representation of them is obtained by the Self-Organizing Map (SOM) [49], where new(or anomalous) user activities are identified by visual comparison.From a purely projection of packets standpoint, Principal Component Analysis (PCA) [50],[51], has been also proposed as a visualization tool for analyzing network data [23, 27]. ThePCA-based visualization provided in [23] does not enable to distinguish attacks from normaltraffic. Furthermore, an explanation of the projection obtained by this technique is not yielded. In[27] PCA is proposed as a complementary tool to interpret the results obtained by a statisticalanalysis because the visualization does not allow the identification of attacks on its own.
5Previous work on this projection approach also includes the application of a visualization tool forintrusion detection [52]. Although some attacks are visually identified in that work by combiningvisualization and fuzzy feature extraction, explanations about the projection technique and theidentification process are not provided.The novel IDS presented in this study also employs scatterplot matrixes to visualize packetdata and provides a proper explanation of the results obtained by projection methods such asPCA (based on the second order statistic, i.e, the variance) and also going further, applyingconnectionist models based on higher order statistics such as the kurtosis (which is a measure ofhow pointed a distribution is).3. UNSUPERVISED CONNECTIONIST PROJECTIONARCHITECTURESThe identification of patterns that exist across dimensional boundaries in high dimensionaldatasets is a fascinating task [44]. Such patterns may become visible if changes are made to thespatial coordinates. However, an a priori decision as to which parameters will reveal mostpatterns requires prior knowledge of unknown patterns.Projection methods project high-dimensional data points onto a lower dimensional space inorder to identify "interesting" directions in terms of any specific index or projection. Suchindexes or projections are, for example, based on the identification of directions that account forthe largest variance of a dataset –as is the case of PCA [50, 51] - or the identification of higherorder statistics such as the skew or kurtosis index -as is the case of Exploratory Projection Pursuit(EPP) [44]. Having identified the most interesting projections, the data are then projected onto alower dimensional subspace plotted in 2D or 3D, which makes it possible to examine itsstructure with the naked eye. The remaining dimensions are discarded as they mainly relate to avery small percentage of the information or the dataset structure. In that way, the structureidentified through a multivariable dataset may be visually analyzed with greater ease. In thiswork, we take advantage of this dimensionality reduction ability to perform a 2D visualization ofthe analyzed data (from a 5-dimensional space) through an unsupervised projection model.Scatterplot matrixes [53] based on projection techniques constitute a useful visualization toolto investigate the intrinsic structure of multidimensional data, enabling experts to see therelations between different components, factors or projections.
63.1. A Variance-based VisualizationPCA is a standard statistical technique for compressing data; it can be shown to give the bestlinear compression of the data in terms of least mean square error. There are several ANNs orconnectionist models which have been shown to perform PCA e.g. [54-56]. This techniquedescribes the variation in a set of multivariate data in terms of a set of uncorrelated variables, indecreasing order of importance, each of which is a linear combination of the original variables. Itshould be noted that even if we are able to characterize the data with a few variables, it does notfollow that an interpretation will ensue.3.2. Unsupervised Connectionist Visualization for MOVCIDSExploratory Projection Pursuit (EPP) [44] is a more recent statistical method aimed at solvingthe difficult problem of identifying structure in high dimensional data. It does this by projectingthe data onto a low dimensional subspace in which we search for data's structure by eye.However, not all projections will reveal this structure equally well. It therefore defines an indexthat measures how "interesting" a given projection is, and then represents the data in terms ofprojections maximizing that index.The first step for EPP is to define which indexes represent interesting directions."Interestingness" is usually defined with respect to the fact that most projections of highdimensional data give almost Gaussian distributions [45]. Thus, in order to identify "interesting"features in data, it is appropriate to look for those directions onto which the data-projections areas far from the Gaussian as possible.Two simple measures of deviation from a Gaussian distribution are based on the higher ordermoments of the distribution. Skewness is based on the normalized third moment and measuresthe deviation of the distribution from bilateral symmetry. Kurtosis is based on the normalizedfourth moment and measures the heaviness of the tails of a distribution. A bimodal distributionwill often have a negative kurtosis and therefore negative kurtosis would signal that a particulardistribution shows evidence of clustering.Because a Gaussian distribution with mean a and variance x is equally interesting than aGaussian distribution with mean b and variance y - indeed this second order structure can obscurehigher order and more interesting structure - then such information is removed from the data
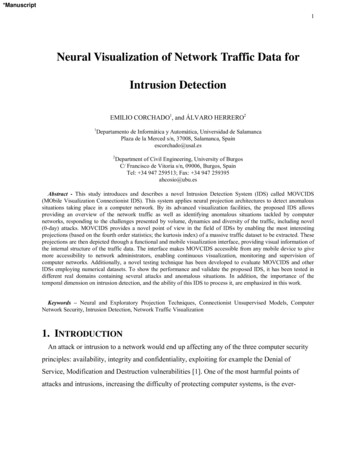
7("sphering").Cooperative Maximum Likelihood Hebbian Learning (CMLHL) [57, 58] is based onMaximum Likelihood Hebbian Learning (MLHL) [57, 59], an EPP connectionist model.CMLHL includes lateral connections [58, 60] derived from the Rectified Gaussian Distribution(RGD) [61]. The RGD is a modification of the standard Gaussian distribution in which thevariables are constrained to be non-negative, enabling the use of non-convex energy functions.The CMLHL architecture is depicted in Fig. 1, where lateral connections are highlighted.Fig.1 File Fig.-01.pdf goes here Lateral connections used by CMLHL are based on the mode of the cooperative distribution thatis closely spaced along a non-linear continuous manifold. Due to this, the resultant net can findthe independent factors of a dataset in a way that captures some type of global ordering.Considering an N-dimensional input vector (x), an M-dimensional output vector (y) and withWij being the weight (linking input j to output i ), CMLHL can be expressed as:Feed-forward step:Nyi Wij x j , i .(1)j 1Lateral activation passing: yi t 1 yi(t) τ b Ay .(2)Feedback step:Me j x j Wij yi , j .(3)i 1Weight change: Wij . yi .sign e j e j p .(4)Where: is the learning rate, is the "strength" of the lateral connections, b the biasparameter and p is a parameter related to the energy function [57-59].
8A is a symmetric matrix used to modify the response to the data whose effect is based on therelation between the distances among the output neurons. It is based on the CooperativeDistribution, but to speed learning up, it can be simplified to:A(i, j ) ij cos 2 i j / M .(5)Where ij is the Kronecker delta.CMLHL has already proved to successfully perform data visualization. It was initially appliedto the artificial vision field [58, 60] and then to some other problems [62-64].3.3. Self-Organizing MapThe Self-Organizing Map (SOM) [49] was developed as a visualization tool for representinghigh dimensional data on a low dimensional display. Although it is also based on the use ofunsupervised learning, it is not a projection architecture but a topology preserving mappingmodel using competitive learning instead. A SOM, composed of a discrete array of L nodesarranged on an N-dimensional lattice, maps these nodes into a D-dimensional data space whilepreserving their ordering. The dimensionality of the lattice (N) is normally smaller than that ofthe data, in order to perform the dimensionality reduction. An example of a trained twodimensional lattice is shown in Fig. 2.a. Typically, the array of nodes is one or two-dimensional,with all nodes connected to the N inputs by an N-dimensional weight vector as can be seen inFig. 2.b. File Fig.-02a.pdf goes here File Fig.-02b.pdf goes here Fig. 2.The SOM can be viewed as a non-linear extension of PCA, where the map manifold is aglobally non-linear representation of the training data [65]. The self-organization process iscommonly implemented as an iterative on-line algorithm, although a batch version also exists.An input vector is presented to the network and a winning node, whose weight vector is theclosest (in terms of Euclidean distance) to the input, is chosen.So the SOM is a vector quantizer (VQ), and data vectors are quantized to the reference vectorin the map that is closest to the input vector. The weights of the winning node and the nodes
9close to it are then updated to move closer to the input vector. When this algorithm is iteratedsufficiently, the map self-organizes to produce a topology-preserving mapping of the lattice ofweight vectors to the input space based on the statistics of the training data. This connectionistmodel is applied here for comparative purposes as it is one of the most widely used unsupervisedneural models for visualizing structure in high-dimensional datasets and also applied in the fieldof IDSs [18].3.4. Curvilinear Component AnalysisCurvilinear Component Analysis (CCA) [66] is a nonlinear dimensionality reduction method.It was developed as an improvement on the SOM. It tries to circumvent the limitations inherentin some previous linear models such as PCA.The principle of CCA is a self-organized neural network performing two tasks: a vectorquantization of the submanifold in the dataset (input space) and a nonlinear projection of thesequantizing vectors toward an output space, providing a revealing view of the way in which thesubmanifold unfolds. It is shown in Fig. 3.Fig.3 File Fig.-03.pdf goes here As regards its goal, the projection part of CCA is similar to other nonlinear mapping methods;in that it minimizes a cost function based on interpoint distances in both input and output spaces.Quantization and nonlinear mapping are separately performed by two layers of connections:firstly, the input vectors are forced to become prototypes of the distribution using a VQ. Then,the outp
1 Neural Visualization of Network Traffic Data for Intrusion Detection . EMILIO CORCHADO. 1, and ÁLVARO HERRERO. 2. 1. Departame