Transcription
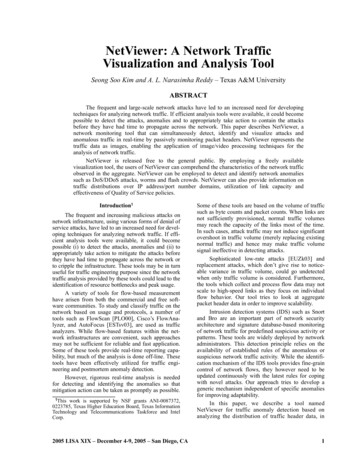
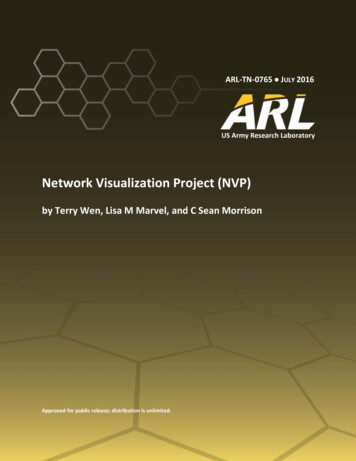
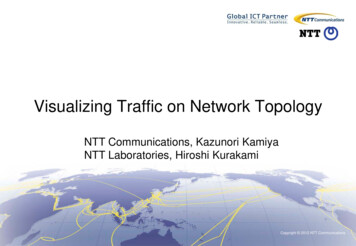
ISCA 22nd International Conference on Computer Application and Industry and Engineering(CAINE-2009), San Francisco, CA, 2009.Visualization of Network Security Traffic using Hexagonal Self-Organizing MapsChet Langin, Dunren Che, Michael Wainer, and Shahram RahimiComputer Science DepartmentSouthern Illinois University CarbondaleCarbondale, IL 62901 USA{clangin, dche, wainer, rahimi}@cs.siu.eduAbstractA hexagonal Self-Organising Map (SOM) based on theVulture Fest Model of intrusion detection illustrates thenetwork landscape of wireless traffic comparing it withmalicious traffic and contrasting it to traditional landlinenetwork traffic. This map can also provide visual securityprofiles of work groups and LAN administrators.1 IntroductionMalicious software began to become dangerous tocomputing environments soon after the first computervirus was created on November 3, 1983[3]. The influenceof high connectivity on network security became apparentin 2007 when an army of infected computers was used inco-ordinated Denial of Service (DoS) attacks in cyberwarfare to disable the network of Estonia, a smallcountry[4, 16]. These armies are called botnets with eachinfected computer called a bot (short for robot.) Bots taketheir orders from bot masters via command and controlcenters (C&C) using various protocols, such as HTML,Internet Relay Chat (IRC), and Peer-to-Peer (P2P).Estimates of the numbers and sizes of botnets vary, butone study, for example[21], discovered 3,290 unique IRCbotnets with 700,700 distinct IP addresses. P2P botnetsare more problematic because they encrypt their traffic,and their distributed system makes it difficult to trace andfind the command and control centers. Botnets areparticularly insidious because they can accomplishwhatever code their malicious master is capable andimaginative enough to deliver to them. It is clear thatbonets have become the most serious security threat onthe Internet [15].Traditional packet analysis intrusion detection isstymied by this high connectivity and encrypted P2Pbotnet command and control network traffic. Thisresearch concerns the analysis of multidimensionalnetwork data. One of the advantages of a SOM is therepresentation of multidimensional data into a smallerdimensional space, kind of like a flashlight shining on athree-dimensional object to produce a two-dimensionalshadow. A hexagonal map is used to mitigate the socalled curse of dimensionality by labelling complex dataareas with simple names of elevation such as valley,plateau, and cliffs, which helps to further visualise thedata. This will become more apparent later in the paper.The analysis model is explained in Section 2. ThenSection 3 gives the methodology on how the modelworked to advantage by discovering security issues andby visually displaying the network landscape. Section 4provides references for related work, and Section 5 is theconclusion.2 ModelThe model was developed while studying P2P bots andthen generalized. It is an evolution of the modeldescribed in [14]. This model was used to discovernetwork security problems and then to visually mapwireless, malicious, and traditional network traffic.When a computer gets newly infected with a P2P bot,it attempts to notify the bot master’s C&C of its infectionso that the C&C knows that the newly infected computeris ready for further instructions. The bot master respondswith one or more of his or her C&C servers which ispropagated through the Internet via the P2P botnet, andhides the route back to the bot master. The logs fromapparently over 40,000 unique IP addresses in a P2Pbotnet have been seen attempting to make contact back toan infected computer. The incoming botnet traffic isblocked by the firewall and the logs are sent to the logserver for analysis. This model was used to practicaladvantage when the firewall logs were analyzed todiscover two previously unknown feral bots on thenetwork.The P2P Botnet Model can be generalised for othertypes of malignant network behaviour. In Fig. 1.a, amalignant IP address produces a putrid network scentwhich is picked up by other computers on the Internet. InFig. 1.b, attempted responding contacts are made to themalignant IP address, where they are denied by thefirewall and logged. This general model is called aVulture Fest due to the similarity of the outside computersattacking putrid IP addresses with vultures attackingcarrion. The Vulture Fest Model was used to produce avisual hexagonal SOM that compares wireless networktraffic with malicious traffic, and which contrasts wirelesstraffic with traditional traffic.
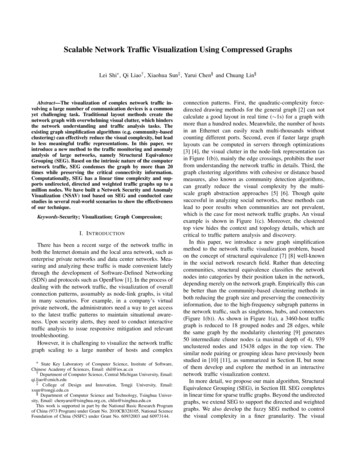
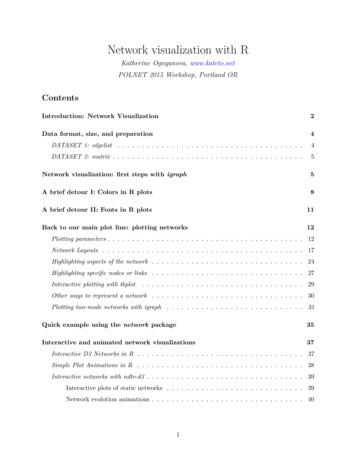
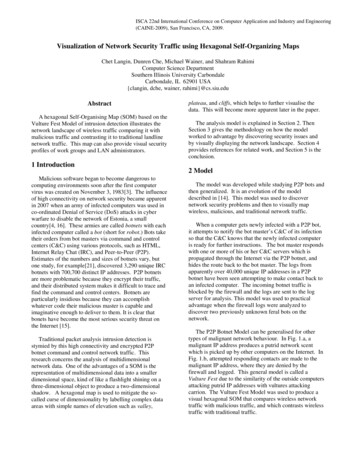
far as the authors know. See [13] for detailed instructionson the methodology of how this was accomplished.A hexagonal SOM, described by [12], was then trainedwith the same data to extend our research. However, thistime the data was normalized and the three protocol fieldswere combined into one. The new vector had the sixfields of tot norm (total normalized), src rat (sourceratio); port rat (port ratio); lo norm (lowest portnormalised); hi norm (highest port normalised); and,udp rat (udp ratio). All values were now in the range of 0to 1. IP addresses which had no firewall log entries, atall, were given vector of 0, 0, 0, 0, 0, 0. The SOM placedall of these zero entries into the same node which waslabelled the Origin because of the similarity of this nodeto an origin on a graph. The Origin area was referred toas being the Origin Basin on the visual map because itwas conceptually the lowest area in elevation, and othernodes were referred to as having higher elevationsdepending roughly upon their Euclidean distances fromthe Origin.Figure 1. The General Model.3 MethodologyBorder firewall logs entries were analyzed for a 24hour period when two P2P bots were known to be present.These logs also contained data for potentially all of theother IP addresses on the network. Over 20 millionfirewall entries were in this training data, the bulk ofwhich were logs of incoming traffic which were deniedby the border firewall.The initial values of the nodes were created at random.The SOM trained itself and in doing so moved theextreme values of the features towards the edges of themap. The completed SOM can be visualised manydifferent ways. Grey scales can be used, for example, toshow the distances between nodes, the populationdistribution, the numbers of log entries, the ratios ofunique sources, the ratios of unique destination ports, thelowest destination ports, the highest destination ports, andthe UDP percentages. Each of these would be a separatevisual map. Colors and their intensities can also be usedand combined for full-color displays showing multiplefeatures at once. Linguistic observations can then bemade about map features such as, the UDP area has a lowratio of sources.A one-dimensional Self-Organising Map (SOM)[12]was self-trained to cluster the network traffic, using 1,000nodes, with each node representing a cluster, providing anaverage of 60 local IP addresses per cluster. The weightsof Node 996 became the Best Matching Unit (BMU) forboth bots, and no other IP addresses had Node 996 as theBMU, meaning that the SOM successfully isolated the botIP addresses from the other IP addresses.This SOM was then used for classification of newfirewall log data to look for additional bots on thenetwork. New firewall log entries were then processed ona daily basis looking for local IP addresses which hadNode 996 as the BMU. Two bots and other types ofmalicious network traffic were discovered this way, beingthe first time that feral malicious network traffic has beendiscovered by a self-trained computational intelligence asFigure 2. The U-matrix visualization.
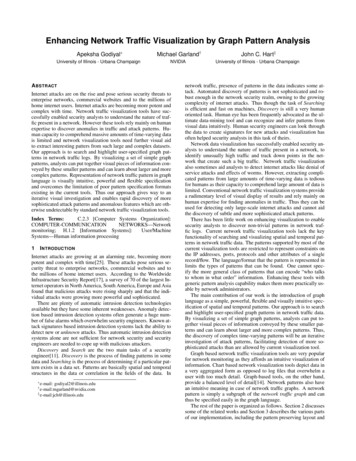
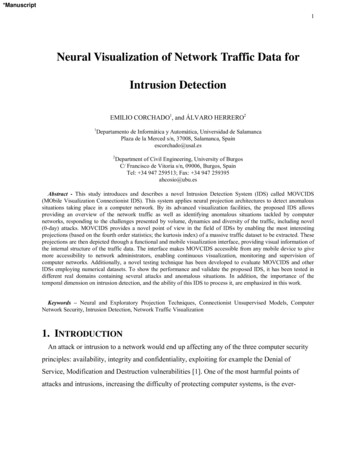
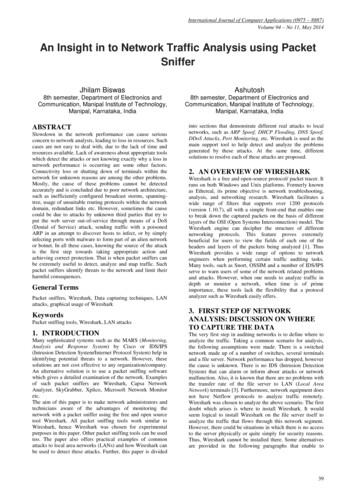
Fig. 2 displays the map as a unified distance matrix,i.e., U-matrix [18], which indicates the Euclideandistances between adjacent nodes, with close nodes beingdarker and distant nodes being lighter. This map consistsof 919 nodes, each of which is represented by a smallhexagon. The map itself is a super hexagon created fromthe 919 smaller hexagonal nodes. The node which isconceptually the most distance from the Origin is near thelabel Hi Port, so that area has the most elevation and iscalled the Hi Port Mountains. Hi Port refers to attemptedaccesses of at least one high destination port. Close to theHi Port Mountains are the Port Cliffs, labelled Ports, anarea with attempts to access large numbers of differentdestination ports. At the top left of the map are the UDPPlains, labelled UDP, which represent attempted accesseswith high UDP percentages. The top right of the map arethe Bot Hills, labelled Bots, which shows where themalicious network traffic was placed by the SOM.Between the Bot Hills and the Hi Port Mountains is aplateau. Everything else, which includes the areaslabelled Lo Port and Sources, is a valley. Lo Port refersto attempted accesses in which the lowest destination portis a higher port. Sources refers to a high percentage ofdifferent source IP addresses.Each local IP address can be assigned to a location onthe map depending upon the type of network trafficassociated with that IP address in the firewall logs. TheIP address for one of the author’s desktops is located inthe middle of the valley, for example. The map locationprovides a visual indication of the security nature of thecomputer/s associated with an IP address. Thecharacteristics of denied outside network traffic for valleycomputers for total normalized log entries are very low,the ratio of unique source addresses is high, the ratio ofunique destination ports is medium, low port accessattempts are mixed, high port access attempts are low, andthe UDP ratio is medium. The population density of thevalley is high.included in this display of traditional and well-maintainedcomputers. The map indicates that the network traffic forthese IP addresses is located predominately in the valleyand the plateau. Since the valley, which is described inthe previous paragraph, is populated characteristically bytraditional administrative IP addresses, it is called theTraditional Valley. The plateau is characterised byoutside denied network traffic in which the total logentries are very low, the source ratio is high, the port ratiois medium, the lowest port is high, the highest port ishigh, and the UDP ratio is somewhat high. The plateau ismoderately populated. Some of the traditional networktraffic is also located in the Origin, indicating that thistraffic, if any, has little or no presence in the firewall logs.Figure 3. A sketch of the major landscape features of theSOM.Fig 3. Sketches the general locations of the majorlandscape features so that they are easier to locate on theU-matrix map, while Table 1 summarizes theircharacteristics.Fig. 4 shows primary map locations of a control groupof IP addresses of traditional computers on the localnetwork which are used for administrative purposes by ITprofessionals, including servers accessible by the Internet.Each white asterisk marks a node representing a cluster ofsuch IP addresses. Visualize Fig. 4 as though you werelooking down on Earth at night and the white asterisks arelighted areas—they represent moderate and large clustersof populated areas. Individual IP addresses and smallerclusters are not shown. Over 9,000 IP addresses areFigure 4. The locations of administrative IP addresses.
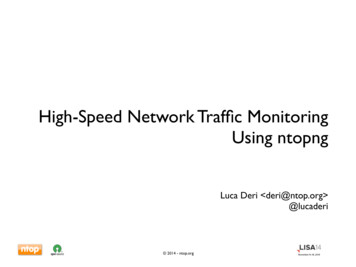
Bot Hills are number of total entries high, source ratiolow, port ratio low, low port medium, high port high, andUDP ratio high.Figure 5. The locations of the wireless IP addresses.Fig. 5 illustrates the predominant map locations ofover 2,000 IP addresses designated for access to wirelessaccess points. It is the same as Fig. 4 except that itrepresents all computers using wireless access instead ofrepresenting administrative computers connected to thenetwork with cables. Any computer could be connectedvia wireless as long as the user had an authorized networkID, including faculty, staff, students, and various types ofguests. Thus Fig. 5 represents the full range of users fromthe most conservative security conscious to the veryreckless. Although, these are wireless connections, theanalyzed network data is from the network infrastructurebetween the wireless access points and the Internet. Asbefore, the data was from denied outside sourcesattempting to connect to IP addresses on the campusnetwork, but this time the local IP addresses wereassigned to wireless devices.Network security characteristics of wirelessconnections in Fig. 5 can be compared and contrastedwith traditional and malicious traffic in Fig. 4. WirelessIP addresses are well represented in the valley and theplateau similar to the traditional administrativecomputers. However, wireless connections are alsolocated in the the Hi Port Mountains, the Port Cliffs, andthe Bot Hills.Characteristics of denied outside traffic in the Hi PortMountains are number of attempts extremely high, ratioof sources low, ratio of destination ports low, lowestdestination port medium, highest destination port veryhigh, and the UDP ratio low. Characteristics of the PortCliffs are total attempts very low, ratio of sources low,ratio of destination ports very high, low port medium,high port high, and UDP ratio low. Characteristics of theNotably absent from the wireless connections aresignificant populations in the UDP Plains and the Origin.The UDP Plains are highly populated by students in theresidences. It is conjectured that the UDP Plainsrepresent ongoing P2P connections. Since wirelessconnections have temporary IP addresses, they would nothave all of the traffic characteristics of ongoing P2Ptraffic. The Origin represents IP addresses with nofirewall log entries. Since wireless connections aretemporary, eventually every wireless IP address willinvolve a computer involved with firewall log entries.From a practical point of view, anytime someone logs onto wireless, that person may be under attack as the resultof the network activity of a previous user assigned thesame temporary IP address, i.e., wireless IP addresses ingeneral have precarious high profiles on the Internet.These observations can be made about the security ofwireless network traffic based on the information in Fig.5. Wireless network traffic as a whole can bedistinguished from traditional administrative computing.Much wireless traffic presents a putrid scent to theInternet attracting large amounts of vulture attacks. Someof this traffic is similar to, and may be, malicious traffic.4 Related Work[8] categorized three types of intrusion detection: rulebased penetration identification, anomaly detection, andmodel-based intrusion detection. Intrusion DetectionSystem (IDS) appliances are primarily rule-based: Theylook for strings, flags, ports, and other information inpackets and traffic flow data that indicate known intrusionpatterns. Two disadvantages for rule-based systems inlooking for P2P bots are that 1) you have to know inadvance what you are looking for, and 2) encryptedpackets obfuscate needed information for rule-matching.Anomaly detection uses statistical or other methods todetermine normal network traffic, and then reports what isnot normal. Disadvantages of anomaly detection of P2Pbotnets are that the initial outgoing contacts of the newlyinfected computers are indistinguishable from normaltraffic, and the incoming traffic from the botnet neverreaches the local network through a properly configuredfirewall.Many papers have been written on rule-based andanomaly intrusion detection, but only a few have beenwritten on intrusion detection models. [11] proposed anetwork intrusion detection model in 1997 which wascalled Network State Transition Analysis Tool (NSTAT)and which was based on earlier host-based models. It was
noted that an IDS does not take into consideration two ormore users working together to execute a penetration.[2] proposed a Hidden Markov Model (HMM) model in2003 to improve intrusion detection performance by onlyconsidering the privilege transition flows based on thedomain knowledge of attacks. More recently, [20] notedthe massive number of simple alerts of low-level securityrelated events for signature-based (rule-based) IDS, andproposed a formal model utilizing the concept ofcapability to implement an alert correlator for complexmultistage intrusions, expanding an earlier model. Noneof these previously published network models areappropriate for P2P botnets because there are noobservable state transitions, privilege transitions, or alertcorrelations to consider.rectangular map shape to display the hexagonal nodes,whereas the SOM in this paper was created as a superhexagon from the hexagonal nodes, providing a bettervisual layout and making it easier to linguisticallydistinguish features. The Vulture Fest Model is alsounique for producing a visual hexagonal SOM.5 ConclusionA Vulture Fest Model of intrusion detection wascombined with a hexagonal SOM to visually compare andcontrast traditional, malicious, and wireless networktraffic. This demonstrated that wireless network traffic asa whole can be distinguished from other types of traffic.The hexagonal SOM also indicated that much wirelesstraffic attracts large amounts of attention from the Internetand that some of this traffic indicates probable maliciousbehaviour involved with wireless connections. Wirelessnetworking is thus one of a precarious high profile on theInternet. Additional types of visual maps can also berelatively easily produced for any group of local IPaddresses in an organization showing more detail andattributes of the hexagonal SOM, thus providing securityprofiles for departments or LAN administrators. Furtheranalysis of the Bot Hills area of the map should be donealong with tracing the possible movement through themap as computers become infected and active as bots.Network traffic fingerprinting and other types of forensicsappear to be possible with SOM.[5] was apparently the first to propose a SOM forintrusion detection. [6] analyzed firewall logs with aSOM. [17] classified P2P traffic with a SOM. Manyother variations of using SOM for network security havealso been reported. However, the SOM in this paper wasthe first to discover new and previously unknown feralmalicious network traffic as far as is known by theauthors. This SOM is also distinguished by using theVulture Fest Model described in this paper, i.e. using dataderived from denied external network traffic. Otherauthors have done research using a visual hexagonal SOMfor network security, including [7], [1], [9], [10], and,[19]. However, these other researchers used an overallUDP owHighestPortLowUDP RatioLowMediumLowestPortSomewhatHighMediumHighBot HillsPlateauHighVery LowLowHighHighHighLowLowMediumVeryLowMediumVery LowVery ighLowHi PortMountainsOrigin BasinExtremelyHighVery LowTraditionalValleyPort CliffsVery LowLowVeryHighMediumHighReferences[1]S.-B. Cho, Incorporating SoftComputing Techniques into aProbabilistic Intrusion DetectionSystem, IEEE Trans. Systems ManCybernet, 32 (2002), pp. 154.[2]Very HighTable 1:Characteristics ofmajor landscapefeatures.Very LowMediumLowS.-B. Cho and H.-J. Park, EfficientAnomaly Detection by ModelingPrivilege Flows with Hidden MarkovModel, Computers and Security, 22(2003a), pp. 45-55.
[3][4][5][6][7][8][9][10][11][12]F. Cohen, Computer Viruses, 7thDoD/NBS Computer SecurityConference, 1984, pp. 240-263.J. Davis, Hackers Take Down the MostWired Country in Europe, Wired, 2007.K. L. Fox, R. R. Henning, J. H. Reedand R. P. Simonian, A neural networkapproach towards intrusion detection,13th National Computer SecurityConference, 1990.L. Girardin and D. Brodbeck, A VisualApproach for Monitoring Logs, 12thSystems Administration Conference(LISA '98), Boston, 1998a.A. J. Hoglund and K. Hatonen,Computer Network User BehaviorVisualization using Self-OrganizingMaps, Internationa Conference onArtificial Neural
Visualization of Network Security Traffic using Hexagonal Self-Organizing Maps Chet Langin, Dunren Che, Michael Wainer, and Shahram Rahimi Computer Science Department Southern Illinois University Carbondale Carbondale, IL 62901 USA {clangin, dche, wainer, rahimi}@cs.siu.edu Ab