Transcription
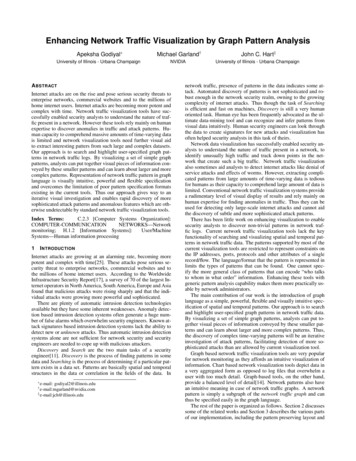
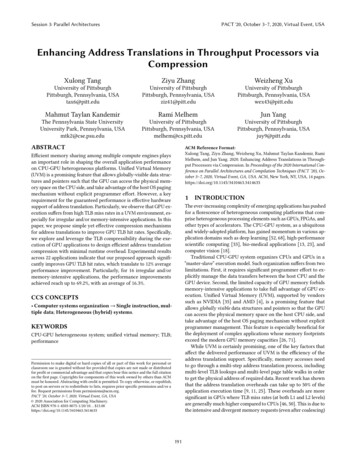
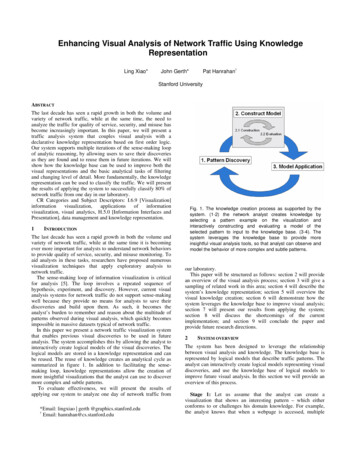
Enhancing Visual Analysis of Network Traffic Using KnowledgeRepresentationLing Xiao*Pat Hanrahan†John Gerth*Stanford UniversityABSTRACTThe last decade has seen a rapid growth in both the volume andvariety of network traffic, while at the same time, the need toanalyze the traffic for quality of service, security, and misuse hasbecome increasingly important. In this paper, we will present atraffic analysis system that couples visual analysis with adeclarative knowledge representation based on first order logic.Our system supports multiple iterations of the sense-making loopof analytic reasoning, by allowing users to save their discoveriesas they are found and to reuse them in future iterations. We willshow how the knowledge base can be used to improve both thevisual representations and the basic analytical tasks of filteringand changing level of detail. More fundamentally, the knowledgerepresentation can be used to classify the traffic. We will presentthe results of applying the system to successfully classify 80% ofnetwork traffic from one day in our laboratory.CR Categories and Subject Descriptors: I.6.9 nsofinformationvisualization, visual analytics, H.5.0 [Information Interfaces andPresentation], data management and knowledge representation.1Fig. 1. The knowledge creation process as supported by thesystem. (1-2) the network analyst creates knowledge byselecting a pattern example on the visualization andinteractively constructing and evaluating a model of theselected pattern to input to the knowledge base. (3-4). Thesystem leverages the knowledge base to provide moreinsightful visual analysis tools, so that analyst can observe andmodel the behavior of more complex and subtle patterns.INTRODUCTIONThe last decade has seen a rapid growth in both the volume andvariety of network traffic, while at the same time it is becomingever more important for analysts to understand network behaviorsto provide quality of service, security, and misuse monitoring. Toaid analysts in these tasks, researchers have proposed numerousvisualization techniques that apply exploratory analysis tonetwork traffic.The sense-making loop of information visualization is criticalfor analysis [5]. The loop involves a repeated sequence ofhypothesis, experiment, and discovery. However, current visualanalysis systems for network traffic do not support sense-makingwell because they provide no means for analysts to save theirdiscoveries and build upon them. As such, it becomes theanalyst’s burden to remember and reason about the multitude ofpatterns observed during visual analysis, which quickly becomesimpossible in massive datasets typical of network traffic.In this paper we present a network traffic visualization systemthat enables previous visual discoveries to be used in futureanalysis. The system accomplishes this by allowing the analyst tointeractively create logical models of the visual discoveries. Thelogical models are stored in a knowledge representation and canbe reused. The reuse of knowledge creates an analytical cycle assummarized in figure 1. In addition to facilitating the sensemaking loop, knowledge representations allow the creation ofmore insightful visualizations that the analyst can use to discovermore complex and subtle patterns.To evaluate effectiveness, we will present the results ofapplying our system to analyze one day of network traffic from*Email: lingxiao gerth @graphics.stanford.edu†Email: hanrahan@cs.stanford.eduour laboratory.This paper will be structured as follows: section 2 will providean overview of the visual analysis process; section 3 will give asampling of related work in this area; section 4 will describe thesystem’s knowledge representation; section 5 will overview thevisual knowledge creation; section 6 will demonstrate how thesystem leverages the knowledge base to improve visual analysis;section 7 will present our results from applying the system;section 8 will discuss the shortcomings of the currentimplementation; and section 9 will conclude the paper andprovide future research directions.2SYSTEM OVERVIEWThe system has been designed to leverage the relationshipbetween visual analysis and knowledge. The knowledge base isrepresented by logical models that describe traffic patterns. Theanalyst can interactively create logical models representing visualdiscoveries, and use the knowledge base of logical models toimprove future visual analysis. In this section we will provide anoverview of this process.Stage 1: Let us assume that the analyst can create avisualization that shows an interesting pattern – which eitherconforms to or challenges his domain knowledge. For example,the analyst knows that when a webpage is accessed, multiple
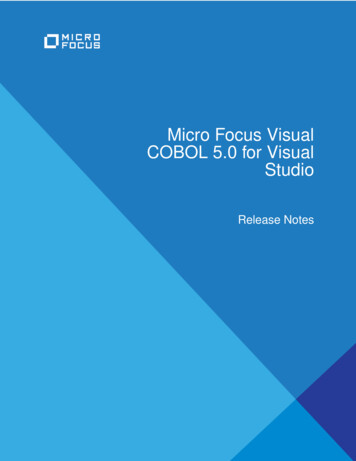
separate HTTP requests are generated. This is reasonable since aweb page contains a collection of URLs representing informationthat needs to be retrieved. Therefore, a temporal visualizationshowing the traffic of a webpage access should show a sequenceof HTTP requests, each of which is a connection to one of theHTTP ports.Stage 2: The analyst will then attempt to create a logical modelthat describes the traffic underlying the pattern. To create thelogical model of the observed pattern, the analyst selects the datapoints comprising an instance of the pattern. The system thenidentifies a collection of predicates from the knowledge base thatcan be used to describe the selected data. For example, for awebpage access, the analyst selects a single sequence of HTTPrequests, causing the following predicates to be identified: “fromsame machine”, “to same machine”, “high temporal locality”,“high source port locality”, “destination port HTTP”.The analyst then interactively creates a logical clause fromthese predicates. This clause is iteratively constructed (stage 2.1)and evaluated (stage 2.2). For example, the analyst may firstselect the predicate “to same machine”, but find that it is toogeneral, and therefore add other predicates such as “high temporallocality”, etc. to the conjunction, until he creates a clause thatmodels the web page access pattern correctly, which may be:“from same machine” and “to same machine” and “high temporallocality” and “destination port HTTP”.Stage 3: Once the analyst has created a logical clausedescribing the pattern, the system incorporates the model into theknowledge base. The model can then be applied to all the data inthe system to label the traffic of that type. For example, thesystem will label all the flows that are accepted by a web pageaccess model with the “web” label.The analyst can now leverage the augmented data to createmore insightful visualizations, and perform further visual analysis.For example, the analyst can now visualize only web traffic (allthe traffic that satisfies the web page load model), or he can filterout the web traffic and concentrate his efforts on the remainingtraffic.Using the enhanced visualizations may then lead to otherpatterns being discovered (stage 1), modeled (stage 2) andincorporated (stage 3). Thus, the analyst uses the system toiteratively build upon his prior visual discoveries.3RELATED WORKVisualizations of internet network traffic patterns have existed forover a decade [4, 14]. Early visualizations were aimed atunderstanding overall network loads and topology. These haveevolved into tools for monitoring quality of service at the scale ofthe major network trunks [11]. More recently a host ofvisualizations have been developed in both the research [7, 3, 9]and commercial worlds [1, 15] to help analysts understand trafficat smaller scales ranging from the corporate intranet down toindividual machines not only for quality of service but also fornetwork security. Because the volume of network traffic data is solarge, most visualization systems provide aggregation and/orfiltering mechanisms to reduce clutter and help the analyst focuson the traffic of interest. This is typically achieved by employingstandard interactive dialog boxes, range sliders, dynamic queries,brushing, etc.Our work is most closely related to that found in NVision IP[18] which has recently added monitoring of user actions [12]. InNVision IP, the analyst’s selection actions are recorded as apattern tree using a rule set based on the well-known BerkeleyPacket Filter language [13]. These patterns may be saved in a fileand subsequently applied to other network datasets, therebypermitting the analyst to capture the value of a particular set offiltering operations as reusable knowledge. We expand the notionof reuse by using first-order logic to capture the analyst’s domainexpertise in a knowledge base which goes beyond flow attributes,and is extended as he leverages the knowledge base to performmore effective visual analysis.4KNOWLEDGE REPRESENTATIONIn this section we will describe the type of network traffic that thesystem can analyze and the knowledge representation that iscurrently used.4.1DataCurrently the system is designed for the analysis of the networkflow data captured from the layer 2 switches by a collectorrunning the open source Argus [2] sensor. Flow data is commonlyused in network analysis because it does not contain packetpayloads, and is thus more scalable, and avoids the social andlegal issues associated with packet content recording.An Argus flow record contains the following fields:DimensionsGMT Start timeIP protocolSource IP addressSource portDestination IP addressDestination portMeasuresDurationSource packetsSource bytesSource application bytesDestination packetsDestination bytesDestination application bytesThese are augmented by the Source and Destination ASN(autonomous system number – roughly corresponding to the ISP),flags indicating the flow state at time of capture and fields for thelocal hour and day of week.4.2Declarative LanguageThe declarative language used to model patterns is first-orderlogic, which is a well studied knowledge representation that iscapable of modeling human and machine reasoning [10, 3, 6]. Asan example of using first-order logic to describe network traffic,let us reconsider the web page load example from section 2. Theclause that describes which HTTP connections form a web pageload event is as follows:identical source IP(x,y) ANDidentical destination IP(x,y) ANDtime within 2 seconds(x,y) AND( destination port 80(x) ANDdestination port 80(y))The variables x and y represent individual flow records. Thislogical clause represents the knowledge that a web page loadconsists of two flow records to port 80 (associated with HTTPtraffic) within 2 seconds between the same pair of machines.Since parameters are not part of the universe of discourse, it isnecessary to create multiple predicate for different parametervalues. While tedious, we have found that most parametersrequire only a few values.Many types of traffic consist of multiple flows. To modelknowledge about traffic patterns composed of arbitrarily manyflows, we introduce the construct of a variable predicate which is
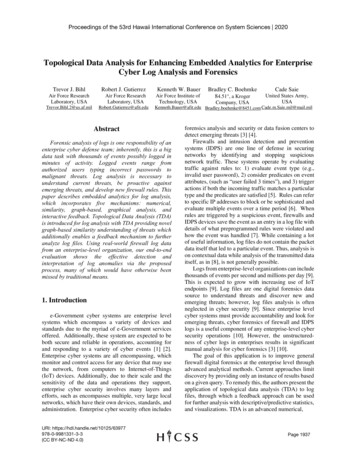
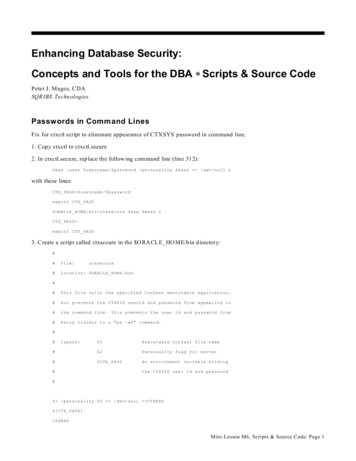
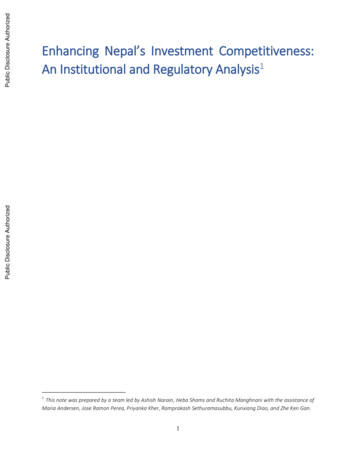
Table 1. A selection of the types of predicates used in the system.(S) means the predicate involves a single argument; (V) means thepredicate involves multiple arguments.Knowledge TypeLocationConnectionTraffic rderTrendVariabilitySample Predicate Descriptions(S) Dest IP is DNS server(S) Src ASN is Google(S) Protocol is TCP(S) Dest port is 80(S) Total bytes sent is 3000(S) The duration is 1 s(V) One event before another(V) In tight time sequence(V) Has same src IP(V) Has same dest AS number(V) Number of arguments(S) Data is within 2KB of 20KB(V) First argument has dest port 21(V) Last argument has dest port 514(V) Amount of data is increasing(V) Dest IP number is increasing(V) High distinct dest port usage(V) High dest IP access ratea predicate that can accept any number of arguments. Thefollowing clause generalizes the previous pattern describing a webpage load to any number of HTTP connections:identical source IP(x1,x2, ) ANDidentical destination IP(x1,x2, ) ANDtime sequence 2 seconds(x1,x2, ) AND( destination port 80(x1) ANDdestination port 80(x2) AND )To model network traffic, we initialize the system with thebuilt-in predicates in table 1. These predicates are organized bythe type of knowledge that is represented. Some representknowledge about the source or destination, the type of connection,the characteristics of the traffic, temporal relations and trends,variability etc. Others are provided for efficiency. The system alsoprovides an interface for analysts to add custom predicates.4.3Applying ModelsEach model in the knowledge base is stored as a label definitionpair Label, Clause , where the Label is the name for the pattern,and the Clause is a logical expression representing the pattern.To apply a label definition to the flow events, the systemproduces all the true groundings of the clause. A true grounding isa set of events for which the clause evaluates to true. The label isthen associated with each element of a true grounding.If the clause contained only 1 variable, then the system willappend a column with the label name to any table that contains anevent satisfying the clause. The label thus becomes an additionalattribute of the object and can be used accordingly.If the clause grounding contains more than 1 event, the systemwill append the label to each event that is a member of a truegrounding as above. In addition, the system will also create acollection of derived events, each of which corresponds to a truegrounding of the clause. For example, if the set of flows {a,b,c}and {d,e} both satisfied the “Web Page Load” label clause, wewill create a derived event abc that corresponds to {a,b,c}, andanother event de that corresponds to {d,e}. Intuitively the derivedabc event represents the web access event that caused the flows{a,b,c} to be observed, and similarly for de. The attributes of thederived event are computed (according to user specification) fromthe attributes of the events in the grounding.Once created, the derived events become part of the universe ofdiscourse and can be used in predicate arguments, and can haveother derived events built from them. Hence, derived eventspermit the analyst to reason at multiple levels, from the flowevents at the OSI transport level, up to derived events at theapplication level and beyond.5VISUAL KNOWLEDGE CREATIONTo create logical models, we have implemented a technique thatallows the analyst to select a pattern directly on the visualization,then explore the model space by iteratively constructing andevaluating candidate clauses; eventually converging to a clausethat models the pattern according to his domain knowledge. Theinteractive techniques are only briefly described. Full details canbe found in [17].In this section, we will motivate our approach and buildup theevent hierarchy by modeling web crawls based on the web pageaccess events from section 2.5.1Visual RepresentationTo create a model of a pattern, the analyst first needs to observean instance of the pattern in a visualization, which can be createdusing domain knowledge, or as part of exploratory analysis. Dueto the strong temporal nature of network events, we have foundthat event diagrams are especially useful. An event diagram is aplot that maps time on the X axis, a dimension or measure on theY axis, and a circular mark for each event.In the web crawl scenario, the analyst can use the visualizationshown in the figure below, which uses an event diagram to shownetwork traffic from Google to a set of local machines.5.2Selecting PatternsThe analyst selects a pattern by selecting the set of marks makingup an instance of the pattern directly on the visualization.Intuitively, the set of selected points is an example of the patternfor which a model is desired.In the web crawl scenario, the analyst observes that there arerapid bursts of HTTP requests from Google, each of which maybe caused by a web crawl. He therefore selects one burst of trafficon the visualization as an example web crawl, as seen above.5.3Identifying PredicatesUsing the selected data points, the system identifies a list ofpredicates from the knowledge base that are true for this set ofevents. These predicates are presented to the analyst as candidateterms for more complex logical clauses.
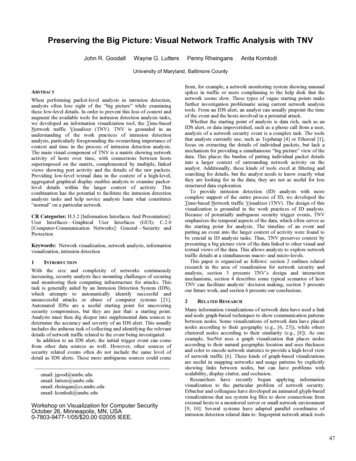
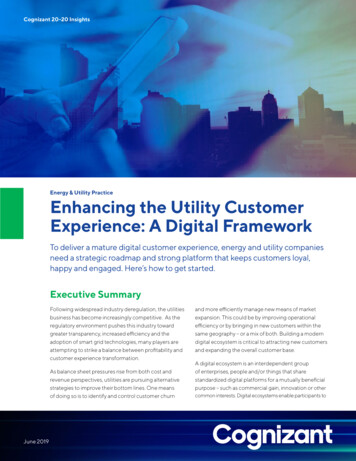
In the web crawl scenario, the identified predicates include thefollowing:destination port 80, destination Stanford,identical source asn, time sequence 30s,time sequence 60s, more than 4 events,more than 32 eventsSince this conjunction is more restrictive, only two sets ofevents satisfy the model. Note that the web crawler accessesseveral machines (circles at different y locations). This is becauseweb pages frequently reference pages on other web servers.Once the analyst has converged on a clause that models thepattern, he names the pattern, and commits the clause to theknowledge base. In the web crawl scenario, the final clause is:We were quite surprised that the “identical source IP” predicatewas not included. This led to the discovery that Google crawls awebsite using multiple machines, counter to our expectations.5.4Constructing a Logical ModelTo construct a model, the analyst interactively constructs andevaluates candidate clauses until he finds one that accuratelymodels the desired pattern. To generate a candidate clause, theanalyst selects a combination of predicates from the list ofpredicates. These predicates are formed into a conjunction; that is,the clause identifies those events that satisfy all the predicates. Toallow the analyst to evaluate the candidate model, the systemimmediately shows those groups that satisfy the model. Again, theinteractive techniques used are described in [17].In the web crawl scenario, the analyst knows that a web crawlerwill access numerous pages possibly from multiple web servers inquick succession. Therefore, he selects the predicates “timesequence 60 seconds” and “more than 4 events”. The truegroundings of the conjunction are shown below, where eachtime sequence 30s(x1,x2, ) ANDmore than 32 events(x1,x2, ) ANDidentical source AS number(x1,x2, ) AND( is web access event(x1) ANDis web access event(x2) AND )The predicate “identical source AS number” is needed togeneralize the web crawl pattern beyond Google.5.5Applying the ClauseOnce the analyst commits the model, the system applies the modelto the entire data set. Below we show the web crawl events fromdifferent ASNs. The picture shows that the model successfullygeneralized to find many web crawls from Google (15169) andalso from Inktomi (14776).6USING THE KNOWLEDGE BASEgrounding is a uniform color surrounded by a bounding box.The system is designed to leverage the knowledge base tofacilitate more effective visual analysis. In this section, wedescribe three ways that the system improves visual analysis.Unfortunately, this simple conjunction is satisfied by severalspurious patterns. In particular, multiple bursts are groupedtogether (the purple rectangle is really two web crawls), and thereseems to be short sequences of HTTP requests that maycorrespond to human navigation (the small boxes on the right).Therefore, the analyst modifies the model clause by selecting thepredicates: “more than 32 events” and “time sequence 30seconds”.6.1Controlling Visual AttributesThe knowledge base may be used to control visual attributes ofthe flows. This results in visualizations that show importantknowledge to the analyst, and are hence more insightful. As asimple example, we can map color to the type of traffic associatedwith the flow as seen in figure 2.6.2Changing Level of DetailAnalysts often want to reason at a higher level of abstraction.Given the size of the dataset, looking at low-level flow eventsoften is overwhelming. Changing level of detail is achieved in oursystem by visualizing derived events.To demonstrate the use of derived events to emphasize macropatterns in the data, consider the f
variety of network traffic, while at the same time it is becoming ever more important for analysts to understand network behaviors to provide quality of service, security, and misuse monitoring. To aid analysts in these tasks, researchers have proposed numerous visualization techniques that apply