Transcription
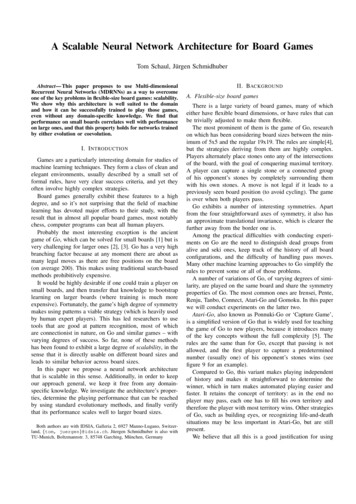
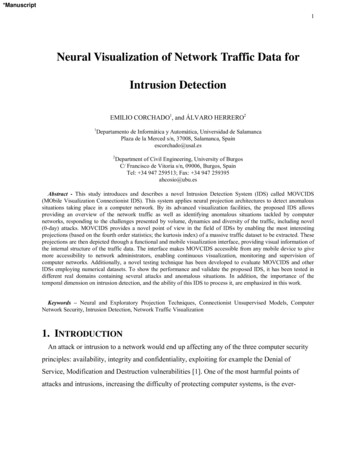
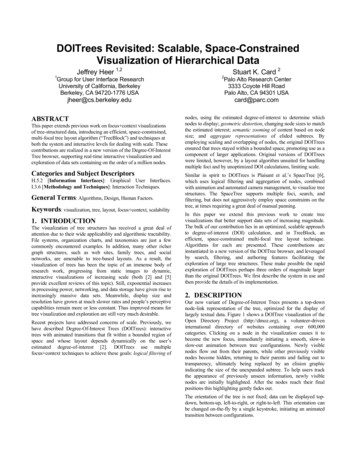
Scalable Network Traffic Visualization Using Compressed GraphsLei Shi , Qi Liao† , Xiaohua Sun‡ , Yarui Chen§ and Chuang Lin§Abstract—The visualization of complex network traffic involving a large number of communication devices is a commonyet challenging task. Traditional layout methods create thenetwork graph with overwhelming visual clutter, which hindersthe network understanding and traffic analysis tasks. Theexisting graph simplification algorithms (e.g. community-basedclustering) can effectively reduce the visual complexity, but leadto less meaningful traffic representations. In this paper, weintroduce a new method to the traffic monitoring and anomalyanalysis of large networks, namely Structural EquivalenceGrouping (SEG). Based on the intrinsic nature of the computernetwork traffic, SEG condenses the graph by more than 20times while preserving the critical connectivity information.Computationally, SEG has a linear time complexity and supports undirected, directed and weighted traffic graphs up to amillion nodes. We have built a Network Security and AnomalyVisualization (NSAV) tool based on SEG and conducted casestudies in several real-world scenarios to show the effectivenessof our technique.Keywords-Security; Visualization; Graph Compression;I. I NTRODUCTIONThere has been a recent surge of the network traffic inboth the Internet domain and the local area network, such asenterprise private networks and data center networks. Measuring and analyzing these traffic is made convenient latelythrough the development of Software-Defined Networking(SDN) and protocols such as OpenFlow [1]. In the process ofdealing with the network traffic, the visualization of overallconnection patterns, assumably as node-link graphs, is vitalin many scenarios. For example, in a company’s virtualprivate network, the administrators need a way to get accessto the latest traffic patterns to maintain situational awareness. Upon security alerts, they need to conduct interactivetraffic analysis to issue responsive mitigation and relevanttroubleshooting.However, it is challenging to visualize the network trafficgraph scaling to a large number of hosts and complex State Key Laboratory of Computer Science, Institute of Software,Chinese Academy of Sciences, Email: shil@ios.ac.cn† Department of Computer Science, Central Michigan University, Email:qi.liao@cmich.edu‡ College of Design and Innovation, Tongji University, Email:xsun@tongji.edu.cn§ Department of Computer Science and Technology, Tsinghua University, Email: chenyarui@tsinghua.org.cn, chlin@tsinghua.edu.cnThis work is supported in part by the National Basic Research Programof China (973 Program) under Grant No. 2010CB328105, National ScienceFoundation of China (NSFC) under Grant No. 60932003 and 60973144.connection patterns. First, the quadratic-complexity forcedirected drawing methods for the general graph [2] can notcalculate a good layout in real time ( 1s) for a graph withmore than a hundred nodes. Meanwhile, the number of hostsin an Ethernet can easily reach multi-thousands withoutcounting different ports. Second, even if faster large graphlayouts can be computed in servers through optimizations[3] [4], the visual clutter in the node-link representation (asin Figure 1(b)), mainly the edge crossings, prohibits the userfrom understanding the network traffic in details. Third, thegraph clustering algorithms with cohesive or distance basedmeasures, also known as community detection algorithms,can greatly reduce the visual complexity by the multiscale graph abstraction approaches [5] [6]. Though quitesuccessful in analyzing social networks, these methods canlead to poor results when communities are not prevalent,which is the case for most network traffic graphs. An visualexample is shown in Figure 1(c). Moreover, the clusteredtop view hides the context and topology details, which arecritical to traffic pattern analysis and discovery.In this paper, we introduce a new graph simplificationmethod to the network traffic visualization problem, basedon the concept of structural equivalence [7] [8] well-knownin the social network research field. Rather than detectingcommunities, structural equivalence classifies the networknodes into categories by their position taken in the network,depending merely on the network graph. Empirically this canbe better than the community-based clustering methods inboth reducing the graph size and preserving the connectivityinformation, due to the high-frequency subgraph patterns inthe network traffic, such as singletons, hubs, and connectors(Figure 1(b)). As shown in Figure 1(a), a 3460-host trafficgraph is reduced to 18 grouped nodes and 28 edges, whilethe same graph by the modularity clustering [9] generates50 intermediate cluster nodes (a maximal depth of 4), 939unclustered nodes and 15438 edges in the top view. Thesimilar node pairing or grouping ideas have previously beenstudied in [10] [11], as summarized in Section II, but noneof them develop and explore the method in an interactivenetwork traffic visualization context.In more detail, we propose our main algorithm, StructuralEquivalence Grouping (SEG), in Section III. SEG completesin linear time for sparse traffic graphs. Beyond the undirectedgraphs, we extend SEG to support the directed and weightedgraphs. We also develop the fuzzy SEG method to controlthe visual complexity in a finer granularity. The visual
(a) SEG-compressed view in NSAV toolFigure 1.(b) Original view(c) Clustered view(d) Manual grouped view after SEGVAST 2012 Mini Challenge-II network traffic graph in 40 hours (3460 nodes, 48599 edges), under different visualization approaches.encodings and interaction methods for the SEG-compressedtraffic graph are introduced in Section IV. Notably wesupport both SEG-defined and manual node grouping forflexible graph navigation and analysis, as shown in Figure1(d). The proposed SEG-based network traffic visualizationmethod is integrated into a tool called Network Securityand Anomaly Visualization (NSAV), which is evaluated inthe case studies under the computer network and securityscenarios in Section V. Results show that the NSAV tool cansignificantly improve the domain user’s capability in theirtraffic graph understanding, analysis and detail-accessingtasks.II. R ELATED W ORKA. Structural EquivalenceThe theory of structural equivalence dates back severaldecades to the seminar work by social scientists Lorrain andWhite [7]. In this very first paper, a categorical approach forthe algebraic analysis of social networks is proposed. Theaim is to reduce the social structure for better empirical studyon individuals’ relationships. The structural equivalence isdefined between two individuals who have the same type ofrelationships with any others in the network.Though the concept of structural equivalence is very neatand easy to implement, in real world very few individualsin the network share exactly the same relationships. Manyrelaxing definitions of structural equivalence are proposedlater. In [12], automorphic equivalence is developed thatthe two individuals are equivalence if they are swappabletogether with some related others while keeping all thenetwork relationships intact. To better capture the notionof social roles, the concept of structural relatedness [13]and later regular equivalence [8] are proposed. Rather thanrequiring exactly the same relationships with any others,two individuals are equivalent if they share the same setof neighborhood types.B. Graph Visualization by Node GroupingThe most relevant visualization work is the graph drawingwith modular decomposition [10]. Rooted in the graphtheory, the module of a graph defines a set of nodesthat all nodes in the set are either neighbors or nonneighbors simultaneously to all the other nodes outside theset. Meanwhile, the modular decomposition is the processto recursively partition the graph into a tree where everytree node is a module of its parent. In [10], an algorithmto draw a graph bottom-up along its modular decompositiontree is proposed. The results are shown to reveal the graphstructure while preserving several layout aesthetics. Thesimilar work of motif simplification is done in [11] where thefrequent local structures in graph, such as fans, connectorsand cliques, are extracted and rendered as common motif
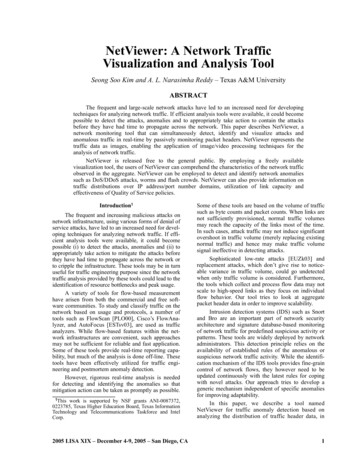
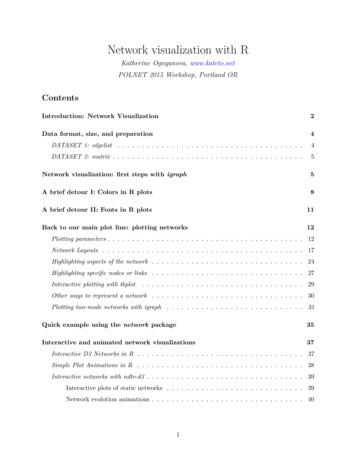
(a) Original graph(b) Compressed graphFigure 2. SEG on an undirected graph.glyphs encoding the type, size and specification. In the largegraph drawing context, the property of neighborhood setis applied in an iterative coarsening process to reduce thegraph to smaller ones and layout recursively by the multilevel drawing approach [14] [4]. The latest work in [15]applies the node grouping to the representation of graphadjacency matrices for visualizing gene regulatory networks.For a comprehensive survey in the area of large graphvisualization, readers can refer to the paper in [16].III. A LGORITHMA. Structural Equivalence GroupingIntuitively, SEG aggregates the graph nodes with thesame neighbor set together into groups and construct a newgraph for visualization. For example in the traffic graphof Figure 2(a), the host “192.168.2.23” can be combinedwith the other three surrounding hosts with exactly the sameconnection pattern. The new graph after SEG (Figure 2(b)) iscalled the compressed graph. The compressed graph has twokinds of nodes: the single-node remaining from the originalgraph (drawn in hollow) and the mega-node grouped frommultiple sub-nodes in the original graph (drawn with filledcolors). Before we formally describe the algorithms, graphterminologies throughout this paper are first defined.Definition. Let G (V, E) be a directed, weighted andconnected original graph where V {v1 , ., vn } and E {e1 , ., em } denote the node and link set. Let W be the graphadjacency matrix where wi j 0 indicates a link from vi tov j , with wi j denoting the link weight. In each row of W , Ri {wi1 , ., win } denotes the row vector for node vi , representingits connection pattern. The compressed graph after SEG isdenoted as G (V , E ). The compression rate is definedby Γ 1 V / V (1 E / E in Section III-D).The basic SEG algorithm takes the graph as a simple,undirected and unweighted one by setting wii 0 and wi j w ji 1 for any wi j 0.Structural Equivalence Grouping. On graph G, for anycollection of nodes with the same row vector (including thesingle outstanding node), aggregate them into a new meganode/single-node Gvi {vi1 , ., vik }. All Gvi form the nodeset V for the compressed graph G . Let f vi vi1 denote thefirst sub-node in Gvi . The link set E in G are generatedby replacing all f vi with Gvi in the original link set, andremoving all the links not incident to any f vi . SEG is singlepass on any graph, as any two nodes in the compressed graphhave different row vectors.Directed Graph. The adjacency matrix W is transformed to encode the both connection directions for eachnode. Each row vector Ri (i 1, ., n) becomes Ri {wi( n) , ., wi( 1) , wi1 , ., win } having wi( j) w ji for j 1, ., n.Weighted Graph. The adjacency matrix W is switched tothe weighted one by mapping a numeric data attribute of link(i, j) (e.g. flow count in the traffic graph) to wi j in the matrix.To further increase the compression rate, discretization ofthe link weight is allowed: transform all link weights intowi j (0, 1] by either linear or non-linear normalization, andthen pick a bin count B(B 1) and regenerate link weightsby wi j dwi j Be.Supporting Clique. By the basic SEG, the sub-nodeswithin a mega-node do not have any intra-group link.However, it is also useful to group a clique of nodes withthe same external connection together. Specific renderingcan be applied to differentiate between mega-nodes withisolated and fully connected sub-nodes. We devise a twostep approach to achieve that: in the first step, the graphadjacency matrix W is set to wii 0, allowing the groupingof isolated nodes. In the second step, W is reset to wii 1and all the original nodes not aggregated in the first step aregrouped again.B. Controlling the Compression RateSEG is a deterministic algorithm in that for the sameoriginal graph, it always produces the same compressedgraph. In the real usage, the user would like to flexiblycontrol the visual complexity after the compression.Fuzzy Structural Equivalence Grouping. The basic ideaof fuzzy SEG is to group nodes with not only the same,but also the similar neighbor set. The compression ratecan be increased with bounded compensation on accuracy.The key is to define the pairwise similarity score betweengraph nodes. Here we adopt the standard Jaccard similarityT A S B between two sample sets A and B by J(A, B) AB . Forthe directed and weighted graphs, we introduce a unifiedJaccard similarity computation between node vi and v j in min(w ,w )graph G by ρ k max(wik ,wjk ) . Note that for the directedik jk kgraph, k n, ., 1, 1, ., n. Fuzzy SEG is achieved bysetting a similarity threshold ξ . The pair of nodes with ρ ξare grouped together iteratively.C. ImplementationStructural Equivalence Grouping. The core step of SEGto group nodes with the same row vector is achieved throughan appropriate hash function H(Ri ) over the row vectoridentifiers. The row vector identifier is created by splicingthe positive cells in the row into a string. This hash-basedimplementation has a computational complexity of O(ND).
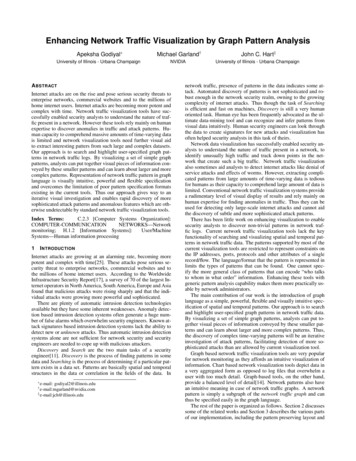
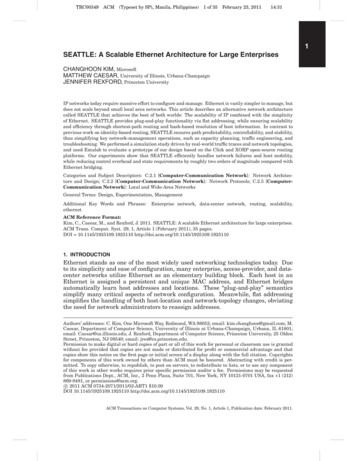
Table ISEG PERFORMANCE ON VAST11 C HALLENGE DATASET.Dataundirected, sim 1undirected, sim 0.8undirected, sim 0.5directed, sim (after)0.0840.0880.0790.084Table IISEG PERFORMANCE ON VAST12 C HALLENGE DATASET.Dataundirected, sim 1undirected, sim 0.8directed, sim 1directed, sim 151layout(after)0.0780.0620.1250.078Table IIISEG PERFORMANCE ON T WITTER SOCIAL NETWORKS .Datamention undirectedmention, sim 0.5, anchormention, sim 0.5, shinglefollower .7%51.3%12%time(SEG)2.074370.12124.9232.835Here N is the number of nodes in the original graph, D isthe average node degree for the complexity to splice andhash each row vector identifier. Therefore, the basic SEGhas a linear complexity and will perform well even for verylarge graphs.Fuzzy Structural Equivalence Grouping. We introducean improvement by the shingle-ordering [17] on the fuzzySEG implementation. For each row vector Ri , constructthe element set Ai {a wia 1}. Given any permutationσ : {1, ., n} {1, ., n}, the shingle of the row vector Riis defined by Mσ (Ai ) σ 1 (minα Ai {σ (α)}). By shingleproperties [17], the probability that shingles of set A andB are identical is precisely their Jaccard coefficient J(A, B).The corresponding fuzzy SEG algorithm still works in agreedy manner to scan each node in a order. Each newlyscanned node without a group is selected as an anchor nodeand also create a new group around the anchor node togetherwith the other nodes similar enough. Using shingle-basedmethod, we do not need to compare pairwise similarity. Instead, we pre-compute and record k shingles for each node’sneighbor set, using k orthogonal permutation functions. Atmost kN lists are created, each holding the nodes with a sameshingle result (1 N) by one permutation function. Then foreach anchor node, we can get the set of similar enough nodesby scanning the k corresponding list, according to the shingleproperty. The overall complexity is O(kND kN D2 ), wherekND is the complexity to pre-compute shingles, D2 is theaverage size of the 2-hop neighbor set of each node, alsothe upper bound of the average length of each list to scan.In most graphs, the complexity is significantly below N 2 .D. PerformanceWe evaluate the SEG performance in terms of the visualcompression rate (by the number of edges), the compressiontime and the layout time before and after SEG. All theexperiments are carried out on the same 64-bit Windowsdesktop (Intel Core i7@3.40GHz with 8GB memory). TableI and II show the results on two traffic graph datasets.Figure 3. User interface for compressed graph visualization. Left: SEGcontrollers. Right: main panel for traffic visualization. Data set is fromVAST Challenge 2011.Notably for both cases, SEG achieves a more than 95%compression rate with the basic algorithm or applying afuzzy setting. The compression time is mostly below 0.5second, reaching up to 104 edges. The layout time after SEGis significantly reduced from that of the original graph.We also experiment on one type of extreme-scale graph:the twitter social graphs with up to millions of edges (TableIII). Because these graphs are beyond the application domainof SEG, we only report their running time for the purposeof a scalability study. The basic SEG compresses the largestgraph in half a minute; the fuzzy SEG with the shingleimplementation supports graphs with up to 105 edges andreturns results in 25 seconds.IV. V ISUALIZATIONA. Compressed Graph Visual EncodingThe right panel of Figure 3 gives an example of the SEGcompressed graph visualization. As shown in the figure, themega-nodes are differentiated from the single-nodes by thefill color. The single-nodes have no fill and the mega-nodeshave standard fill colors, with the color saturation mappedto the number of sub-nodes in the group. The larger groupis filled with the more saturated color. By default, the fillcolor hue is blue, e.g. the top-right node “192.168.1.10 ”.For the mega-nodes created by the fuzzy SEG, e.g. the node“192.168.2.11 ” on the right, the fill color will graduallyshift from blue to green and then to brown, according tothe smallest pairwise similarity score within the group. Themega-node containing totally dissimilar nodes will lead toa pure brown fill color. We do not use the node size torepresent the group size of the mega-node, since the groupsize normally has a rather biased distribution. The largegroups can introduce unnecessary visual complexities whichcounters our initial design goal.Labels of the mega-node are created by aggregating thelabels of the sub-nodes in the original graph. Due to thespace limitation, an abstracted label is drawn on each meganode as the node identifier. The full label will pop-up upon
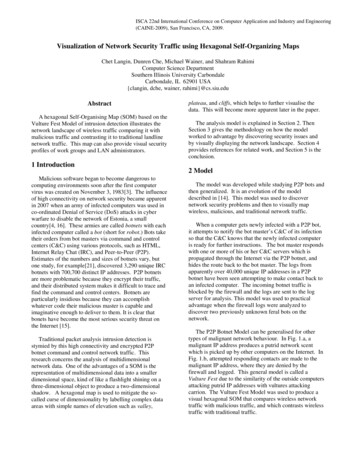
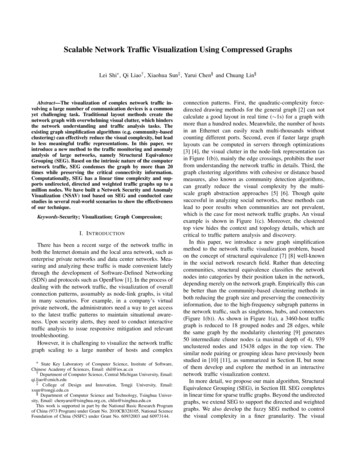
All Freight Corporationa mouse hovering or a click action, e.g. the one on thenode “192.168.1.10 ”. The group size of each mega-node isdrawn below the visual node, together with the intra-groupsimilarity score when it is below one. By default, straightlines are used to represent the links in the compressed graph,with thickness mapped to the sum of counts of all thecorresponding links in the original graph. Compressed graphattributes can also be mapped flexibly into the visuals. Forexample, the node label can be the host types (Figure 1(a))or the alphabetical anomaly icons (Figure 3) indicating thetype of anomalies happening on the host.B. Graph Interaction DesignAFC.COMNetwork 00.150.1Cisco 20Cisco 3750E SwitchDMZ (VLAN 30)VLAN10192.168.1.1External Web ServerSpan PortFirewall log(192.168.1.50)SnortIDS192.168.1.16Office - Vlan 20 - 192.168.2.x/24Data Center – Vlan 10 – 192.168.1.x/24DHCP pool192.168.2.10-250Shipping/RoutingDatabase ServerSRDB01(192.168.1.4)Mail ServerEX01(192.168.1.6)File ServerFS01(192.168.1.7)Internal WebServerWEB01(192.168.1.5)DC / DNS / DHCPDC01(192.168.1.2)150 WorkstationsHR DatabaseServerHRDB01(192.168.1.3)DC / DNSDC2(192.168.1.14)Figure 4. AFC network topology. Top-left: anomaly icon for event types.Top-right: acceptabl
Scalable Network Traffic Visualization Using Compressed Graphs Lei Shi, Qi Liao†, Xiaohua Sun‡, Yarui Chen§ and Chuang Lin§ Abstract—The visualization of complex network traffic in-volving a large numb