Transcription
High-Speed Network Traffic MonitoringUsing ntopngLuca Deri deri@ntop.org @lucaderi 2014 - ntop.org
OutlookWhat are the main activities of ntop.org ? ntop’s view on network monitoring. From ntop to ntopng. ntopng architecture and design. ntopng as a flow collector Exploring system activities using ntopng Using ntopng. Advanced monitoring with ntopng. Future roadmap items. 2014 - ntop.org2
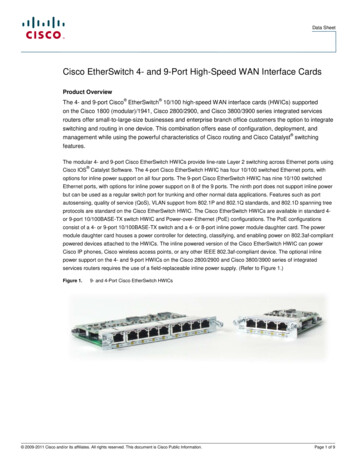
About ntop.org [1/2]ntop develops of open source network trafficmonitoring applications. ntop (circa 1998) is the first app we released andit is a web-based network monitoring application. Today our products range from traffic monitoring,high-speed packet processing, deep-packetinspection, and IDS/IPS acceleration (snort andsuricata). 2014 - ntop.org3
About ntop.org [2/2] Our software is powering many commercialproducts. 2014 - ntop.org4
ntop GoalsProvide better, yet price effective, trafficmonitoring solution by enabling users to haveincreased traffic visibility. Go beyond standard metrics and increase trafficvisibility by analysing key protocols in detail. Provide users comprehensive and accurate trafficreports able to offer at a fraction of price whatmany commercial products do together. Promote open-source software, while protectingselected IPRs. 2014 - ntop.org5
ntop’s Approach to Traffic MonitoringAbility to capture, process and (optionally)transmit traffic at line rate, any packet size. Leverage on modern multi-core/NUMAarchitectures in order to promote scalability. Use commodity hardware for producingaffordable, long-living (no vendor lock), scalable(use new hardware by the time it is becomingavailable) monitoring solutions. Use open-source to spread the software, and letthe community test it on unchartered places. 2014 - ntop.org6
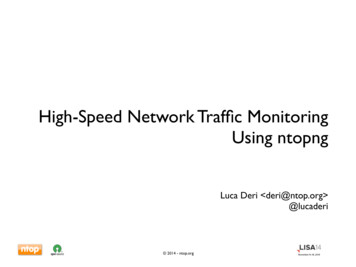
Some HistoryIn 1998, the originalntop has been created. It was a C-based appembedding a web serverable to capture trafficand analyse it. Contrary to many tools available at that time,ntop used a web GUI to report traffic activities. It is available for Unix and Windows under GPL. 2014 - ntop.org7
ntop ArchitectureHTTP/HTTPSRRD 2014 - ntop.orgCisco NetFlowInMon sFlow8
Why was ntop obsolete?Its original LAN-oriented design prevented ntopfrom handling more than a few hundred Mbit. The GUI was an old (no fancy HTML 5)monolithic piece written in C so changing/extending a page required a programmer. ntop could not be used as web-less monitoringengine to be integrated with other apps. Many components were designed in 1998, and itwas time to start over (spaghetti code). 2014 - ntop.org9
ntopng Design GoalsClean separation between the monitoring engineand the reporting facilities. Robust, crash-free engine (ntop was not really so). Platform scriptability for enabling extensions orchanges at runtime without restart. Realtime: most monitoring tools aggregate data (5mins usually) and present it when it’s too late. Many new features including HTML 5-baseddynamic GUI, categorisation, DPI. 2014 - ntop.org10
ntopng Architecture Three different and self-contained components,communicating with clean API calls.HTTPLua-based Web ReportsLua API CallsUsers(Linux) KernelnDPI-based C Monitoring EngineData CachePF RING C API CallsPF RING Kernel Moduleand Drivers 2014 - ntop.orgInternetTraffic11
ntopng Monitoring EngineCoded in C and based the concept of flow(set of packets with the same 6-tuple). Flows are inspected with a home-grown DPIlibrary named nDPI aiming to discover the “real”application protocol (no ports are used). Information is clustered per: ! (Capture) Network Device! Flow! Host! High-level Aggregations 2014 - ntop.org12
Local vs Remote Hosts [1/2]ntopng keeps information in memory at differentlevel of accuracy in order to save resources forhosts that are not “too relevant”. For this reason at startup hosts are divided in: Local hostsThe local host where ntopng is running as well the hostsbelonging to some “privileged” IPv4/v6 networks. Thesehosts are very relevant and thus ntopng keep full statistics. Remote hostsNon-local hosts for which we keep a minimum level ofdetail. 2014 - ntop.org13
Local vs Remote Hosts [2/2]For local hosts (unless disabled via preferences)are kept all L7 protocol statistics, as well basicstatistics (e.g. bytes/packets in/out). No persistent statistics are saved on disk. A system host is the host where ntopng isrunning and it is automatically considered local aswell the networks of its ethernet interfaces. 2014 - ntop.org14
Information Lifecyclentopng keeps in memory live information such asflows and hosts statistics. As the memory cannot be infinite, periodicallynon-recent information is harvested. Users can specify preferences for data purge: 2014 - ntop.org15
Packet Processing Journey1.Packet capture: PF RING (Linux) or libpcap.2.Packet decoding: no IP traffic is accounted.3.IPv4/v6 Traffic only:1.Map the packet to a 6-tuple flow and increment stats.2.Identify source/destination hosts and increment stats.3.Use nDPI to identify the flow application protocol1.UDP flows are identified in no more than 2 packets.2.TCP Flows can be identified in up to 15 packets in total,otherwise the flow is marked as “Unknown”.4.Move to the next packet. 2014 - ntop.org16
PF RING [1/2] In 2004 we realised the the Linux kernel was notefficient enough to fulfil our packet capturerequirements and thus we have written a inkernel circular buffer named PF RING.Application AApplication ZOutgoing ocket(ring)WriteIndexPF RINGNetworkAdapter 2014 - ntop.orgIncoming Packets17
PF RING [2/2] It creates a straight path for incoming packets accessed fromuser-space applications with memory mapping. No need to use custom network cards: any card issupported. Transparent to applications: legacy applications need to berecompiled in order to use it (pcap-over-PF RING). Developers familiar with network applications canimmediately take advantage of it without having to learnnew APIs. Acceleration support for many popular open-sourceapplications including Wireshark, Suricata and Snort. 2014 - ntop.org18
Moving towards 10 Gbit and above [1/2]The original PF RING is a good solution up to3/5 Gbit but not above as the cost of packet copyinto the ring is overkilling. PF RING ZC (Zero Copy) isan extension that allowspackets to received/transmittedin zero copy similar to whatFPGA-accelerated cards (e.g.Napatech) do in hardware. leratedCardsNICMemoryMapFPGADevice Driver 2014 - ntop.org19
Moving towards 10 Gbit and above [2/2]In ZC a packet is put by the ingress NIC into ashared memory buffer, and it hop acrossapplications (and VMs) by exchanging the bufferpointer (packets don’t move). Thanks to this solution it is possible to createarbitrary packet processing topologies atmulti-10 Gbit line rate using commodityhardware x86 servers and adapters (ZC nativelysupports Intel ethernet adapters). 2014 - ntop.org20
PF RING ZC h2sysdiglibpfringpf ring modZC modNapatech modStack modsysdig modNapatech libKernelpf ring.koring buffer(packet copy)Standard / PF RING-awareDriversNAPIStandard el NICFPGANapatechCard 2014 - ntop.org2121
PF RING ZC [1/2]The idea behind ZC is to create a playground forprocessing information (and in particular networkpackets) in zero copy. In order to implements this, ZC comes with 0copy user-space drivers (for 1 and 10G IntelNICs) that allow packets to be read in 0-copy. 1-copy packets (e.g. received on non-Intel NICsor WiFi/Bluetooth devices) can be injected in ZCand from that time onwards, be used in 0-copy. 2014 - ntop.org22
PF RING ZC [2/2] PF RING ZC has a clean and simple API that hides manylow-level configuration details. Support of legacy pcap-based applications. Ability to operate on top of sysdig.org for dispatchingsystem events to PF RING applications.ZC has simple components: queue and worker.KVM support: ability to setup Inter-VM communication.Native PF RING ZC support in many open-sourceapplications such as Snort, Suricata, Bro, Wireshark. 2014 - ntop.org23
PF RING ZC Network Topologies [1/2]LinuxCustomerAppZero CopyPF RING/pbased Application(e.g. ntopng)CustomerApp BCustomerApp CCustomerApp DPF RINGPF RINGPF RINGBalancerPF RINGZCZCZCZCCore 0 Core 1 Core 2 Core 31/10G1/10GUse Case:Load balancing across ntopng applications. 2014 - ntop.org24
PF RING ZC Network Topologies [2/2]LinuxCustomerAppPF RINGZCCustomerCustomerApp BApp CPF RINGPF RINGZCZCKVMKVMCustomerAppPF RINGZCCore 0 Core 1 Core 2 Core 31/10G1/10GUse Case:Application pipeline or run multiple apps (e.g. ntopng) in VMs to insulate them. 2014 - ntop.org25
PF RING (ZC) and ntopng Using PF RING (ZC) with ntopng has severalbenefits: ntopng can scale to 10 Gbit and above by spawningseveral ntopng instances each bound to a (few) core(s). It is possible to send the same packet to multiple apps.For instance it is possible to send the same packet tontopng (for accounting purposes) and n2disk (ntop’sapplication for dumping packet-to-disk at multi-10G)and/or and IDS (e.g. Suricata and snort). 2014 - ntop.org26
Traffic Balancing with PF RING ZCBalancingIngressPacket Aggregationzbalance ipc 2014 - ntop.org0-CopyPacket Fanout27
The need for DPI in Monitoring [2/2] DPI (Deep Packet Inspection) is a technique for inspectingthe packet payload for the purpose of extracting metadata(e.g. protocol).There are many DPI toolkits available but they are notwhat we looked for as: They are proprietary (you need to sign an NDA to use them), andcostly for both purchase and maintenance. Adding a new protocol requires vendor support (i.e. it has a highcost and might need time until the vendor supports it) you’relocked-in. On a nutshell DPI is a requirement but the market doesnot offer an alternative for open-source. 2014 - ntop.org28
Say hello to nDPIntop has decided to develop its own GPL DPItoolkit in order to build an open DPI layer forntop and third party applications. Supported protocols ( 180) include: P2P (Skype, BitTorrent) Messaging (Viber, Whatsapp, MSN, The Facebook) Multimedia (YouTube, Last.gm, iTunes) Conferencing (Webex, CitrixOnLine) Streaming (Zattoo, Icecast, Shoutcast, Netflix) Business (VNC, RDP, Citrix, *SQL) 2014 - ntop.org29
nDPI OverviewPortable C library (Win and Unix, 32/64 bit). Designed for user and kernel space Linux ndpi-netfilter implements L7 kernel filtersUsed by many non-ntop projects (eg. xplico.org)and part of Linux distributions (e.g. Debian). Able to operate on both plain ethernet trafficand encapsulated (e.g. GTP, GRE ). Ability to specify at runtime custom protocols(port or hostname - dns, http, https -based). 2014 - ntop.org30
nDPI API The nDPI API is pretty simple! ndpi init detection module()ndpi exit detection module()Init/term the nDPI library.! ndpi load protocols()Load custom protocol definitions.! ndpi detection process packet()Process the packet in nDPI and return the L7 protocol orNDPI UNKNOWN (too early or detection failed).! ndpi guess protocol()Guess a L7 protocols when DPI fails. 2014 - ntop.org31
nDPI on ntopngIn ntopng all flows are analysed through nDPI toassociate an application protocol to them. L7 statistics are available per flow, host, andinterface (from which monitoring data isreceived). For network interfaces and local hosts, nDPIstatistics are saved persistently to disk (in RRDformat). 2014 - ntop.org32
nDPI on ntopng: Interface Report [1/2] 2014 - ntop.org33
nDPI on ntopng: Interface Report [2/2]Live data scrolling 2014 - ntop.org34
ntopng and Redis [1/2]Redis is an open source key-value in-memorydatabase. ntop uses it to cache data such as: Configuration and user preferences information. DNS name resolution (numeric to symbolic). Volatile monitoring data (e.g. hosts JSONrepresentation). Some information is persistent (e.g. preferences)and some is volatile: ntopng can tell redis howlong a given value must be kept in cache. 2014 - ntop.org35
ntopng and Redis [2/2] Redis is also used as a (persistent) queue for requeststowards external applications. If configured (-F command line option), periodically flow status issaved onto a redis queue, requests are packed, and send to aremote BigData system. In essence Redis is used by ntopng to store informationthat might take too much memory (if kept on ntopngmemory space), or to pile up list of things that areexecuted periodically or that require interaction withremote applications that might be slow or temporaryunavailable. 2014 - ntop.org36
Lua-based ntopng Scriptability [1/3]A design principle of ntopng has been the cleanseparation of the GUI from engine (in ntop it wasall mixed). This means that ntopng can (also) be used (viaHTTP) to feed data into third party apps such asNagios or OpenNMS. All data export from the engine happens via Lua. Lua methods invoke the ntopng C API in orderto interact with the monitoring engine. 2014 - ntop.org37
Lua-based ntopng Scriptability [2/3] /scripts/callback/scripts are executedperiodically to performspecific actions. /scripts/lua/ scriptsare executed only by theweb GUI. Example:http://ntopng:3000/lua/flow stats.lua 2014 - ntop.org38
Lua-based ntopng Scriptability [3/3] ntopng defines (in C ) two Lua classes: interface! Hook to objects that describe flows and hosts.! Access to live monitoring data. ntop! General functions used to interact with ntopng configuration. Lua objects are usually in “read-only” mode C sets their data, Lua reads data (e.g. host.name). Some Lua methods (e.g. interface.restoreHost()) canhowever modify the information stored in the engine. 2014 - ntop.org39
ntopng as a NetFlow/sFlow Collector [1/3] The “old” ntop included a NetFlow/sFlowcollector. Considered the effort required tosupport all the various NetFlow dialects (e.g.Cisco ASA flows are not “really” flows), in ntopngwe have made a different design choice. 2014 - ntop.org40
ntopng as a NetFlow/sFlow Collector [2/3]nProbe (a home-grown NetFlow/sFlow collector/probe) is responsible for collecting/generatingflows and convert them to JSON so that ntopngcan understand it. The communication ntopng - nProbe is overØMQ a simple/fast messaging system that allowsthe two peers to be decoupled while: Avoiding “fat” communication protocols such as HTTP. Relying on a system that works per message (no perpacket) and handles automatic reconnection if necessary. 2014 - ntop.org41
ntopng as a NetFlow/sFlow Collector [3/3]Flows are sent in the following 4} Where: “ Element ID ”: value (example 8 IPV4 SRC ADDR) Contrary to what happens in NetFlow/sFlowntopng (collector) connects to nProbe (probe) andfetches the emitted flows. Multiple collectors canconnect to the same probe. No traffic is createdwhen no collector is attached to the probe. 2014 - ntop.org42
Flow Collection Setup: an ExampleFlow collection/generation (nProbe) Probe modenprobe --zmq "tcp://*:5556" -i eth1 -nnone sFlow/NetFlow collector modenprobe --zmq "tcp://*:5556" -i none -nnone --collector-port 2055Data Collector (ntopng) ntopng -i tcp://127.0.0.1:5556 2014 - ntop.org43
Creating ntopng Clusters [1/3]ntopng is not only a flow collector, but it canexport flows in the same JSON format used inthe received flows. This allows complex clusters to be created: 2014 - ntop.org44
Creating ntopng Clusters [2/3]In many companies, there are many satellite officesand a few central aggregation points. Using ØMQ (both ntopng and nProbe flows are inthe same format) it is possible to create a hierarchyof instances. Each node aggregates the trafficfor the instances “below” it, sothat at each tree layer you havea summarised view of thenetwork activities. 2014 - ntop.org45
Creating ntopng Clusters [3/3]Example Start the remote nProbe instances as follows [host1] [host2] [host3] 56″“tcp://*:5556″-i-i-i-iethXethXethXethX If you want to merge all nProbe traffic into a single ntopng interface do: ntopng -i ,tcp://host4:5556 If you want to keep each nProbe traffic into a separate ntopng interface do: ntopng -i tcp://host1:5556 -i tcp://host2:5556 -i tcp://host3:5556 -i tcp://host4:5556 2014 - ntop.org46
System Network Monitoring [1/3]Historically on Unix thereare many tools for systemmonitoring. Like when we started thedevelopment of ntop, allthese tools are nice per-se, but are not integratedwith the rest of the environment. ntopng/nProbe monitor network activities, but haveno visibility of the processes that are originating theobserved network activities. 2014 - ntop.org47
System Network Monitoring [3/3]How most system management tools work onLinux:1lsof/proc23 2014 - ntop.org48
System Network Monitoring [3/3] Using ntopng/nProbe you can see the flows thatare are being exchanged across systems but it isnot possible to know more than that.Flow?Host? 2014 - ntop.org?49
System Network Monitoring [3/3]It would be desirable to know exactly what is theprocess originating the traffic observed and whatresources the process is using while generatingsuch traffic. In essence we would like to see this picture: 2014 - ntop.org50
Welcome to SysdigSysdig is a Linuxframework developedby Draios Inc forcapturing system calls. The kernel moduleintercepts the calls. The user-space libsreceive and interpretthe received calls. 2014 - ntop.org51
Why Sysdig? Contrary to all other tools available for systemmonitoring, sysdig implements the “packetparadigm” applied to system events: Events are received in a way similar to what happenswith packet capture. It is possible to store events on pcap-like files and replythem later on. To simplify things, instead of using the sysdig API,we added native sysdig support in PF RING sothat all apps (e.g. ntopng) can use it. 2014 - ntop.org52
Integrating sysdig in nProbe [1/3]Instead of complicating the design of ntopng withsysdig support, we have decided to extendnProbe with system visibility. nProbe monitors both the network interfacesand the system events via PF RING. Network and system information is thencombined and exported in standard networkflows over NetFlow v9/IPFIX and in JSON tontopng for data visualization. 2014 - ntop.org53
Integrating sysdig in nProbe [2/3] The current system information 2.394]%SRC PROC PID%SRC PROC NAME%SRC PROC USER NAME%SRC FATHER PROC PID%SRC FATHER PROC NAME%SRC PROC ACTUAL MEMORY%SRC PROC PEAK MEMORY%SRC PROC AVERAGE CPU LOAD%SRC PROC NUM PAGE FAULTS%SRC PROC PCTG IOWAIT%DST PROC PID%DST PROC NAME%DST PROC USER NAME%DST FATHER PROC PID%DST FATHER PROC NAME%DST PROC ACTUAL MEMORY%DST PROC PEAK MEMORY%DST PROC AVERAGE CPU LOAD%DST PROC NUM PAGE FAULTS%DST PROC PCTG IOWAIT 2014 - DstDstDstDstDstSrcprocess PIDpro
Local vs Remote Hosts [2/2] For local hosts (unless disabled via preferences) are kept all L7 protocol statistics, as well basic statistics (e.g. bytes/packets in/out). No persistent statistics are saved on disk. A system host is the host where ntop