Transcription
CartONG – 23 Boulevard du Musée, 73000 Chambéry – Francewww.cartong.org info@cartong.orgD A T A VI S U A L I Z A T I O N T OO L S BE N C H M A R K I N G W I T HA BR I E F U S E R G U I D E – T H E E S R I S U I T EThis publication has been produced with the assistance of the Office of the UnitedNations High Commissioner for Refugees (UNHCR). The content of this publication isthe sole responsibility of CARTONG and is not reflecting the views of UNHCR in any way.info@cartong.org www.cartong.orgPage 1 47
CartONG – 23 Boulevard du Musée, 73000 Chambéry – Francewww.cartong.org info@cartong.orgTable of ContentsIntroduction . 31.ESRI tools Comparison . 41.1. ArcGIS Maps for Power BI . 41.2. Web AppBuilder (Dashboard theme) . 61.3. ArcGIS Dashboard . 71.4. Insights for ArcGIS. 81.5. Summary Table . 102.Limits and assets overview . 142.1. What are the differences . 142.2. Decision tree . 142.3. Conclusion . 15Annex 1.Walk-throughs with technical tests . 161.1. ArcGIS Maps for Power BI . 161.1.A. Power BI Licenses . 161.1.B. ArcGIS Maps for Power BI licenses . 161.1.C. Walk-through and technical test . 181.2. Web AppBuilder for ArcGIS . 261.2.A. Walk through and technical tests . 261.2.B. Technical possibilities . 271.2.C. Developer Edition . 301.3. Dashboard for ArcGIS . 311.3.A. Walk-through and technical test . 311.3.B. ArcGIS Dashboard Beta Release of March 2020 . 331.4. ArcGIS Insights . 341.4.A. Walk-through and technical tests . 341.4.B. ArcGIS Insights in ArcGIS Enterprise . 37Annex 2.Case studies with UNHCR data . 382.1. Standard Expanded Nutrition Survey (SENS) with Power BI for ArcGIS . 382.2. Visualization and analysis of the Ethiopia site mapping data with ArcGIS WebAppBuilder . 402.3. COVID-19 Public Health Preparedness and Response Dashboard with ArcGISOperations Dashboard . 422.4. Visualization and analysis of the Ethiopia site mapping data with Insights forArcGIS . 44info@cartong.org www.cartong.orgPage 2 47
CartONG – 23 Boulevard du Musée, 73000 Chambéry – Francewww.cartong.org info@cartong.orgIntroductionWith many tools around to create dashboards, it is not always easy todecide the best one to go for. To help answering this question, thisdocument aims to compare the four existing ESRI products and identifytheir suitability for a given scenario. This benchmarking is based both ontesting and real-life use cases of CartONG and the Global Data Service ofthe United Nations High Commissioner for Refugees (UNHCR).The following four types of dashboards from the ESRI suite have beenincluded in this benchmarking1: ArcGIS Maps for Power BI ArcGIS Web AppBuilder ArcGIS Dashboards (formerly Operations Dashboard for ArcGIS) Insights for ArcGISAlthough these are all data visualization tools, their functionalities are different and meant toaddress different scenarios, use cases and user groups. Hence, the goal is not to find one goodsolution for all contexts but to provide an overview of what tool may be the most suitedfor a specific task.The document will start with an overview and individual review on each of the four tools includingtheir main assets, functionalities and licensing requirements. In contrast, the subsequentsummary chapter, including the feature table on pages 9-11 and the decision tree will comparethe offerings of each tool against each other.Annex 1 will provide a walk-through on how to start the dashboard configuration on each tool,starting from the data imports to working on the visualizations. This chapter will provide concreteexamples of the strengths and limitations of each tool, with the site mapping data used fortesting. Likewise, Annex 2 will bring together existing use cases of visualizing the UNHCR datawith each of the ESRI tools.D EFINITION :While many definitions of a dashboard exist, very few of them are suitable to the humanitarianand non-profit settings where the focus is on saving and improving human lives rather thanmaximising the profit. Below is the definition of the Humanitarian Dashboard of the Inter-AgencyStanding Committee (IASC) in 2012:“The purpose of the Humanitarian Dashboard is to consolidate and present needs assessment and othercore humanitarian information at crisis-level in an accessible format that facilitates analysis and evidencebased decision-making. The Humanitarian Dashboard is intended to: Assist the humanitarian country team in facilitating analysis, dialogue and strategic programmingon needs, coverage, gaps and priorities;Assist cluster lead agencies in presenting consolidated assessment information from within theclusters, and in tracking/highlighting progress against their targets;Serve as the basis for a process of inter-sectoral analysis, including the discussion of needs,coverage, gaps and priorities across clusters;Highlight information gaps and point out areas to be targeted for further needs assessment;Support advocacy by illustrating key issues, bottlenecks, number of people in need, andcoverage.”ESRI ArcGIS Experience Builder, first released in 2020, has been omitted from this benchmarking due to timeconstraints.1info@cartong.org www.cartong.orgPage 3 47
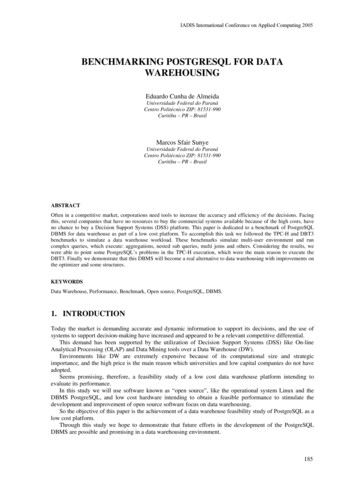
CartONG – 23 Boulevard du Musée, 73000 Chambéry – Francewww.cartong.org info@cartong.orgIn summary, a dashboard is a way of displaying key performance indicators, such as the needsversus coverage, on a single page. By bringing together the core data, a dashboard is often usedas a report, a snapshot of performance or the operational reach.REQUIREMENTSOF THE UNITED NATIONS HIGH COMMISSIONER FOR REFUGEES( UNHCR ):This comparison will be based on a UNHCR use case of visualizing the camp mapping data. Theaim is to provide the UNHCR Global Data Services team with throughout knowledge,pros, cons and limitations of these tools and to enable them to choose the one bestadapted to their context.Real-time data visualization of the camp infrastructures stored in UNHCR Camp Mappingdatabase: Data source:— Reading a feature layer— Reading directly a live Database, which is updated on a regular basis through— Access to private ArcGIS Online content Data visualization:— Spatial representation of the infrastructures— Graphs, indicators, analysis, both within and outside of the map elementOther requirements taken into account include licensing, the complexity of set-up, degree of ITmaintenance required, dashboard sharing capabilities and the embedding options, possibility ofoffline use, user friendliness and the overall performance of the tool.The summary table on pages 9-11 displays and compares the types and diversity of thevisualization possibilities (including the map element, charts, tables, indicators, option to addpictures) offered by each dashboard tool.Apart from ArcGIS Maps for Power BI, all the tools featured in this benchmarking are availableon ArcGIS Online (AGOL), with the Creator and GIS Professional user types.1.ESRI tools Comparison1.1. ArcGIS Maps for Power BIMicrosoft Power BI is a cloud-based business intelligence andanalytics service. When connected to all required data sources,Power BI simplifies data evaluation and results disseminationwith scalable dashboards, interactive reports, embedded visualsand more.Documentation: https://doc.arcgis.com/en/maps-for-powerbiPower BI as a stand-alone offers a number of built-in tools for simple geographical visualisationand spatial analysis. With relevance to this document focusing on the tools offered by ESRI, itis possible to access ArcGIS content with the ArcGIS Maps for Power BI extension. Inthis document, our focus is more on the spatial possibilities offered by ArcGIS Maps for PowerBI rather than Power BI itself.Example: Visualization of Kenyan school data by ualizations-microsoft-power-bi/info@cartong.org www.cartong.orgPage 4 47
CartONG – 23 Boulevard du Musée, 73000 Chambéry – Francewww.cartong.org info@cartong.orgA) LicensingThere are two aspects to take into account here: the Power BI license (see Annex 1.1.A) andthe ArcGIS Maps for Power BI add-on license (see Annex 1.1.B).There are three levels of Power BI licenses: free, Pro or Premium, and three levels ofArcGIS Maps for Power BI license: free, or the add-on license to an existing organizationalArcGIS account.B) UNHCR requirements and technical testsAll the steps the user has to follow in order to create a dashboard with Power BI and ArcGISMaps for Power BI are described in Annex 1.1.C. These tests have been carried out to assessthe extent to which the UNHCR requirements could be achieved. These include, for example,accessing real time spatial data, and creating maps using this data. Results of these test aresummarized at the section 1.5, pages 9-11, on the summary table.C) Dashboard visualizations overviewAll the visualization possibilities in Power BI are accessible from the Visualizations panel.However, by clicking on the three dots, you will be able to search formany more options in the Power BI library and add your choices intoyour Visualization panel.Visualization types: aThere are also hundreds of additional visuals that you can download from the App Store besidesthose already available in Power BI.Overview of the possible visualization elements: Maps:Basic map (point)Choropleth map (polygons and geolocation only)Shape map (TopoJSON boundaries possibility)ArcGIS Maps for Power BI (personal basemaps, personal and public hosted layers and LivingAtlas data) Charts: bar, line, key performance indicators, stacked, multiple, grouped, curve, ribbon, area,cascade, pie, ring, treemap, gauge, funnel, scatter, bubble, waterfall, doughnut, word cloud Indicators: cards (single or multiple number) Tables: table, matrix Images and text: yes Other: R element, Python element, Q&A element, slicers (filters) Interactivity: automaticinfo@cartong.org www.cartong.orgPage 5 47
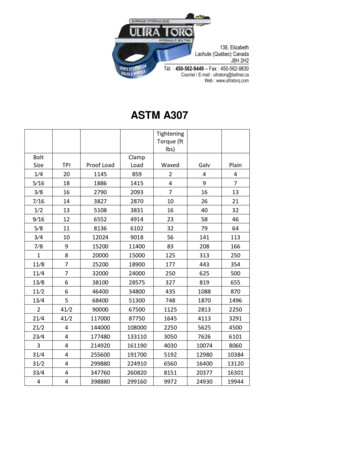
CartONG – 23 Boulevard du Musée, 73000 Chambéry – Francewww.cartong.org info@cartong.org1.2. Web AppBuilder (Dashboard theme)Web AppBuilder for ArcGIS is an intuitive application within ArcGIS Online/ArcGIS Enterprisethat allows building map-centered web apps without coding, with the use of the readily availablewidgets.Documentation: https://doc.arcgis.com/en/web-appbuilderExample: UNHCR Presence and People of Concern’s LocationsA) License Web AppBuilder (ArcGIS Online or Portal)In order to use Web AppBuilder for ArcGIS, you must havea Creator or GIS Professional user type, and privileges tocreate apps in your ArcGIS organization.Within ArcGIS Online or your ArcGIS Enterprise portal, youwill have to work from a theme that will preconfigure thelook and the type of your dashboard. You will be guidedthrough all the steps from start to finish: this includessetting up the maps, widgets, style and more. Web AppBuilderWeb AppBuilder for ArcGIS (Developer edition) requires anArcGIS for Developer subscription but allows you tocustomize your apps, themes and widgets with the useof simple coding. Likewise, this upgrade allows hostingyour apps on your own server (see 1.2).This solution is, however, more complicated to put intoaction and is likely to be rejected for its over-performancefor the UNHCR needs. Thus, in this document, we are only considering the Web AppBuilderOnline / Portal option.B) UNHCR requirements and technical testsAll the steps the user has to follow in order to create a dashboard with Web AppBuilder forArcGIS are described in Annex 1, Section 2.Results of these test are summarized at the section 1.5, pages 10-12, on the Summary table.C) Dashboard visualizations overviewWeb AppBuilder for ArcGIS offers a broad range of visualization possibilities. In Annex 1, Section2, you will find a list of the most useful and commonly used widgets to display in a dashboard.Overview of the possible visualization elements Maps: ArcGIS Online web map (fully configurable) legend Charts: "Infographics" widget (indicator, gauge, pie, bar chart, line chart, stacked chart) Indicators: Info Summary Tables: Attribute table Images and text: yesinfo@cartong.org www.cartong.orgPage 6 47
CartONG – 23 Boulevard du Musée, 73000 Chambéry – Francewww.cartong.org info@cartong.org Other: Swipe, Print, Feedback collector, Analysis tools (aggregate, calculate density, buffers,filter, find nearest, cluster, find similar, join, merge, overlay, summarize within.) Interactivity: yes1.3. ArcGIS DashboardArcGIS Dashboard (Operations Dashboard for ArcGIS up until 2020) is a platform for creating,authoring, publishing and sharing dashboards with others. This tool offers an easy user interfaceand a range of visualization options, and normally, without a requirement to know any coding.However, if required by the user, some of the visualizations can be further extended with simplecoding.Documentation: ples and useful rations-dashboard-for-arcgis-useful-linksLICENSEIn order to use ArcGIS Dashboard, you must have an organizational ArcGIS Online orEnterprise account with a Creator or GIS Professional user type.You can create dashboards from ArcGIS Online or your ArcGIS Enterprise portal.A) UNHCR requirements and technical testsAll the steps the user has to follow in order to create a dashboard with ArcGIS Dashboard aredescribed in Annex 1.3.B.B) Dashboard visualizations overviewThe different elements available within ArcGIS Dashboard are as follows:- Map: ArcGIS Online web map- Pie charts: You need to update the color of your pie chart manually since the colours are notlinked to the symbolization of the map.- Serial chart- Gauge- Indicators- Rich text- Embedded Content: images, link to web app- List: You can configure the list and choose the text you want to display for each elements.info@cartong.org www.cartong.orgPage 7 47
CartONG – 23 Boulevard du Musée, 73000 Chambéry – Francewww.cartong.org info@cartong.org- Selector: A selector (by category, by value or temporal) can only be created in a Side panelor a Header panel.There is no possibility to add tables to an operational dashboard, but you can bypass this problemby using an image of your table. However, if connected to live data, the image should bemanually updated each time there are changes in the data displayed in the table.Overview of the possible visualization elements Maps: ArcGIS Online web map (fully configurable) legend Charts: serial chart (point, line, bar), stacked chart, multi chart, gauge, text Indicators: statistical indicator, feature indicator Tables: no Images and text: text, embedded media (image or link to web apps) Other: category selector, number selector, time selector Interactivity: manual1.4. Insights for ArcGISInsights for ArcGIS is an app you access through your ArcGIS organizational account, that allowsyou to perform iterative and exploratory data analysis on various static and live datasets, withor without geography. Unlike the other tools featured in this benchmarking, this tools comeswith a built-in “Analysis View” that allows a user to explore the relationship between thedatabase and the different visualizations.Documentation: https://doc.arcgis.com/en/insightsExamples: 71e83a982c364fA) License Insights analystIf you have no plan to access other ArcGIS products, you can pay for an access to Insights only. Add Insights to an ArcGIS accountThe other paid solution is to add an Insights license to an existing Creator or GIS Professionalorganizational account (21 day of free trial).Overview: ights-overview.htm Viewer additional licenseYou can purchase an additional viewer license to ensure secure viewing of internal Insightsworkbooks.Pricing: insights/pricingB) UNHCR requirements and technical testsAll the steps the user has to follow in order to create a dashboard with Insights for for ArcGISare described in Annex 8.Results of these test are summarized at the section 1.5 Summary table (pages 9-11).info@cartong.org www.cartong.orgPage 8 47
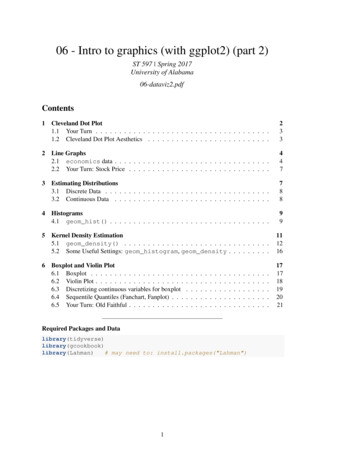
CartONG – 23 Boulevard du Musée, 73000 Chambéry – Francewww.cartong.org info@cartong.orgC) Dashboard visualizations overviewAs shown below, you can create visuals from a large choice of charts:Overview of the possible visualization elements Maps:ArcGIS Online web map (fully configurable) legendOR flat data (CSV, Shapefiles, GeoJSON): simple map (points, polygons.), choropleth. Charts: gauge, stacked, bar, column, bubble, combo, treemap, heat, point, change chart,relationship chart, scatter plot, chord diagram, link chart, box plot, donut, data clock,scatterplot. Indicators: no Tables: yes Text and images: no Other: Ability to join data, spatial analysis techniques: Calculate change, calculate ration,spatial filter, enrich data, spatial aggregation, heat map, buffer, calculate density, find nearest,create buffer, drive time, predict variable. Interactivity: automaticinfo@cartong.org www.cartong.orgPage 9 47
CartONG – 23 Boulevard du Musée, 73000 Chambéry – Francewww.cartong.org info@cartong.org1.5. Summary TableWeb AppBuilder(Dashboard theme)ArcGIS Maps for Power BILinkLicensesPlatformusedAccess toreal timedataReal timedata alertComplexity ofset upLevel of ITmantenanceArcGIS DashboardInsights for ArcGIShttps://doc.arcgis.
1. ESRI tools Comparison 1.1. ArcGIS Maps for Power BI Microsoft Power BI is a cloud-based business intelligence and analytics service. When connected to all required data sources, Power BI simplifies data evaluat