Transcription
Institute of Software TechnologyReliable Software SystemsState of the Art ofVisualization in APM ToolsAndré van HoornDušan OkanovićTutorial @ Visualizing Systems and Software Performance (VSSP)July 10, 2018. Dagstuhl, Germany
Institute of Software TechnologyReliable Software SystemsState of the Art ofVisualization in APM ToolsPart 1/2:Introduction to APMAndré van HoornDušan OkanovićTutorial @ Visualizing Systems and Software Performance (VSSP)July 10, 2018. Dagstuhl, Germany
4
5
6
Tutorial: State of the Art of Visualization in APM Tools8
“Application performance management (APM),as a core IT operations discipline, aims toachieve an adequate level of performance duringoperations. To achieve this,APM comprises methods, techniques, and tools for continuously monitoring the state of an applicationsystem and its usage, as well as for detecting, diagnosing, and resolvingperformance-related problems using the monitoreddata.”„C. Heger, A. van Hoorn, D. Okanović, M. Mann:Application performance management: State of the art and challenges for the future.In: Proc. 8th ACM/SPEC ICPE, ACM (2017)9
André van Hoorn und Stefan Siegl.Application Performance Management (APM). Continuous Monitoring of Application Performance. (in German)Order for free: 0
11
1.Collecting Data from All System Levels Agents collect data from all system levels On application level the agents are often technology-dependentWhere?What?How?12
Trace-based Metrics (Selection)What?MetricResponse TimeCPU TimeMethod NameReturn TypeLogging LevelSQL StatementError Message Okanović, D., van Hoorn, A., Heger, C., Wert, A., Siegl, S.:Towards performance tooling interoperability: An open format for representing execution traces.In: Proc. EPEW ’16. LNCS, Springer (2016)13
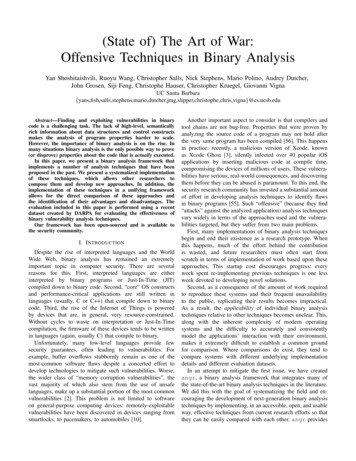
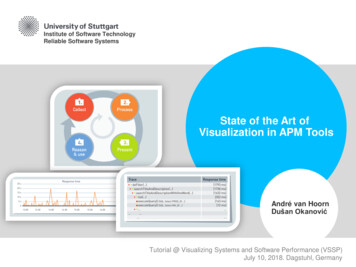
Monitoring (Measurement-based Performance plicationServer(fictional Server4.9sData AnalysisVisualizationDataRecorderTutorial: State of the Art of Visualization in APM Tools14
2.Reconstructing Information from Data Data is collected from the system represented as time series Tutorial: State of the Art of Visualization in APM Tools15
2.Reconstructing Information from Data Data is collected from the system represented as time series and as detailed execution traces, andused to support problem analysis16
3.Visualization Through Navigable Views High quantity of information has to be pre-processed It has proven useful to use different views to show the data Views are navigable and can be categorized by both scope and detail level17
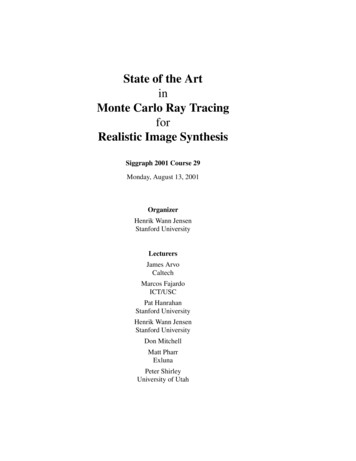
Example: Application Topology Discovery and Visualization AppDynamicsTutorial: State of the Art of Visualization in APM Tools18
4.Interpreting and Using the InformationManual or automated conclusions and actions can be derived from theinformation, e.g., Problem detection and alerting E.g., increased response times and resource utilization Detection, for instance, based on thresholds and baselines Problem diagnosis and root cause isolation E.g., N 1 problem, too many remote calls, poor DB queries Detection based on monitoring information System refactoring and adaptation E.g., auto-scaling in cloud-based architecturesTutorial: State of the Art of Visualization in APM Tools19
Institute of Software TechnologyReliable Software SystemsState of the Art ofVisualization in APM ToolsPart 2/2:Examples Visualizationsin APM ToolsAndré van HoornDušan OkanovićTutorial @ Visualizing Systems and Software Performance (VSSP)July 10, 2018. Dagstuhl, Germany
Commercial APM Tools
Magic QuadrantTutorial: State of the Art of Visualization in APM Tools22
Application Overview – DynatraceTutorial: State of the Art of Visualization in APM Tools23
Application Overview – AppDynamicsTutorial: State of the Art of Visualization in APM Tools24
Application Overview – InstanaTutorial: State of the Art of Visualization in APM Tools25
End User Monitoring – AppDynamicsTutorial: State of the Art of Visualization in APM Tools26
End User Monitoring– InstanaTutorial: State of the Art of Visualization in APM Tools27
Database Monitoring – AppDynamicsTutorial: State of the Art of Visualization in APM Tools28
Server Monitoring – AppDynamicsTutorial: State of the Art of Visualization in APM Tools
Server Monitoring – InstanaTutorial: State of the Art of Visualization in APM Tools
Problem Identification – DynatraceTutorial: State of the Art of Visualization in APM Tools31
Problem Identification - InstanaTutorial: State of the Art of Visualization in APM Tools32
Open Source APM tools
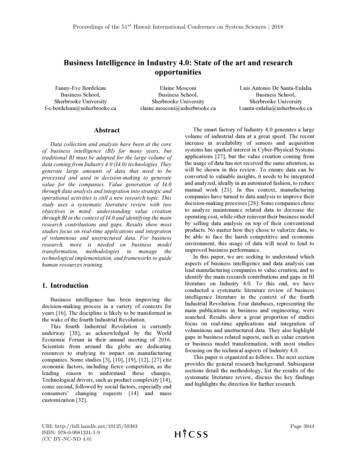
Open Source APM toolsMonitoring &Application Deep DiveLow-LevelPerformance ProfilingJRatPerformanceModelingSystem &Resources MonitoringReal User MonitoringWeb PerformanceAnalysisJMemProfTutorial: State of the Art of Visualization in APM Tools34
Dashboards – GrafanaTutorial: State of the Art of Visualization in APM Tools35
Dashboards – GrafanaTutorial: State of the Art of Visualization in APM Tools36
Dashboards – KibanaTutorial: State of the Art of Visualization in APM Tools37
Dashboards – KibanaTutorial: State of the Art of Visualization in APM Tools38
Execution Traces – inspectITTutorial: State of the Art of Visualization in APM Tools39
Tracing – ZipkinTutorial: State of the Art of Visualization in APM Tools40
Build Your Own Landscape
Dynamic Software Analysis and ApplicationPerformance Management http://kieker-monitoring.netTutorial: State of the Art of Visualization in APM Tools42
Application (and Visualization) ExamplesLegacy System Analysis(Visual Basic 6)Distributed Monitoring(Java EE/SOAP)Legacy System Analysis(COBOL)3D Visualizationof ConcurrencyTutorial: State of the Art of Visualization in APM Tools43
Conclusion Commercial tools have most fancy visulizations how useful are they really? Open-source tools are flexible and can be adapted as needed but require a lot of work to setup Thanks to a more widespread adoption of (open-source) APM, it is easierto get access to rich APM data (e.g., distributed traces) and to integratevisualization approaches (e.g., via APIs) if you know what and how to visualizeTutorial: State of the Art of Visualization in APM Tools44
Monitoring (Measurement-based Performance Evaluation) Database Server Client Browser Request Response Query Result Application Server Data Recorder 0.2s 0.3s 0.1s 3.0s 0.4s