Transcription
A Short Introduction on DataVisualizationGuoning Chen
Data is generatedeverywhere and everyday
Age of Big Data
Data in ever increasing sizes need an effective way tounderstand them
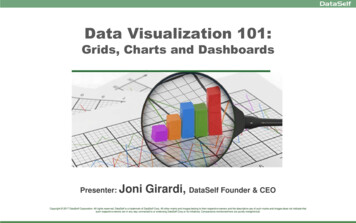
History of Visualization Visualization rather oldL. da Vinci (1452-1519) Often an intuitive step: graphical illustrationImage source: o-davinci-anatomy.html
What is Visualization? In 1987– the National Science Foundation (of the U.S.) started “Visualization inscientific computing” as a new discipline, and a panel of the ACMcoined the term “scientific visualization”– Scientific visualization, briefly defined: The use of computer graphicsfor the analysis and presentation of computed or measured scientificdata. Oxford Engl. Dict., 1989– to form a mental vision, image, or picture of (something not visible orpresent to the sight, or of an abstraction); to make visible to the mindor imagination Visualization transforms data into images that effectively andaccurately represent information about the data.– Schroeder et al. The Visualization Toolkit, 2nd ed. 1998Tool to enable a User insight into Data
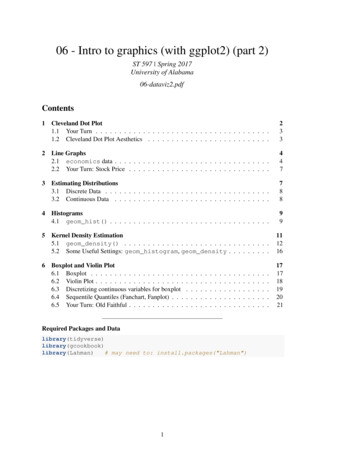
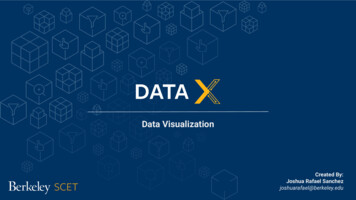
Large scale systems and eventsSource: NASATurning invisible into visible thatpeople can understand intuitivelyThe impact of the ball enteringthe porous solid from the left8
What Does Visualization Do? Three types of goals for visualization– to explore Nothing is known, Vis. used for data exploration– to analyze There are hypotheses, Vis. used for Verification or Falsification– to present “everything” known about the data, Vis. used for Communication of ResultsImage source: Google images
This is a well rich and inter-disciplinary area that combinesknowledge from various disciplines
A Visualization PipelineData are generated/collected.Data acquisitionData are processed.Data enhancementVisualization mappingRendering (ND- 2D)Data are mapped to visualprimitives, e.g. colors,geometry, etc.Images are generated.This pipeline represents only the lecturer’s opinion and need not reflect the opinions of NSF or UH!
Data Visual Analytic PipelineData are generated/collected.Data acquisitionData are pre-processed.Data pre-processingAnalysisVisualization mappingRendering (ND- 2D)Feature detectionStructure extractionStatistical analysisetc.Data are mapped to visualprimitives, e.g. colors,geometry, etc.Images are generated.This pipeline represents only the lecturer’s opinion and need not reflect the opinions of NSF or UH!
Evolution of Visualization Research From direct visualization to derived informationvisualization. From simple data to more complex ones. From represent the data with fidelity to reveal newfindings. From scientific visualization to informationvisualization, bio-visualization, geographical datavisualization, and beyond.
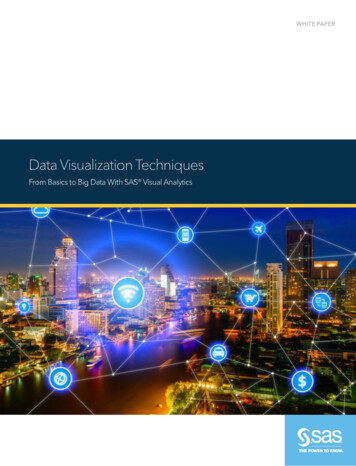
SciVis vs. InfoVis Scientific visualization is mostly concerned with:– Data defined in physical space, i.e. spatio-temporal data (2 4 dimensions)– Data describes continuous events in continuous space, however, therepresentation is discrete (i.e. sampled data)– Examples include simulation and measurement data from physics, chemistry,geo-science, medical-biological, climate, oceanography, energy, – Features are well-defined Information visualization focuses on:– high-dimensional ( 4), abstract data (i.e. tree, graphs, )– Data is discrete in the nature– Examples include financial, marketing, HR, statistical, social media, political, .– Feature are not well-defined, the typical analysis tasks including findingpatterns, clusters, voids, outliersScalarVector-valued(Bruno Jobard, Gordon Erlebacher, and M. Yousuff Hussaini)Tensor
SciVis vs. InfoVis Scientific visualization is mostly concerned with:– Data defined in physical space, i.e. spatio-temporal data (2 4 dimensions)– Data describes continuous events in continuous space, however, therepresentation is discrete (i.e. sampled data)– Examples include simulation and measurement data from physics, chemistry,geo-science, medical-biological, climate, oceanography, energy, – Features are well-definedHierarchyGraphTreeUnstructuredText Information visualization focuses on:– high-dimensional ( 4), abstract data (i.e. tree, graphs, hierarchy, )– Data is discrete in the nature– Examples include financial, marketing, HR, statistical, social media, political, .– Feature are not well-defined, the typical analysis tasks including findingpatterns, clusters, voids, outliers
Use Colors Wisely
What is Wrong with this Color Scale
Not a bad choice of color scale,but the Dynamic Range needs some work
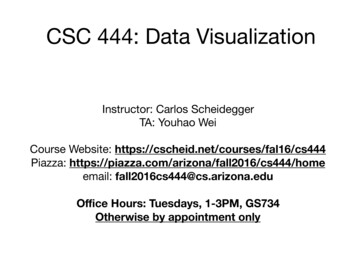
Use the Right Transfer Function Color Scaleto Represent a Range of Scalar Values Gray scaleIntensity InterpolationSaturation interpolationTwo-color interpolationRainbow scaleHeated object interpolationBlue-White-RedLowGiven any 2 colors, make it intuitively obvious whichrepresents “higher” and which represents “lower”High
Do Not Attempt to Fight Pre-EstablishedColor Meanings
Examples of Pre-Established Color MeaningsRedGreenStopOffDangerousHotHigh stressOxygenShallowMoney gen
Use good contrast as human eye is goodat difference
Color Alone Doesn’t Cut It
Luminance Contrast is Crucial
The Luminance Equation.Material from Dr. Mike Bailey, Oregon State Univ.
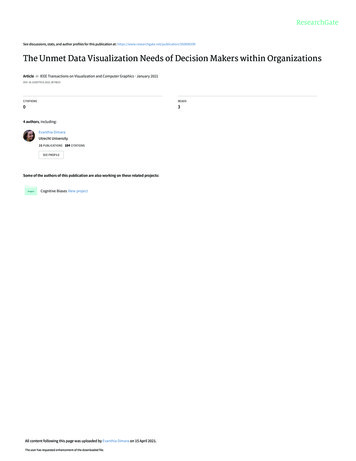
Contrast TableΔL* of about 0.40 are highlighted and recommended
Use good contrastΔL* of about 0.40 makes good contrastMaterial from Dr. Mike Bailey, Oregon State Univ.
Be Aware of the Different Color Rangeson Different Devices
Color Gamut for a Monitor and Color Slides
Other Rules Limit the total number of colors if viewers are to discern informationquickly. Be aware that our perception of color changes with: 1) surroundingcolor; 2) how close two objects are; 3) how long you have beenstaring at the color; 4)sudden changes in the color intensity. Beware of Mach Banding. Be Aware of Color Vision Deficiencies (CVD)It is not possible to list all the useful rules. They come with a lot of experience!
Beware of Color PollutionJust because you have millions of colors tochoose from
Some Principles for PlotsVisualizing Data [Cleveland 93] and Elements of Graphing Data[Cleveland 94] by William S. ClevelandThe information provided here should be considered as guidelines
Why are they all different? What is good/bad about each?
Improving the Vision Principle 1: Reduced clutter, Make data stand out– The main focus of a plot should be on the data itself, anysuperflous elements of the plot that might obscure ordistract the observer from the data needs to be removed.Which one is better?
Improving the Vision Principle 2: Use visually prominent graphical elements to show the data.– Connecting lines should never obscure points and points should not obscureeach other.– If multiple samples overlap, a representation should be chosen for theelements that emphasizes the overlap.– If multiple data sets are represented in the same plot (superposed data), theymust be visually separable.– If this is not possible due to the data itself, the data can be separated intoadjacent plots that share an axis
Improving the Vision Principle 3: Use proper scale lines and a data rectangle.– Two scale lines should be used on each axis (left and right, top andbottom) to frame to data rectangle completely.– Add margins for data– Tick-marks outs and 3-10 for each axis
Improving the Vision Principle 4: Reference lines, labels, notes, and keys.– Only use them when necessary and don’t let them obscure data.
Improving the Vision Principle 4: Reference lines, labels, notes, and keys.– Only use them when necessary and don’t let them obscure data.
Improving the Vision Principle 5: Superposed data set– Symbols should be separable and data sets should beeasily visually assembled.
Improving the Understanding Principle 1: Provide explanations and draw conclusions– A graphical representation is often the means in which a hypothesis isconfirmed or results are communicated.– Describe everything, draw attention to major features, describeconclusions
Improving the Understanding Principle 2: Use all available space.– Fill the data rectangle, only use zero if you need it
Improving the Understanding Principle 3: Align juxtaposed plots– Make sure scales match and graphs are aligned
Improving the Understanding Principle 4: Use log scales when appropriate– Used to show percentage change, multiplicative factors and skewness
Improving the Understanding Principle 5: Bank to 45– Optimize the aspect ratio of the plot
Summary of Principles Improve vision1.2.3.4.5.Reduced clutter, Make data stand outUse visually prominent graphical elementsUse proper scale lines and a data rectangleReference lines, labels, notes, and keysSuperposed data set Improve understanding1.2.3.4.5.Provide explanations and draw conclusionsUse all available spaceAlign juxtaposed plotsUse log scales when appropriateBank to 45
Data we are discussingSource: VIS, University of StuttgartScientific dataInformation data3D time (n 4)nD (n 3)Scalar/vector/tensorHeterogeneous
Visualizing Data [Cleveland 93] and Elements of Graphing Data [Cleveland 94] by William S. Cleveland Why are they all different? What is good/bad about each? Improving the Vision Principle 1: Reduced clutter, Make data stand out – The main focus of a plot should be on the data itself, any superflouselements of the plot that might obscure or distract the observer from the data .