Transcription
Munich Personal RePEc ArchiveSeven Basic Tools of Quality Control: AnAppropriate Tools for Solving QualityProblems in the OrganizationsNeyestani, BehnamMarch 2017Online at https://mpra.ub.uni-muenchen.de/77681/MPRA Paper No. 77681, posted 20 Mar 2017 16:23 UTC
1Seven Basic Tools of Quality Control:An Appropriate Tools for SolvingQuality Problems in the OrganizationsBehnam Neyestanibehnam neyestani@yahoo.comAbstract: Dr. Kaoru Ishikawa was first total quality management guru,who has been associated with the development and advocacy of using theseven quality control (QC) tools in the organizations for problem solvingand process improvements. Seven old quality control tools are a set ofthe QC tools that can be used for improving the performance of theproduction processes, from the first step of producing a product orservice to the last stage of production. So, the general purpose of thispaper was to introduce these 7 QC tools. This study found that thesetools have the significant roles to monitor, obtain, analyze data fordetecting and solving the problems of production processes, in order tofacilitate the achievement of performance excellence in the organizations.Keywords: Seven QC Tools; Check Sheet; Histogram; Pareto Analysis;Fishbone Diagram; Scatter Diagram; Flowcharts, and Control Charts.INTRODUCTIONThere are seven basic quality tools, which can assist an organization forproblem solving and process improvements. The first guru who proposedseven basic tools was Dr. Kaoru Ishikawa in 1968, by publishing a bookentitled “Gemba no QC Shuho” that was concerned managing quality throughtechniques and practices for Japanese firms. It was intended to be applied for“self-study, training of employees by foremen or in QC reading groups inJapan. It is in this book that the seven basic quality control tools were firstproposed. valuable resource when applying the seven basic tools (OmachonuNeyestani B. (2017, March). “Seven Basic Tools of Quality Control: An nizations.”https://doi.org/10.5281/zenodo.400832
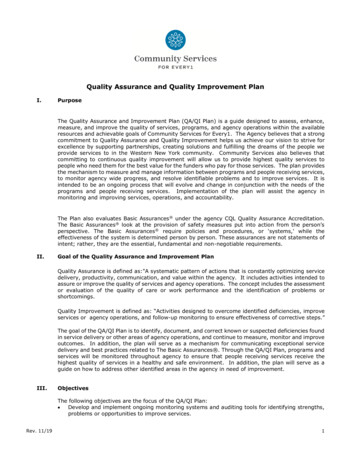
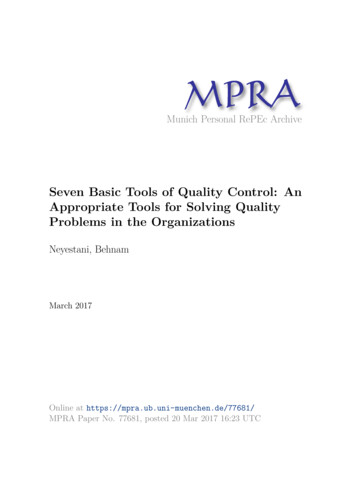
2and Ross, 2004). These seven basic quality control tools, which introduced byDr. Ishikawa, are : 1) Check sheets; 2) Graphs (Trend Analysis); 3)Histograms; 4) Pareto charts; 5) Cause-and-effect diagrams; 6) Scatterdiagrams; 7) Control charts. Figure 1 indicates the relationships among theseseven tools and their utilizations for the identification and analysis ofimprovement of quality (Kerzner, 2009).Figure 1: The seven quality control tools (Kerzner, 2009).Check SheetCheck sheets are simple forms with certain formats that can aid the userto record data in an firm systematically. Data are “collected and tabulated” onthe check sheet to record the frequency of specific events during a datacollection period. They prepare a “consistent, effective, and economicalapproach” that can be applied in the auditing of quality assurance for reviwingand to follow the steps in a particular process. Also, they help the user toarrange the data for the utilization later (Montgomery, 2009; Omachonu andRoss, 2004). The main advantages of check sheets are to be very easily toapply and understand, and it can make a clear picture of the situation andcondition of the organization. They are efficient and powerful tools to identifyfrequently problems, but they dont have effective ability to analyze thequality problem into the workplace. The chech sheets are in several, threemajor types are such asDefect-location check sheets; tally check sheets,and; defect-cause check sheets (Kerzner, 2009). Figure 2 is depicted a tallyNeyestani B. (2017, March). “Seven Basic Tools of Quality Control: An nizations.”https://doi.org/10.5281/zenodo.400832
3check sheet that cn be used for collecting data during production process.Figure 2: Check sheet (Tally) for telephone interruptionsHistogramHistogram is very useful tool to describe a sense of the frequencydistribution of observed values of a variable. It is a type of bar chart thatvisualizes both attribute and variable data of a product or process, alsoassists users to show the distribution of data and the amount of variationwithin a process. It displays the different measures of central tendency(mean, mode, and average). It should be designed properly for those workinginto the operation process can easily utilize and understand them. Also, ahistogram can be applied to investigate and identify the underlyingdistribution of the variable being explored (Omachonuand Ross, 2004;Forbes and Ahmed, 2011). Figure 3 illustrates a histogram of the frequency ofdefects in a manufacturing process.Figure 3: Histogram for variablesNeyestani B. (2017, March). “Seven Basic Tools of Quality Control: An nizations.”https://doi.org/10.5281/zenodo.400832
4Pareto AnalysisIt introduced by an Italian economist, named VilfredoPareto, whoworked with income and other unequal distributions in 19 th century, henoticed that 80% of the wealth was owned by only 20% of the population.later, Pareto principle was developed by Juran in 1950. A Pareto chart is aspecial type of histogram that can easily be apply to find and prioritize qualityproblems, conditions, or their causes of in the organization (Juran andGodfrey, 1998). On the other hand, it is a type of bar chart that shows therelative importance of variables, prioritized in descending order from left toright side of the chart. The aim of Pareto chart is to figure out the differentkind of“nonconformity” from data figures, maintenance data, repair data,parts scrap rates, or other sources. Also, Pareto chart can generate a meanfor investigating concerning quality improvement, and improving efficiency,“material waste, energy conservation, safety issues, cost reductions”, etc., asFigure 4 demonstrated concerning Pareto chart, it can able to improve theproduction before and after changes (Montgomery, 2009; Kerzner, 2009;Omachonu and Ross, 2004).Figure 4: Pareto ChartsNeyestani B. (2017, March). “Seven Basic Tools of Quality Control: An nizations.”https://doi.org/10.5281/zenodo.400832
5Fishbone DiagramKaoru Ishikawa is considered by many researchers to be the founder andfirst promoter of the ‘Fishbone’ diagram (or Cause-and-Effect Diagram) forroot cause analysis and the concept of Quality Control (QC) circles . Causeand effect diagram was developed by Dr. Kaoru Ishikawa in 1943. It has alsotwo other names that are Ishikawa diagram and fishbone because the shapeof the diagram looks like the skeleton of a fish to identify quality problemsbased on their degree of importance (Neyestani, 2017). The cause and sandanalizessystematically all the potential or real causes that result in a single effect. Onthe other hand, it is an efficient tool that equips the organization'smanagement to explore for the possible causes of a problem (Juran andGodfrey, 1998). This diagram can provide the problem-solving efforts ingacommonunderstanding of the problem, exposing gaps in existing knowledge, rankingthe most probable causes, and studying each cause” (Omachonu and Ross,2004). The generic categories of the cause and effect diagram are usually sixelements (causes) such as environment, materials, machine, measurement,man, and method, as indicated in Figure 5. Furthermore, “potential causes”can be indicated by arrows entering the main cause arrow (Neyestani, 2017).Figure 5: The cause and effect diagram (Fishbone Diagram)Neyestani B. (2017, March). “Seven Basic Tools of Quality Control: An nizations.”https://doi.org/10.5281/zenodo.400832
6Scatter DiagramScatter diagram is a powerful tool to draw the distribution of informationin two dimensions, which helps to detect and analyze a pattern relationshipsbetween two quality and compliance variables (as an independent variableand a dependent variable), and understanding if there is a relationshipbetween them, so what kind of the relationship is (Weak or strong andpositive or negative). The shape of the scatter diagram often shows thedegree and direction of relationship between two variables, and thecorrelation may reveale the causes of a problem. Scatter diagrams are veryuseful in regression modeling (Montgomery, 2009; Oakland, 2003). Thescatter diagram can indicate that there is which one of these followingcorrelation between two variables: a) Positive correlation; b) Negativecorrelation, and c) No correlation, as demonstrated in Figure 6.Figure 6: Scatter DiagramsFlowchartFlowchart presents a diagrammatic picture that indicats a series ofsymbols to describe the sequence of steps exist in an operation or process.On the other hand, a flowchart visualize a picture including the inputs,activities, decision points, and outputs for using and understanding easilyconcerning the overall objective through process. This chart as a problemsolving tool can apply methodically to detect and analyze the areas or pointsNeyestani B. (2017, March). “Seven Basic Tools of Quality Control: An nizations.”https://doi.org/10.5281/zenodo.400832
7of process may have had potential problems by “documenting” and explainingan operation, so it is very useful to find and improve quality into process(Forbes and Ahmed, 2011), as shown in Figure 7.Figure 7: Flow chart of review processControl ChartControl chart or Shewhart control chart was introduced and developedby Walter A. Shewhart in the 1920s at the Bell Telephone Laboratories, and alitymanagement(Montgomery, 2009). Control charts is a special form of “run chart that itillustrates the amount and nature of variation in the process over time”. Also,it can draw and describe what has been happning in the process. Therefore, itis very important to apply control chart, becaust it can observe and moniterprocess to study process that is in “statistical control” (No problem withquality) accordant to the samplings or samplings are betwwen UCL and LCL(upper control limit (UCL) and the lower control limit (LCL)). “statisticalcontrol” is not between UCL and LCL, so it means the process is out ofcontrol, then control can be applied to finde causes of quality problem, asNeyestani B. (2017, March). “Seven Basic Tools of Quality Control: An nizations.”https://doi.org/10.5281/zenodo.400832
8shown in Figure 8 that A point is in control and B point is out of control. Inaddition, this chart can be utilized for estimating “the parameters” and “reducing the variability” in a process (Omachonu and Ross, 2004). The mainaim ofcontrol chart is to prevent the defects in process. Itt is veryessentialiy for different businesses and industries, the reason is thatunsatisfactories products or services are more costed than spending expensesof prevention by some tools like controlcharts (Juran and Godfrey, 1998). AControl Chart is presented in the following Figure.Figure 8: The Shewhart control chartCONCLUSIONThis study identified that is very essential to apply all seven QC tools fortroubleshooting issues within production processes in the organizations.Doubtlessly, all of the aforementioned quality tools should be considered andused by management for identifying and solving quality problems duringproducing the products and services. Thus, the production processes can beaffected and improved by multiple factors of these statistical QC tools. Also,Mirko et al. (2009) designed and developed an effective layout for using theseNeyestani B. (2017, March). “Seven Basic Tools of Quality Control: An nizations.”https://doi.org/10.5281/zenodo.400832
9QC in the organizations based on the performance of them, in order to applyappropriately these quality tools for solving quality problems and qualityimprovement, as demonstrated in Figure 9. Accordingly, the following Figureinterprets how the 7 QC should be employed from firs step to end ofproduction processes for identifying the problems of quality performance andcontrolling them.Figure 9: An appropriate layout for using 7QC tools with the aim ofimproving extremely quality performance (Mirko et al., 2009)References1.Forbes, L H. & Ahmed S. M. (2011). Modern construction : lean projectdelivery and integrated practices. Boca Raton, Fly: Taylor and Francis Group.Neyestani B. (2017, March). “Seven Basic Tools of Quality Control: An nizations.”https://doi.org/10.5281/zenodo.400832
102.Juran, M., and Godfrey, A. (1998). Juran’s quality handbook (5 th ed.).Washington, DC: McGraw-Hill Companies, Inc.3.Kerzner, H. (2009). Project Management: A Systems Approach to Planning,Scheduling, and Controlling (10th ed.). Hoboken, New Jersey: John Wiley &Sons, Inc.4.Mirko S., Jelena J., Zdravko K., & Aleksandar V. (2009). Basic Quality Tools inContinuous Improvement. Journal of Mechanical Engineering, 55(5), pp. 1-9.5.Montgomery, D. C. (2009). Introduction to Statistical Quality Control (6 th ed.).Danvers, MA: John Wiley & Sons, Inc.6.Neyestani B. (2017, February). “Principles and Contributions of Total land, J. S. (2003). Total Quality Management: text with cases (3 rd ed.).Jordan Hill, Oxford, UK: Butterworth-Heinemann, an imprint of Elsevier.8.Oberlender, G. D. (2000). Project Management for EngineeringConstruction (2nd ed.). New York, USA: McGraw-Hill Companies, Inc.9.Omachonu, V. K. & Ross, J. E. (2004). Principles of total quality (3 rd ed.). BocaRaton, Florida: Taylor & Francis.andNeyestani B. (2017, March). “Seven Basic Tools of Quality Control: An Appropriat
These seven basic quality control tools, which introduced by Dr. Ishikawa, are : 1) Check sheets; 2) Graphs (Trend Analysis); 3) Histograms; 4) Pareto charts; 5) Cause-and-effect diagrams; 6) Scatter