Transcription
DATA 301Introduction to Data AnalyticsVisualizationDr. Ramon LawrenceUniversity of British Columbia Okanaganramon.lawrence@ubc.ca
DATA 301: Data Analytics (2)Why learn Visualization?Visualization allows people to understand and extract informationfaster and with more accuracy than displaying text and numbers.A good visualization makes data more understandable and reachableto more people.High quality visualization encourages confidence in the data analysisand inspires people to utilize the data more effectively.
DATA 301: Data Analytics (3)What is Data Visualization? What is Tableau?Data visualization is the creation and presentation of visualrepresentations of data with the goal to communicate informationclearly and efficiently. Data visualizations include graphs, charts, images, plots, and tables. Data visualization is both an art and a science as it relies on both scientific dataanalysis and techniques as well as artistic creativity and presentation.Tableau is a software package designed to make data visualizationeasy for non-expert users.
DATA 301: Data Analytics (4)Data Visualization with Previous ToolsWe have seen data visualization in a variety of other tools includingExcel, Python charts, and R.A data visualization package is selected based on its ability toeffectively communicate the information to end users and thesimplicity in creating the visualizations.There is no one perfect software package for data visualization as youmust trade-off experience, time, and appearance.
DATA 301: Data Analytics (5)Data Visualization in ExcelCharts including pivot charts, spark lines, and visual formatting of cells
DATA 301: Data Analytics (6)Data Visualization in PythonVariety of charting libraries including matplotlib and ggplot
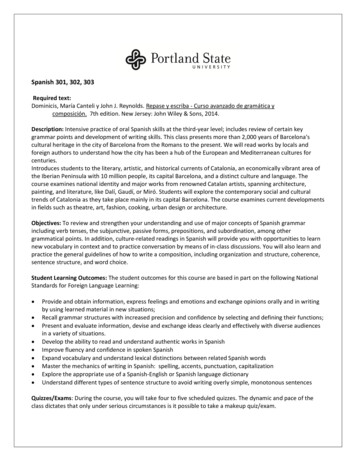
DATA 301: Data Analytics (7)Data Visualization in R - Qualitative DataQualitative data: bar chart, frequency table, pie chartFrequency Table
DATA 301: Data Analytics (8)Data Visualization in R - Quantitative DataQuantitative data: histogram, box plot, ECDF
DATA 301: Data Analytics (9)Data Visualization in GISMaps of coordinates with overlays (markers, points, lines, regions)
DATA 301: Data Analytics (10)Types of DataData can be considered of three types: 1) Known data - monitoring and regular reporting data for visibility 2) Data You Know You Need - for understanding outliers or trends in the knowndata and deciding on how to act on them 3) Data You Need but Do Not Know It - information that you would have notthought about but knowing it would be very valuable (data to discover!)Visual analytics helps with all three types of data, but especially thelast two to understand trends and discover important information.
DATA 301: Data Analytics (11)Introduction to TableauTableau (http://www.tableau.com/) was founded in 2003 as a spin-off fromStanford University by Chris Stolte, Christian Chabot and Pat Hanrahan. 2015 revenue was over 650 million with over 3000 employeesThe goal of Tableau is "to help people see and understand their data."- Christian Chabot, Tableau CEOTableau has desktop and server (enterprise) products as well asTableau Public allowing sharing of data sets.
DATA 301: Data Analytics (12)Tableau - Home Page
DATA 301: Data Analytics (13)Tableau Workspace
DATA 301: Data Analytics (14)Tableau FeaturesSupported data types: text, dates, numbers, geographical coordinates(latitude/longitude), BooleanAggregation functions: sum, average, max, count, variance, etc.Many built-in functions for numeric and string manipulation.Calculated fields can be created and are proceeded by an .
DATA 301: Data Analytics (15)Tableau TerminologyA pill is a dimension, attribute, or measure that can be placed in thevisualization. Blue pills are discrete. Green pills are continuous.A shelf is a location to put a pill. Column shelf, row shelf, filter shelf Row and column shelves are similar to Pivot tables in Excel but with built-invisualization.
DATA 301: Data Analytics (16)Tableau Workspace ItemsFiltersshelfColumns shelfRows shelfShow Mehelps asuresshelfParametersshelfNew worksheet/dashboard
DATA 301: Data Analytics (17)View CardsView or shape cards allows control of color, shape, and size. They alsoenable filtering, labeling, and ability to add details on demand. Color—expresses discrete or continuous valuesSize—expresses discrete or continuous valuesLabel—one or more fields can be expressed as label on marksDetail—disaggregates the marks plottedTooltip/tooltips—makes fields available to tooltips without disaggregating dataShape—expresses discrete or continuous fieldsMultiple fields can be placed on the color, label, detail, and tooltipbuttons.
DATA 301: Data Analytics (18)Show Me ButtonThe Show Me button suggests visualization to use based on yourcurrent dimensions and measures.It will also place pills on shelves automatically.
DATA 301: Data Analytics (19)Tableau Visualization: Show Me
DATA 301: Data Analytics (20)Tableau QuestionQuestion: How many of the following statements are TRUE?1) In Tableau blue pills are continuous.2) The View Cards interface allows for changing color and size of features inthe visualization.3) A shelf is a location to place a pill.4) The Show Me button will suggest visualizations for you.5) A pill for a dimension may be on more than one shelf at the same time.A) 0B) 1C) 2D) 3E) 4
DATA 301: Data Analytics (21)Try it: Tableau Visualizations1) Install Tableau. Use trial version or student license provided inConnect.2) Start Tableau. Use the sample.twbx file or the Superstore exampleand explore the visualizations.3) Try create any visualization of the data.
DATA 301: Data Analytics (22)Tableau - Data SourcesTableau can connect to a wide variety of data sources including: Microsoft Excel and AccessText files (txt, csv)Relational databases (MySQL, SQL Server, Oracle, PostgreSQL)NoSQL databases (MongoDB)Parallel and analytical databases (Greenplum, Vertica, Teradata)Other ODBC sources (note JDBC is not supported)A sample data source called Superstore is available in theTableau/defaults/Datasources directory. File: Sample - Superstore.tds (Tableau Data Source) or File: Sample - Superstore.xls (Excel file)
DATA 301: Data Analytics (23)Example Connecting to ExcelSelect Excel file and then pick sheets.
DATA 301: Data Analytics (24)Example Connecting to MySQLConnecting to a relational database like MySQL requires: 1) Driver (often need to download from database vendor) https://www.tableau.com/support/drivers 2) Database connection information
DATA 301: Data Analytics (25)Example Connecting to MySQL (2)
DATA 301: Data Analytics (26)Connect or Extract DataTableau has its own internal data engine. There are two options whenretrieving data to visualize:1) Direct connect to source to get live data Can refresh data using F5 or selecting refresh menu item May be faster depending on data set/visualization2) Extract and import data into Tableau's data engine May get a performance improvement as data is localMay set certain times to extractPortability (as consumer of report does not need access to data source)Support for functions not supported by source (e.g. Excel)
DATA 301: Data Analytics (27)Tableau Data Sources QuestionQuestion: How many of the following statements are TRUE?1) Tableau can connect to many relational databases.2) Tableau can process data in text and Excel files.3) Tableau can either leave data in data source or extract it locally.4) Tableau can connect to data sources using JDBC.5) Tableau will try to identify types and relationships from the data sources.A) 0B) 1C) 2D) 3E) 4
DATA 301: Data Analytics (28)Try it: Tableau Data SourcesUse Tableau to connect to Excel and MySQL data sources. Start Tableau. Open up Superstore Excel data source (either XLS or TDS file) inTableau/defaults/Datasources directory. Install the MySQL ODBC connector c/ Server: cosc304.ok.ubc.ca Database: data301 User: data301 Password: ubcSuperstore visualizations: Map showing profit by state. Visualization to indicate what is the best selling product category per store.WorksOn visualizations: Visualize the number of projects, employees, and hours worked per department. Visualize employee ages to see if age impacts if they are supervisors.
DATA 301: Data Analytics (29)Tableau FilesTableau Workbook (.twb) (default) - saves workbook but no dataTableau Packaged Workbook (.twbx) - contains data and visualizationfor easier sharingTableau Datasource (.tds) - metadata on a data sourceTableau Bookmark (.twb) - one worksheet within workbookTableau Data Extract (.tde) - compressed snapshot of data stored incolumn formatNote similarities with Excel/spreadsheet terminology.
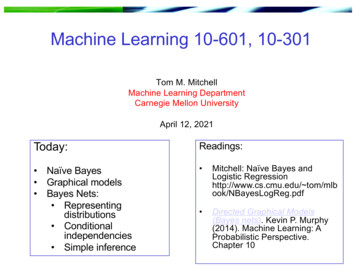
DATA 301: Data Analytics (30)Joining TablesWhen connecting tables R and S, there are four types of joins: INNER JOIN - row in result for each row of R that matches a row of S LEFT OUTER JOIN - row in result for each row of R that matches a row of S OR arow of R that does not match anything in S RIGHT OUTER JOIN - row in result for each row of R that matches a row of S OR arow of S that does not match anything in R FULL OUTER JOIN - row in result for each row of R that matches a row of S OR arow of R that does not match anything in S OR a row of S that does not matchanything in R
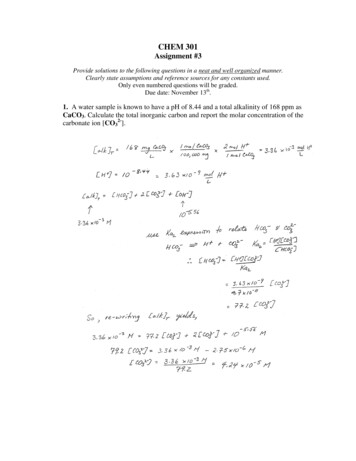
DATA 301: Data Analytics (31)Join ExampleBoysBid neSarahFranJulieBoys INNER JOIN GirlsBid BoyName Gid GirlName2Steve2Jane5James5FranBoys FULL OUTER JOIN GirlsBid BoyName Gid eBoys LEFT OUTER JOIN GirlsBid BoyName Gid GirlName1Joe2Steve2Jane3Fred5James5FranBoys RIGHT OUTER JOIN GirlsBid BoyName Gid GirlName2Steve2Jane4Sarah5James5Fran6Julie
DATA 301: Data Analytics (32)Join QuestionQuestion: Given these tables, how many rows are in the result of Boys LEFTOUTER JOIN Girls ON Bid Gid?BoysBid BoyName1Joe1Steve3Fred5James7Ben7BishopA) 9B) 8Gid1156C) 7GirlsGirlNameJaneSarahFranJulieD) 6E) 0
DATA 301: Data Analytics (33)Data BlendingData blending allows "joining" data that does not reside in a singlesource. There are automatic and manual methods. Automatic - field names must match across sources. Will link secondary datasource with primary data source. Manual methods include ability to specify SQL statement to perform with join.
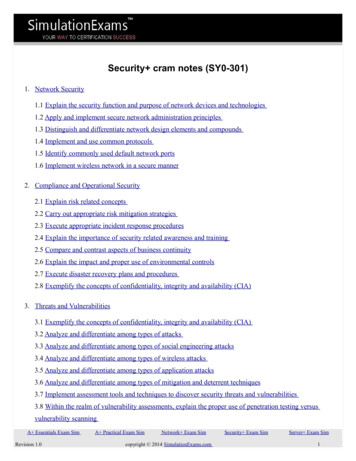
DATA 301: Data Analytics (34)Try it: Tableau Data Sources - JoinsUsing the MySQL tables in the data301 database, create some joins toconnect them so it looks like this:Create a visualization with this data set.
DATA 301: Data Analytics (35)Dynamic Grouping/RenamingDynamic grouping (also called ad hoc groups) can be created by usingCtrl Select to select elements in visualization and select Group frommenu.It is also possible to rename values/labels and correct value errors.
DATA 301: Data Analytics (36)Geographic DataFor geographic data (small globe icon), Tableau automaticallygenerates center-point geocodes (longitude/latitude).
DATA 301: Data Analytics (37)Tableau Chart TypesChart types:- text tables/crosstabs- maps- heat maps, highlight tables, tree maps- line charts- area fill charts and pie charts- scatter plot, circle view, side-by-side plots (identify outliers)- bullet graph, packed bubble, histogram, Gantt charts
DATA 301: Data Analytics (38)Line Chart (discrete time)
DATA 301: Data Analytics (39)Text Table (Crosstab)
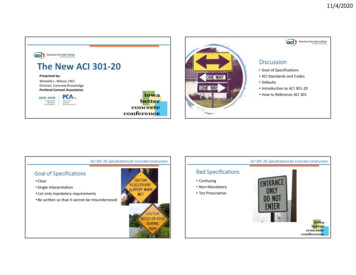
DATA 301: Data Analytics (40)Maps
DATA 301: Data Analytics (41)Heat Map
DATA 301: Data Analytics (42)Tree map
DATA 301: Data Analytics (43)Bar Charts
DATA 301: Data Analytics (44)Pie Charts
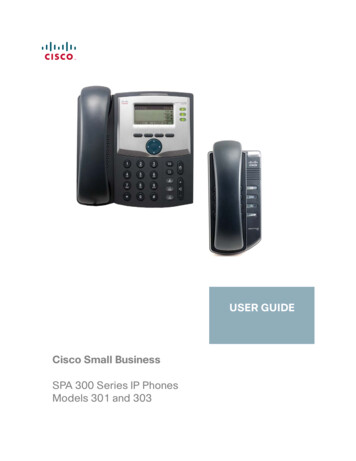
DATA 301: Data Analytics (45)Scatter Plots
DATA 301: Data Analytics (46)Trend Lines and Reference LinesTrend lines show patterns in data using a line of best fit.Reference lines allow comparison with a reference (detect trends andoutliers).
DATA 301: Data Analytics (47)Adding Trend Lines
DATA 301: Data Analytics (48)Trend Lines and Reference Lines
DATA 301: Data Analytics (49)Adding Quantiles
DATA 301: Data Analytics (50)Sorting
DATA 301: Data Analytics (51)HierarchiesHierarchies are groupings of data that make it easier to roll-up anddrill-down into data.Examples: category and subcategory year, quarter, month country, state, cityCan create own hierarchies by dragging dimensions on top of eachother.
DATA 301: Data Analytics (52)FiltersThere are multiple ways to define filters:1) Drag dimension into filter shelf2) Quick filters allow people using report to change filters dynamically.(click on item in filter shelf and select Show Filter option)
DATA 301: Data Analytics (53)GroupingGrouping allows summarizing data without using a hierarchy. Multi-select elements then in pop-up menu select Group
DATA 301: Data Analytics (54)CalculationsCalculated fields are performed on data source when possible.Table calculations are performed locally in Tableau.
DATA 301: Data Analytics (55)Creating a Calculated Field
DATA 301: Data Analytics (56)ParametersCalculations may have parameters.Parameters may be exposed in the visualization so the user can controlthem.
DATA 301: Data Analytics (57)ForecastingRight click, select Forecast then Show Forecast.
DATA 301: Data Analytics (58)Tableau Charts QuestionQuestion: How many of the following statements are TRUE?1) There can only be one pill on the row shelf.2) A trend line can only be linear.3) A user can group multiple items into a group in the visualization.4) Calculated fields are calculated on the data source if possible.5) Filters may be exposed to the user of the visualization just like parameters.A) 0B) 1C) 2D) 3E) 4
DATA 301: Data Analytics (59)Try it: Tableau ChartsUsing the Superstore data set, create a visualization for each of thesechart types: line chart (with forecast and trend line)bar chart (with filters and sorting)pie chart (with a parameter)heat map (with grouping)scatter plot (with a calculated field)histogramcircle view
DATA 301: Data Analytics (60)DashboardsA dashboard consists of multiple sheets organized to makeinformation and its relationships more understandable.Tableau recommendation: 4-pane dashboard designs
DATA 301: Data Analytics (61)Dashboard Starter View
DATA 301: Data Analytics (62)Dashboard Populated with Worksheets
DATA 301: Data Analytics (63)Try it: Tableau DashboardUsing the Superstore data set, create your own dashboard withmultiple visualizations.
DATA 301: Data Analytics (64)ConclusionTableau is a software system for visualizing data sets from multiplesources using a wide-range of visualization techniques. line charts, bar charts, scatter plots, heat maps, pie charts, histogramsVisualization of data sets is critical for communicating meaning andunderstanding, especially for people with less understanding of thedata set.
DATA 301: Data Analytics (65)Objectives Explain the purpose of visualizationList different types of visualizations available in Excel, Python, R, GISList the three "types of data"Define: pill, shelf, view card (as used in Tableau)Explain the purpose of the Show Me buttonBe able to connect to Excel and relational databases using TableauCompare/contrast connecting to versus extracting data with TableauList and explain the different Tableau file typesDefine and compute: inner join, left outer join, right outer join, full outer joinUse dynamic grouping and renaming to clean and correct data values in avisualization
DATA 301: Data Analytics (66)Objectives (2) List and use the different Tableau chart types: text tables, maps, heat maps, treemaps, line charts, pie charts, area charts, scatter plot, circle view, histogram,Gantt charts Add trend lines, references lines, quantiles to a visualization Create and use hierarchies Create and use filters Create calculated fields Use parameters to allow user-controlled visualizations Add forecasts to a visualization Organize visualizations into a dashboard
1) Tableau can connect to many relational databases. 2) Tableau can process data in text and Excel files. 3) Tableau can either leave data in data source or extract it locally. 4) Tableau can connect to data sources using JDBC. 5) Tableau will try to identify types and relationships from the