Transcription
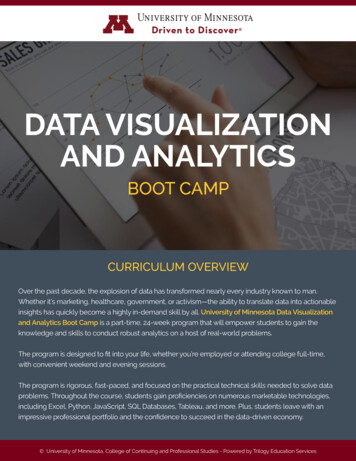
DATA VISUALIZATIONAND ANALYTICSBOOT CAMPCURRICULUM OVERVIEWOver the past decade, the explosion of data has transformed nearly every industry known to man.Whether it’s marketing, healthcare, government, or activism—the ability to translate data into actionableinsights has quickly become a highly in-demand skill by all. University of Minnesota Data Visualizationand Analytics Boot Camp is a part-time, 24-week program that will empower students to gain theknowledge and skills to conduct robust analytics on a host of real-world problems.The program is designed to fit into your life, whether you’re employed or attending college full-time,with convenient weekend and evening sessions.The program is rigorous, fast-paced, and focused on the practical technical skills needed to solve dataproblems. Throughout the course, students gain proficiencies on numerous marketable technologies,including Excel, Python, JavaScript, SQL Databases, Tableau, and more. Plus, students leave with animpressive professional portfolio and the confidence to succeed in the data-driven economy. Universityof Minnesota,Collegeof Continuingand EducationProfessionalStudies University of Minnesota, College of Continuingand ProfessionalStudies- Poweredby TrilogyServicesPowered by Trilogy Education Services1
Is This Program RIGHT FOR YOU?Are you a creative, curious, and ambitious professional looking to join the datarevolution? If so--or if any of the following describes your situation--enrolling in our DataVisualization and Analytics Boot Camp could be a smart career move:You are currently a professional working with data, but are looking to advance yourcareer by building technical skills.You are a manager or professional in a business where data can be used to boostyour company’s bottom line.You have interests in visualizing social, consumer, or popular trends.You are looking to enter a new field in healthcare, government, or media and arelooking for a way to jump in.You are a full-time student, hungry to learn more and expand your skill set. University of Minnesota, College of Continuing and Professional StudiesPowered by Trilogy Education Services1
THE SKILLS You’ll GainYou will graduate with skills in Data Visualization and Analytics, including:*Advanced ExcelFront-End Web Visualization Pivot Tables HTML VBA Scripting CSS Bootstrap Dashboarding JavaScript ChartingFundamental Statistics Modelling D3.js Forecasting Geomapping with Leaflet.jsPython ProgrammingBusiness Intelligence Software Python 3 Matplotlib NumPy API Interactions Pandas Social MediaMining Advanced Topics MySQL MongoDBBig Data Analyticswith HadoopDatabases Tableau Machine Learning* Note: These topics are subject to change based on local market demand and the input of hiring partners. University of Minnesota, College of Continuing and Professional StudiesPowered by Trilogy Education Services2
BUILDING On The BasicsFor those first entering the field of Data Analytics, knowing where to start can bea daunting task. That’s why our curriculum is designed to provide you with a deepfoundation on the core technical skills needed to succeed in the field. Throughout theprogram, expect to learn brand new skills and be challenged in completing difficultreal-world problems to demonstrate your new abilities. By the program’s end, you willhave a strong professional portfolio showcasing your work. University of Minnesota, College of Continuing and Professional StudiesPowered by Trilogy Education Services3
Real Projects, REAL JOBSOur graduates will be qualified for many different roles, including:Data AnalystSystems EngineerData EngineerDatabase AdministratorData ScientistBig Data EngineerData JournalistBusiness Intelligence AnalystBusiness AnalystResearch AnalystSQL DeveloperSoftware Engineer University of Minnesota, College of Continuing and Professional StudiesPowered by Trilogy Education Services4
What You Will LEARNBy the time you graduate, you can expect to be able to:Employ statistical analysis to model, predict, andUse advanced SQL and Mongo techniques toforecast trendscombine multiple datasets into one so as to createeven more impressive and comprehensive databasesExpertly build VBA scripts in Excel to automateCreate basic interactive websites and applications totedious manual processesshow your work to the entire worldUtilize real-world data sources to showcase social,Work with and lead small-scale teams in order tofinancial, and political phenomenacreate applications and visual datasetsCreate Python-based scripts to automate the cleanup,re-structuring, and rendering of large, heterogeneousScrape information from web pages in order to collectdatasetsdata from a wide variety of online sourcesInteract with RESTful APIs using Python Requests andCommunicate and glean new business insights usingJSON parsing techniquesenterprise-grade tools like TableauCreate in-depth graphs, charts, and tables utilizing aAnalyze social media trends on Twitter and Facebookwide-variety of data-driven programming languagesusing automated programsand librariesUse geographic data to create visually exciting,interactive, and informative mapsBuild custom interactive data visualizations usingD3.js and other JavaScript librariesWork independently or in a group on complex datamining projectsUnderstand the basics of troubleshooting andenhancing legacy codeWrite SQL commands to perform Create, Read,Update, and Delete commands University of Minnesota, College of Continuing and Professional StudiesPowered by Trilogy Education Services5
Course STRUCTUREOver the course of 24 weeks, you’ll attend informative lectures, participate in a variety ofindividual and team exercises, and work independently in the classroom and at home.Homework assignments provide an opportunity to apply what you’ve learned and build onit. The goal is to give you a comprehensive learning experience and true insight into a “dayin the life” of a data professional.DISCUSSIONPROJECT WORKPORTFOLIO PROJECTSInstructor-led discussions cover theYou’ll work on timed in-classYour portfolio signals to employersbackground, history, and use newexercises and projects individuallythat you are ready for primetime!technologies or concepts.and in teams to put classroomYou’ll build a substantial portfolioteachings into practice.of projects that demonstrate yourabilities across a wide variety oftechnologies. University of Minnesota, College of Continuing and Professional StudiesPowered by Trilogy Education Services6
We’re Here TO HELPAs you move up the learning curve, you’re likely to have questions around some of theconcepts covered in class. We’re here to help—through in-person and virtual office hours, aswell as a dedicated #slack channel where you can get assistance from instructors, supportstaff and your fellow students. All work is done via Github, so you can create issues directlyon your own projects for instructors to assist you in a truly asynchronous fashion. In additionto learning to code, you will have access to career services that will help you prepare fortechnical roles after graduation such as:Career Content and Practice SessionsCareer CoachingProjects Supported by IndustryHigh Impact Career EventsDatabase of Customizable Tools andTemplatesSoft Skills Training Multiple Technical Resume Templates Github Best Practices Guidelines To Building A Portfolio Creating an Elevator Pitch Developing a BioOnline Career Events With IndustryProfessionalsOne-on-One Career Coaching Assist In Targeting Job Search Continued Interview PreparationFrequent Program Enhancements Drivenby Industry Professionals University of Minnesota, College of Continuing and Professional StudiesPowered by Trilogy Education Services7
Building YOUR PORTFOLIOIt’s a fact: companies care about what you can do, not what you say you can do. Forthat reason, our curriculum teaches you how to put what you’ve learned to work.We cover real-world data projects, ranging from visualizing bike sharing data in NewYork City to mapping worldwide earthquakes in real-time. University of Minnesota, College of Continuing and Professional StudiesPowered by Trilogy Education Services8
Building YOUR PORTFOLIOBank DesertsSkills NeededSocial economists have long noted a trend thatin geographic areas with higher poverty rates,there is often a dearth of reputable banks orfinancial services. The shortage leads to higher Python Google Places Pandas Matplotlib Google Maps APIsrates of financial victimization in these areas.But how could we show this trend using data?In this activity, you’ll learn how to combine datafrom the US Census, Google Maps, and GooglePlaces to visualize the relationship betweenObjectives Utilize the Python Requests library to makehundreds of API calls to the US Census and GoogleMaps datasets. Utilize the Python pandas library to organizethe retrieved information by zip code andsocioeconomic factors. Build scatter plots to easily communicate theBanking Desert phenomenavarious socioeconomic factors and the numberof banks in a given zip code.Earthquake HistorySkills NeededData isn’t just about finance and numbers. It canalso be used for good as well. In this activity,you will create an interactive visualization ofhistoric earthquakes over time using Leaflet. HTML Leaflet.js CSS APIs Javascript JSONjs, a popular JavaScript geo-mapping library.Your final application will provide a near-livefeed of global earthquakes and their relativemagnitudesObjectives Harness the power of APIs and JSON to gatherearthquake data from USGS datasets Utilize Leaflet.js library to create visuallycompelling,animated maps Embed the created map onto a live web pageusing HTML and CSS University of Minnesota, College of Continuing and Professional StudiesPowered by Trilogy Education Services9
PORTFOLIO continued.Web Scraping ApplicationSkills NeededSometimes, data is just out of reach. Whetherit’s a social media website that is guardingits information, a government agency thathas poorly organized records, or a cookbook Python CSS Beautiful Soup MongoDB HTMLwebsite filled with secret recipes -- data isn’talways accessible by external applications.This is where data scraping comes in. UtilizingObjectivesPython libraries like Beautiful Soup, you willlearn to convert data straight from raw HTML Scrape your favorite social media website forotherwise inaccessible data Parse through the retrieved information and store itinto a MongoDB database Create new representations of the data usingHTML and CSSinto a queryable and storable form, opening uptroves of data for your future applications.Data Journalism and D3Skills UsedIn this activity, you will be taking on the role of a JavaScript and the D3 Library HTML/CSSrun a series of feature stories about the health Bootstraprisks facing particular demographics in the Microsoft Exceldata visualization specialist working for a majormetropolitan newspaper. Your editor wants toUnited States. Using the latest informationfrom two government databases and the D3JavaScript library, you will be creating chartsand interactive graphs for this importantObjectivesnews article. Collect data from two government databases Store the data within a series of .CSV files Create fully interactive graphs that alter withbutton-clicks Place all of your information into a mobileresponsive webpage University of Minnesota, College of Continuing and Professional StudiesPowered by Trilogy Education Services10
PORTFOLIO continued.Game Studio AnalyticsSkills UsedCongratulations! You have landed a job asthe Lead Analyst for an independent game Pythoncompany and for your first assignment you Jupyter Notebookhave been given the difficult task of analyzing Pandas Librarydata and creating a report for their latestsmash hit release. You will be using the PythonPandas Library and Jupyter Notebook to createdemographic and financial reports.Objectives Use Python and the Pandas library to create areport containing a vast amount of data Make the data viewable using Jupyter Notebook Find, analyze, and write up descriptions ofobservable trends in the dataPlotBot5Twitter bots are all the rage these days and,for this assignment, you will be creating aninteractive Twitter bot of your very own. ThisTwitter bot will receive tweets via mentionsand then perform “sentiment analysis” on thefirst Twitter account specified in the mention. Aplot of data will then be tweeted out from thePlotBot5 Twitter feed.Skills Needed Python Pandas VADER (SentimentAnalysis) Matplotlib Heroku Tweepy (Twitter)Objectives Create your own fully-interactive Twitter bot and tobe run off of Heroku Perform sentiment analysis on Twitter accountsusing VADER and Tweepy Parse, store, and post to the web on call University of Minnesota, College of Continuing and Professional StudiesPowered by Trilogy Education Services11
COURSE CURRICULUM By ModuleModuleModule 1:Excel Crash Course(Weeks 1-2)Module 2:Python Data Analytics(Weeks 3-9)Module 3:Databases(Weeks 10-12)Module 4:Web Visualization(Weeks 13-19)Module 5:Advanced TopicsDescriptionLearn to do more with Microsoft Excel. In this modulewe’ll cover advanced topics like statistical modeling,forecasting and prediction, pivot tables, and VBAscripting. You’ll even learn to model historic stocktrends -- and hopefully, learn to beat the market!»»Microsoft Excel»»VBA Script»»Statistics ModelingGain a strong foothold in one of today’s fundamentalprogramming languages. In the course of this module,you’ll gain deep proficiencies with core Python, dataanalytic tools like NumPy, Pandas, Matplotlib, andspecific libraries for interacting with web data likeRequests, BeautifulSoup, and as»»Matplotlib»»Beautiful fletBy program’s end, you’ll be immersed in new andin-demand topics like Tableau, Hadoop, and MachineLearning.»»Tableau»»Hadoop»»Machine LearningBring everything that you
If so--or if any of the following describes your situation--enrolling in our Data Visualization and Analytics Boot Camp could be a smart career move: You are currently a professional working with data, but are looking to advance your career by building technical skills. You are a manager or professional in a business where data can be used to boost