Transcription
CSC 444: Data VisualizationInstructor: Carlos ScheideggerTA: Youhao WeiCourse Website: https://cscheid.net/courses/fal16/cs444Piazza: l: fall2016cs444@cs.arizona.eduOffice Hours: Tuesdays, 1-3PM, GS734Otherwise by appointment only
Before we start Read the syllabus: tml Many small programming assignments (50%), one midterm (20%),one final (30%)First assignment has been posted! https://cscheid.net/courses/fal16/cs444/assignment 1.html
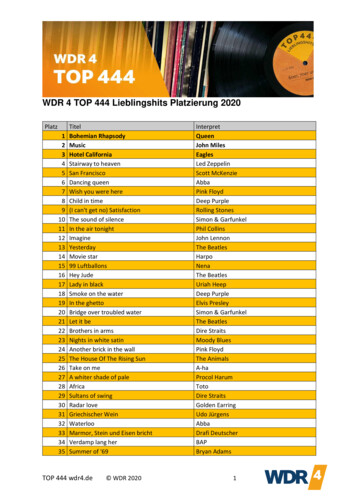
Vis is bothubiquitous andsubtle Frank Anscombe,“Graphs in StatisticalAnalysis”
Activity: let’s try to makesense of this data Think about what you’d try, 1 minute Gather in small groups, talk Share with everyone
What did we try? ecture1/anscombe/
Something interestingjust happened: isn’t this avisualization too?!
The way in which data ispresented changes howwe consume it, drastically.
You will learn how — andhow not — to buildinteractive data visualizations
Three main themesMechanics: how do I build a visualization? Javascript, CSS, HTML, d3Principles: why should I build it in this way? mathematical and perceptual argumentsTechniques: how do I turn principles and mechanicsinto an actual visualization? algorithms, software libraries
AssessmentOne small assignment per week, 50% weight 2 hours per assignmentOne closed-book midterm, 20% weight hour-long One closed-book final, comprehensive exam, 30% weight Class participation, 5% weight piazza counts
GradingPerformance grade: 90%: A, 80%: B, 70%: C, 60%: D, 50%: F
Plagiarism and AcademicConduct Policy Unless I state otherwise, you are allowed to use any open sourcelibrary you want in your projects, provided that you give it credit. If you pass off someone else’s work as yours, that’s plagiarism. Assignments will be smallThe penalty for plagiarism always includes a referral to thecollege, and ranges from an automatic zero in the assignment toan automatic F in the course to expulsion from the university.Don’t do it. Don’t do it.
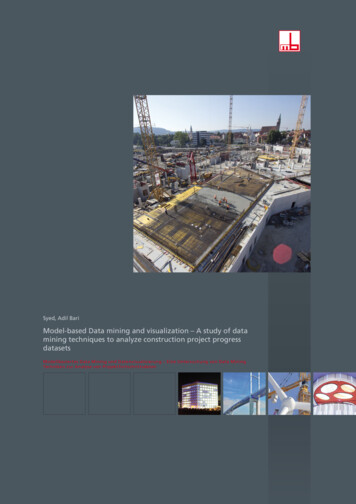
Textbook No required textbook, but you won’t regret buyingMunzner’s “Visualization Analysis and Design” All required readingmaterial will be given inlecture notes, webpages,and research -Design-AK-Peters/dp/1466508914
Textbook You will also probably make good use of ScottMurray’s “Interactive Visualization for the Web” Full version available online for free! 5/index.html
Important Vis Books William Cleveland, The Elements of Graphing Data,Visualizing Data John W. Tukey, Exploratory Data Analysis Jacques Bertin, Semiology of Graphics Edward Tufte, The Visual Display of Quantitative Information,Visual Explanations, Envisioning Information Colin Ware, Information Visualization Come take a look at them during office hours if you’re curious;they’re not cheap :(
MechanicsWriting programs: we will use the web technologystack Javascript, SVG, CSS, HTML, d3
g
Stick with it, though!http://bl.ocks.org/mbostock
Good reasons to choosethe web stack:It’s easy to talk to a serverIt’s ��s fast!
PrinciplesBuilding a visualization is fundamentally abouttradeoffs. Principles help us understand thesetradeoffs, and make informed decisions
Pre-attentiveProcessingExamples from Christopher Healey’s excellent Demo: ecture1/boundary/
Change Blindness(photosensitive epilepsy? please look away.)
http://www.csc.ncsu.edu/faculty/healey/PP/
Respect the math inthe dataNot everything you can do with data makes sense
add-up#notes
l#notes
http://imgur.com/gNefvUG/
TechniquesHow do we turn the mechanics and principlesinto an actual, working visualization?
Linked viewsdemo: http://square.github.io/crossfilter/
Treemapsdemo: GrandPerspective
A tour of visualizationand visual tures/week1.html
CS 444/544 Summary 4 weeks of mechanics, 5 weeks of principles, 6weeks of techniques 1 small assignment a week, 1 midterm, 1 projectCourse website: http://cscheid.net/courses/fal16/cs444Today’s tures/week1.html
William Cleveland, The Elements of Graphing Data, Visualizing Data John W. Tukey, Exploratory Data Analysis Jacques Bertin, Semiology of Graphics Edward Tufte, The Visual Display of Quantitative Information, Visual Explanations, Envisioning Information Colin Ware, Information Visualization Come take a look at them during office hours if you’re curious; they’re not .