Transcription
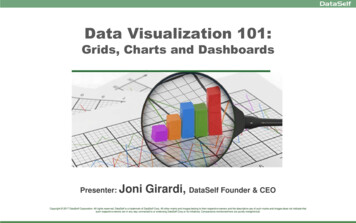
Data Visualization 101:Grids, Charts and DashboardsPresenter: JoniGirardi, DataSelf Founder & CEOCopyright 2017 DataSelf Corporation. All rights reserved. DataSelf is a trademark of DataSelf Corp. All other marks and images belong to their respective owners and the descriptive use of such marks and images does not indicate thatsuch respective owners are in any way connected to or endorsing DataSelf Corp or its initiatives. Comparisons mentioned here are purely metaphorical.
AgendaDesign principlesEasily understood viz typesColorsNumber and date formattingLayoutChart types: bars, lines, colors, gridsRole-focused dashboardsColor blindnessRendering dashboardsVisualizations to avoidQ&A
Visual perceptionAttentive processing31
Brain speed:Pre-attentiveprocessing(vs attentive processing)41
The Big Book of Dashboards. -dashboards1
The Big Book of Dashboards. -dashboards1
Design Principles / GuidelinesGoals of visualizationWho’s your audienceExposure frequencyExposure lengthScreen real estateExperiment, get feedback, alhost/#/views/CFODashboard/CFODashboard1
Easily Understood Visualization TypesWill you have time to teach users how to read a scattered plot?BarsLinesTablesAreasMapsLabelsPie chartsUp to a few differentdata pointsStateindicatorsBulletchartsRadio gaugestake a lot ofspace2
Color: Data-Ink RatioEdward Tufte: “Data-ink ratio" argues against using excessive decoration in visual displays of quantitative information3
Color: DistractionsTop market share?Color distraction3
Color: Legend and Consistency3
Color: Legend and Consistency3
Color: Bands and Lines3
Color: Actionable3
Number FormattingTypes: Currency, Number, Percentage4
Date FormattingTrend over time?YoY growth?4
Date and Color ChoicesTrend over time?YoY growth?4
Layout: Location, Location, LocationTalk Data to Me: Data Visualization Best Practices: https://www.youtube.com/watch?v GnMSjSWDQNk&index 15&list PL qx68DwhYA WUaY7kDq UJmirJBxrJtL5
Layout: Big Numbers, Eye-tracking10s eyetrackingThe Big Book of Dashboards. -dashboards5
Layout: Tips Avoid scrollbars Date/time stamp5
Chart Types: Bars and LinesTalk Data to Me: Data Visualization Best Practices: https://www.youtube.com/watch?v GnMSjSWDQNk&index 15&list PL qx68DwhYA WUaY7kDq UJmirJBxrJtL6
Chart Types: Colors and Dual Axis6
Charts and Grids6
Role Focused Dashboards: In the work flow7
Role Focused Dashboards7
Color BlindnessSource: -types/10% of males, 1% of femalesColors as seenwith normal visionSame colors as seen with redgreen color deficiency8
Color nals-abroad/8
Rendering Dashboards Method:Desktop, web, mobile, emailPush, self-service, alerts, in the work flow Security - with sensitive data, test it really well! Screen sizes9
Interactivity Use it wisely:Valuable for analysis and actionable dashboardsPotentially confusing for others Pop up windows - short-term memory, importantdata should be always visible Only set filters that are really required9
Visualizations to avoid:Visual Distortions10
Visualizations to avoid:Visual Distortions10
Visualizations to avoid:Visual mathMarket share change over time?10
Visualizations to avoid:Pie Charts for comparing similar data pointsSource: Business Insider10
Visualizations to avoid:3D Charts, especially Pie ChartsDeceivingSource: Business Insider10
Suggested ReferencesVideo: -dashboardsVideo: https://www.youtube.com/watch?v GnMSjSWDQNkBeautiful Evidence (Edward Tufte)Information Visualization (Colin Ware)Information Dashboard Design (Stephen Few)Storytelling with Data (Cole Nussbaumer Knaflic)The 4 Disciplines of Execution (McChesney, Covey, Huling)11
Q&A
Thank you!Joni Girardi, DataSelf Corp. CEO & Founder(408) 674.8003jgirardi@dataself.com @jonigirardiwww.dataself.comCopyright 2017 DataSelf Corporation. All rights reserved. DataSelf is a trademark of DataSelf Corp. All other marks and images belong to their respective owners and the descriptive use of such marks and images does not indicate thatsuch respective owners are in any way connected to or endorsing DataSelf Corp or its initiatives. Comparisons mentioned here are purely metaphorical.
Agenda Design principles Easily understood viz types Colors Number and date formatting Layout Chart types: bars, lines, colors, grids Role-focused dashboards