Transcription
USERGUIDEMT4 TICK CHART TRADER
TABLE OF CONTENTSUSERGUIDEMT4 TICK CHART TRADER1. INSTALLATION OF MT4 TICK CHART TRADERPAGE 032. ABOUT MT4 TICK CHART TRADERPAGE 063. CHARTSPAGE 07A. TICK CHARTSPAGE 07B. TICK SPEEDPAGE 08C. TIMED CHARTSPAGE 09D. TICK CANDLESPAGE 10E. VERSUS CHARTSPAGE 114. TRADINGPAGE 13A. PLACING ORDERS WITH THE MOUSEPAGE 14B. PLACING ORDERS WITH THE KEYBOARDPAGE 16C. PLACING QUICK ORDERS USING THE CTRL KEYPAGE 175. OPTIONS AND SETTINGSPAGE 182
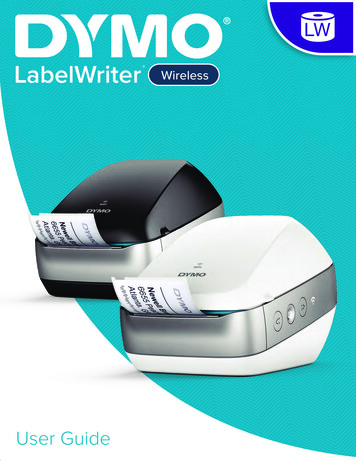
INSTALLATION OF MT4 TICK CHART TRADERUSERGUIDEIn order to install MT4 Tick Chart Trader, follow theMT4 TICK CHART TRADER1steps below:1. Click here to download the retrofit installercontaining the full package of JFD MT4 exclusiveadd-ons.2. Run the installer file (1) on your computer.3. Select the MetaTrader 4 Terminal folder (2) whereyou would like to install the Add-ons package andpress the Install button (3).24. Press OK in the confirmation dialog box that willappear after successful installation.NOTE3Before installing JFD’s MT4 Add-ons, close your MT4terminal. The add-ons cannot be installed if the MetaTrader 4terminal is running.3
INSTALLATION OF MT4 TICK CHART TRADERUSERGUIDEMT4 TICK CHART TRADERAfter successful installation, open your MT4 terminal and youwill find the MT4 Tick Chart Trader (1) along with all other JFDadd-ons in the Navigator window under Expert Advisors.14
INSTALLATION OF MT4 TICK CHART TRADERUSERGUIDEMT4 TICK CHART TRADERIn order to use the add-ons, the Expert Advisors should be enabled. Simply click the AutoTrading button (1) on the top toolbar.Alternatively, you can open Tools main menu and select Options (2). In the dialog box that will appear, open the Expert Advisors tab (3)and make sure that the check-box Allow Automated Trading (4) is ticked. Then press the OK button (5).13245
ABOUT MT4 TICK CHART TRADERUSERGUIDEMT4 TICK CHART TRADERThe MT4 Tick Chart Trader shows tick charts in a variety of styles, and allows quick trading using either keyboard or mouse. The tickcharts are compiled from the time that the add-on starts running. It does not provide access to historic tick data. The MT4 Tick ChartTrader provides five styles of chart: Tick charts Tick speed Timed charts Tick candles "Versus" chartsThe add-on also provides extra-fast position entry and exit, on a FIFO basis, using either the keyboard or mouse.6
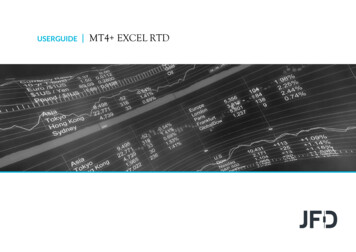
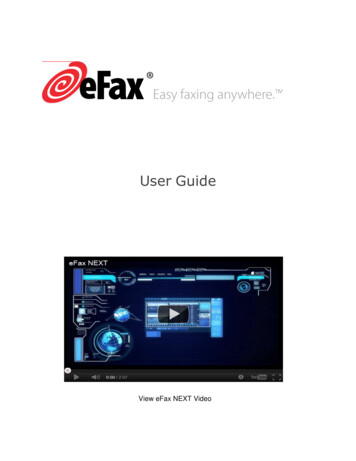
CHARTSUSERGUIDEMT4 TICK CHART TRADERA. TICK CHARTSThe tick charts show each change in the bid orask price; the chart updates whenever eitherprice changes. The amount of time betweeneach point on the chart can vary depending onhow active the market is.7
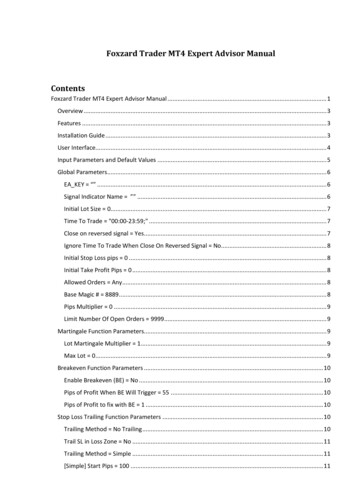
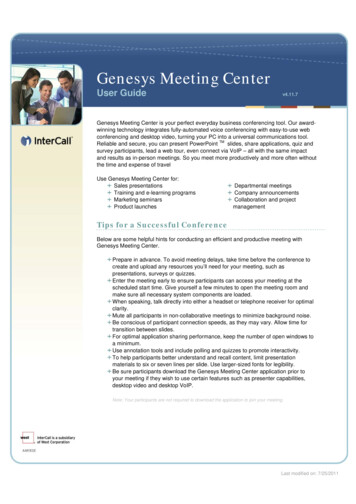
CHARTSUSERGUIDEMT4 TICK CHART TRADERB. TICK SPEEDThe tick-speed chart shows each tick, plus greybars indicating the time between tick. The timeis a rolling average, calculated over the numberof ticks specified by the numeric field in thetoolbar – for example, the average speed of thelast 5 ticks. The smaller the grey bars, thefaster that ticks are appearing.8
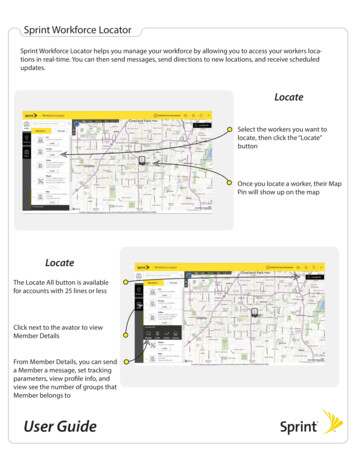
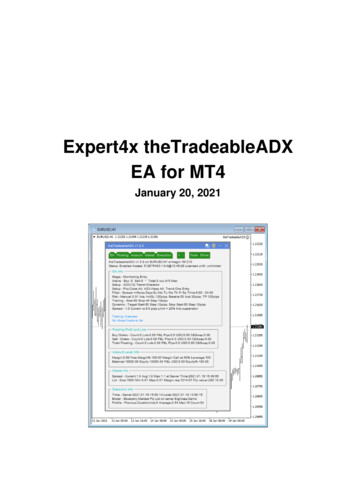
CHARTSUSERGUIDEMT4 TICK CHART TRADERC. TIME CHARTSTimed charts show each individual tick, but thex-axis of the chart is divided into equalamounts of time. Therefore, the chart canshow bursts of activity interspersed withperiods where the lines are flat because nonew ticks occur.9
CHARTSD. TICK CANDLESThe candle chart shows traditional candles –with an open, high, low, and close – but basedon a number of ticks rather than a duration oftime. For example, if the period for the chart isset to 5 ticks, then each candle could representanything from one second if the market isactive (i.e. all 5 ticks happen within a singlesecond) through to as much as a minute if themarket is quiet (i.e. it takes a 60 seconds for 5different ticks to happen). Candle charts arebased on the mid price of each tick (i.e. theaverage of the bid and ask).USERGUIDEMT4 TICK CHART TRADER
CHARTSUSERGUIDEMT4 TICK CHART TRADERE. VERSUS CHARTS"Versus" charts show the activity on onesymbol versus another, plotted against eachother. The chart shows the current mid prices,and per-second historic snapshots. A chart oftwo different symbols plotted against eachothershowsthecorrelationintheirmovements. In the following example there isquite strong negative correlation between thetwo symbols.11
CHARTSUSERGUIDEMT4 TICK CHART TRADERA chart of a symbol against itself is more usefulthan may immediately appear: it shows thecurrent price in relation to the high-low rangeof the period covered by the chart.12
TRADINGUSERGUIDEMT4 TICK CHART TRADERAll trading through the MT4 Tick Chart Trader add-on is on a FIFO basis. For example, if you place a buy order and then a sell order,then the sell closes the previous buy even if you are using hedged orders. The trading functionality in the MT4 Tick Chart Trader isdesigned for people who want quick entry and exit from a single position in each symbol.13
TRADINGUSERGUIDEMT4 TICK CHART TRADERA. PLACING ORDERS WITH THE MOUSEYou can place buy or sell orders by clicking on the bid (1) or ask (2) prices in the bottom-right of the add-on window. This displays a popup dealing panel with buy or sell pre-selected depending on whether you clicked on the ask price or bid price.The trade size from the field in thefooter (3) is copied into the pop-uppanel.You can close an open position by4clickingontheposition/profitmarker (4) in the top-right of theadd-on. This pre-fills the dealingpanel with an order which closesyour position. For example, if you3are long 0.30 lots, then the panelwill be pre-filled with a sell orderfor 0.30.31214
TRADINGUSERGUIDEMT4 TICK CHART TRADERHowever, you can change the contents of the dealing panel before placing the order. For example, you can click on the bid price, pre-filling the dealing panel with a sell order, but then change that to a buy order before placing the trade. You can close the panel withoutplacing a trade by clicking anywhere outside it.15
TRADINGUSERGUIDEMT4 TICK CHART TRADERB. PLACING ORDERS WITH THE KEYBOARDYou can trade with the keyboard using the B, S, and C keys. B hasthe same effect as clicking on the ask price: it pre-fills the dealingpanel for a buy order. S is equivalent to clicking on the bid price; itpre-fills the panel for a sell order. C has the same effect as clickingon the position/profit marker. After pressing one of these keysyou can then either amend the order details, or simply press the1spacebar rather than having to click on the Place order button (1).You can move from the Place order button to the volume fieldusing the standard keyboard shortcut Shift Tab. You can closethe panel without placing a trade by pressing the Esc key.16
TRADINGUSERGUIDEMT4 TICK CHART TRADERC. PLACING QUICK ORDERS USING THE CTRL KEYFor extra-fast order entry, you can use the Ctrl key. You need toturn this option by using any of the options for opening thedealing panel. You do not need to place a trade; you can turn onthe Ctrl option (1) and then cancel the dealing panel. Using theCtrl key is then equivalent to opening the trading panel (usingeither mouse or keyboard) and then clicking on the Place orderbutton without changing the pre-filled settings. In other words: Ctrl C,or holding down Ctrlwhileclicking1on theposition/profit marker, closes your current open position. Ctrl B, or holding down Ctrl while clicking on the ask price,places a new buy order using the trade size shown in thefooter. Ctrl S, or holding down Ctrl while clicking on the bid price,places a new sell order using the trade size shown in thefooter.17
OPTIONS AND SETTINGSUSERGUIDEMT4 TICK CHART TRADERYou can change options and settings for the add-on using the controls (1) in the bottom-left corner of its window.118
OPTIONS AND SETTINGSUSERGUIDEMT4 TICK CHART TRADERThe Max chart length setting (1) does two things: It controls how many ticks are displayed on the chart (number of seconds rather than ticks in the case of "versus" charts). It controls how much tick history is recorded for symbols which are not currently being displayed.For example, if the length is set to 100 and you are currently looking at EUR/USD, then the software will only show the most recent 100ticks but it will be recording an unlimited number of ticks for EUR/USD. You can change the value from 100 to e.g. 200 in order to seemore of the EUR/USD history (provided that 200 ticks have been received). However, the software will have only stored the most recent100 ticks for any other symbol which is not being displayed, such as GBP/USD, and after changing the setting the software will onlyrecord a maximum of 200 ticks for these symbols.The Pause button (2) suspends drawing of the chart. The software continues to collect ticks, and it updates the current price and theposition/profit marker.The Download button (3) downloads the entire available tick history for the selected symbol as a TSV file, showing the date, bid price,and ask price.23119
CONTACT USSUPPORTKakos Premier TowerHelpdesk Phone: 49 691 7537 4271Kyrillou Loukareos 70Helpdesk E-mail: support@jfdbank.com4156 Limassol, CyprusLive chat: Chat now!Fax: 357 25763540Web: www.jfdbank.comTel: 357 25878530JFD is a leading Group of Companies offering financial and investment services and activities. “JFD Bank” is a brand name and registeredtrademark owned and used by the JFD Group of Companies, which includes: JFD Group Ltd (ex. JFD Brokers Ltd), a company withregistration number HE 282265, authorized and regulated by the Cyprus Securities and Exchange Commission - CySEC (Licence number:150/11), JFD Overseas Ltd which is authorized and regulated by the Vanuatu Financial Services Commission (License number 17933) andJFD Bank AG which is authorized and regulated by the Federal Financial Supervisory Authority (BaFin) and by the Deutsche Bundesbankunder license number 120056.
bars indicating the time between tick. The time is a rolling average, calculated over the number of ticks specified by the numeric field in the toolbar –for example, the average speed of the last 5 ticks. The smaller the grey bars, the faster that ticks are app