Transcription
ARL-TN-0765 JULY 2016US Army Research LaboratoryNetwork Visualization Project (NVP)by Terry Wen, Lisa M Marvel, and C Sean MorrisonApproved for public release; distribution is unlimited.
NOTICESDisclaimersThe findings in this report are not to be construed as an official Department of theArmy position unless so designated by other authorized documents.Citation of manufacturer’s or trade names does not constitute an officialendorsement or approval of the use thereof.Destroy this report when it is no longer needed. Do not return it to the originator.
ARL-TN-0765 JULY 2016US Army Research LaboratoryNetwork Visualization Project (NVP)by Terry WenAmerican Society of Engineering Education, Washington, DCLisa M MarvelComputational and Information Sciences Directorate, ARLC Sean MorrisonQuantum Research International, Inc., Bel Air, MDApproved for public release; distribution is unlimited.FOR OFFICIAL USE ONLY (delete if not FOUO)
Form ApprovedOMB No. 0704-0188REPORT DOCUMENTATION PAGEPublic reporting burden for this collection of information is estimated to average 1 hour per response, including the time for reviewing instructions, searching existing data sources, gathering and maintaining thedata needed, and completing and reviewing the collection information. Send comments regarding this burden estimate or any other aspect of this collection of information, including suggestions for reducing theburden, to Department of Defense, Washington Headquarters Services, Directorate for Information Operations and Reports (0704-0188), 1215 Jefferson Davis Highway, Suite 1204, Arlington, VA 22202-4302.Respondents should be aware that notwithstanding any other provision of law, no person shall be subject to any penalty for failing to comply with a collection of information if it does not display a currently validOMB control number.PLEASE DO NOT RETURN YOUR FORM TO THE ABOVE ADDRESS.1. REPORT DATE (DD-MM-YYYY)2. REPORT TYPE3. DATES COVERED (From - To)July 2016Technical Note1 May–31 August 20154. TITLE AND SUBTITLE5a. CONTRACT NUMBERNetwork Visualization Project (NVP)5b. GRANT NUMBER5c. PROGRAM ELEMENT NUMBER6. AUTHOR(S)5d. PROJECT NUMBERTerry Wen, Lisa M Marvel, and C Sean Morrison5e. TASK NUMBER5f. WORK UNIT NUMBER7. PERFORMING ORGANIZATION NAME(S) AND ADDRESS(ES)8. PERFORMING ORGANIZATION REPORT NUMBERUS Army Research LaboratoryATTN: RDRL-CIN-DAberdeen Proving Ground, MD 21005-5067ARL-TN-07659. SPONSORING/MONITORING AGENCY NAME(S) AND ADDRESS(ES)10. SPONSOR/MONITOR'S ACRONYM(S)11. SPONSOR/MONITOR'S REPORT NUMBER(S)12. DISTRIBUTION/AVAILABILITY STATEMENTApproved for public release; distribution is unlimited.13. SUPPLEMENTARY NOTES14. ABSTRACTThe purpose of the Network Visualization Project is to construct an interactive application for real-time playback of networkactivity based upon packet capture data. As data networks continue to expand as an integral part of modern informationsystems, the importance of the organization and clarity of said networks grows as well. The goal of this project differs fromthose of similar existing tools in its attempt to optimize both content and clarity, as the product is meant to maintain aestheticappeal without sacrificing any details of the data meant to be portrayed. The project uses Dshell for back-end data retrievaland Processing for front-end presentation and construction of the application itself.15. SUBJECT TERMScomputer network traffic, computer network security, computer network visualization, network traffic analysis, networkforensics16. SECURITY CLASSIFICATION OF:a. REPORTUnclassifiedb. ABSTRACTUnclassified17. LIMITATIONOF ABSTRACT18. NUMBEROF PAGESUU18c. THIS PAGEUnclassified19a. NAME OF RESPONSIBLE PERSONLisa Marvel19b. TELEPHONE NUMBER (Include area code)410-278-6508Standard Form 298 (Rev. 8/98)Prescribed by ANSI Std. Z39.18ii
ContentsList of Figuresiv1.Introduction and Background12.Application Design12.1 Dshell: Back-End Data Handling22.2 Processing: Front-End Data Presentation32.3 Running a Network Visualization63.Conclusion and Future Work84.References9List of Symbols, Abbreviations, and Acronyms10Distribution List11Approved for public release; distribution is unlimited.iii
List of FiguresFig. 1Application data flow .2Fig. 2Sample JSON data .3Fig. 3Original visualization model .4Fig. 4New flow-based model .4Fig. 5Snip of connection time line .5Fig. 6Connection and packet information .5Fig. 7Application screenshot .7Approved for public release; distribution is unlimited.iv
1.Introduction and BackgroundAs part of the ever-expanding age of information, data networking continuouslygrows in importance. With the quantity of data transferred across networksincreasing daily, the monitoring of such networks becomes increasingly difficult.The Network Visualization Project (NVP) tackles issues regarding the display,monitoring, and inspection of network traffic and allows such data to be presentedin an easily explored and understandable fashion.NVP is useful for troubleshooting, application development, protocol analysis, anda myriad of other network analysis purposes. With other commonly availablenetwork visualization tools, such as WireShark,1 users lack direct control of andinteraction with the network data. They are simply presented with an itemizeddisplay of packet capture information. Other visualizers, such as Commetrix, tendto prioritize aesthetics with visually interesting illustrations that make it difficult orimpossible to access technical detail. Tools that lack interactivity or limit access totechnical detail are generally unusable for in-depth network analysis work. NVPaims to address these issues with the construction of an interface that moreoptimally balances content, interactivity, and clarity.Because of the need for attention to detail, NVP is intended to monitor small-scalenetworks, watch for specific issues, and trace events in traffic. A primary goal ofthe project is to create an interface that can help locate potential issues, identifyweaknesses in a network, and provide an understandable illustration of networkcommunication that is adequate for a generally untrained eye. In accomplishingthis, the project will provide a new tool interface supporting improved networkanalysis and network communication visualization.2.Application DesignNVP consists of 2 parts: back-end data handling and front-end presentation. Dataare first processed through Dshell, an open source packet-decoding tool developedby the US Army Research Laboratory.2 These data, either streamed or input througha packet capture file (commonly called a “pcap” file), are output in JavaScriptobject notation (JSON) format. This JSON is provided as input to the front-endapplication of the project. This interaction of the user with the back-end interfaceallows for full manipulation of the data and the ability to directly filter data to theuser’s needs.Approved for public release; distribution is unlimited.1
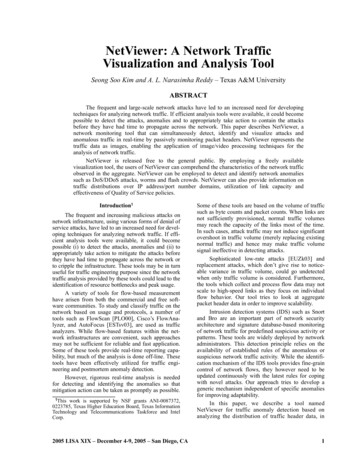
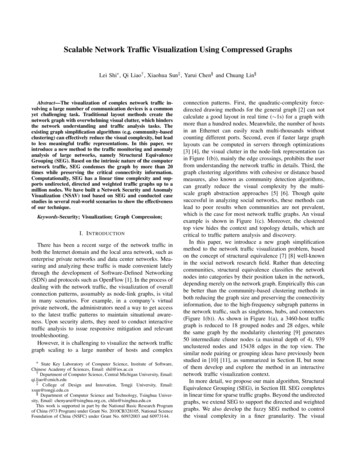
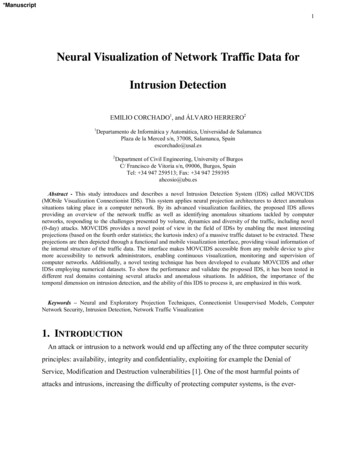
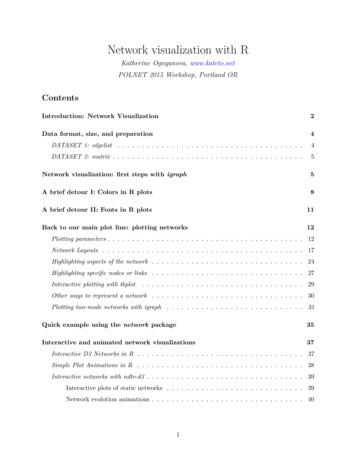
The data are then processed by the front-end application, which is coded using theProcessing programming language.3 Here, the user is able to visually interact witha time line that encloses the duration of imported packet data. This playbackpresents the data visually through nodes and connections that can be interactivelymanipulated fully by the user or automatically arranged by the application. Theprimary attributes of the data shown are as follows: Source and Destination IP addresses Ports Protocols Time Packet length Other details in packet header (transmission control protocol (TCP) flags,etc.)The visualization is meant to illustrate macro activity through a network as well asthe individual details of individual packets. The interface will also include otherutilities, such as playback tools and data filters.The NVP process is shown in Fig. 1. Where network data is collected in a .pcapfile. It is then transformed using Dshell into a JASON format. This is the input intothe NVP processing module to construct the visualization.Fig. 1Application data flow2.1 Dshell: Back-End Data HandlingDshell, or Decoder shell, is a command-line framework used for network forensicanalysis. Dshell processes existing pcap files and filters output information basedon both prebuilt and user-constructed modules. The Dshell portion of NVP involvesthe construction of an output module that will parse the necessary data from a pcapfile into a JSON format file. Dshell allows the user to directly choose the modulesto use for full control of the data portrayed in the visualization. Dshell provides avariety of tools and filters necessary to extract the desired information from pcapdata and is flexible enough to adapt to a variety of network analysis goals. A sampleof the JSON data file is shown in Fig. 2.Approved for public release; distribution is unlimited.2
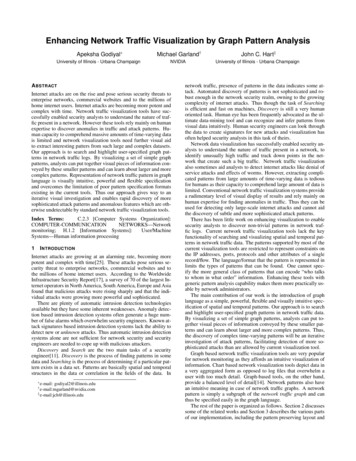
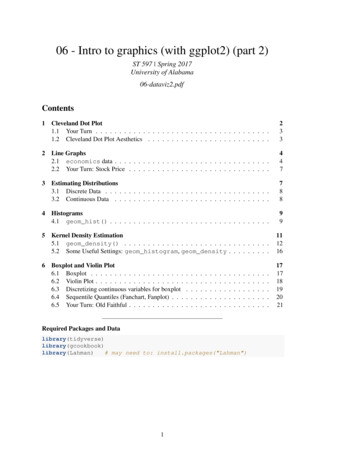
Fig. 2Sample JSON data2.2 Processing: Front-End Data PresentationThe Processing application is a graphic user interface (GUI) that first loads andprocesses the input JSON data into a visual representation. Loaded into memory,the JSON array contains network packet objects with packet information asattributes. It is loaded into memory via Processing’s Java-based JSON inputmethods. The packets are then added into individual topological data arrays,representing the nodes and connections that they travel between and through duringdata transmission. A time line is also generated based on the timestamps of theimported packet data, and the packet data are accessed through the individual statesof the time line.The initial design of the GUI visualization used a direct animated visual for theindividual packets of an exchange, allowing for a full illustration of the amount oftraffic on a connection between nodes. However, multiple issues arose from this,including the inaccurate portrayal of travel time for the data packets, whichgenerally travel faster than can be interactively visualized clearly. This initialversion used a time line of visual states where the visualization directly reflectedthe time-line state, but packet transmission was visualized as an animation. Theillustration ended up with inconsistencies, such as response packets being drawnwhile the initial packets were still portrayed as “travelling” and packets being“frozen” while the time line is paused when they were likely already at theirdestination (Fig. 3). While the idea of viewing individual packet movements isappealing, the design was ultimately impractical and was readapted to a new model.Approved for public release; distribution is unlimited.3
Fig. 3Original visualization modelThe new model uses flow visualization rather than individual packet visualization.A screenshot of the complete interface is found in Section 2.3. Instead of animatingindividual packet movements, the visualization portrays general activity along aconnection, which can then be selected to show more details about a given flow ofpackets, including information on individual packets. This model allows the visualto base itself on the data instead of the time line directly, and the time line insteadinfluences the state of the data. By doing this, independent animations of nodes andconnections can be manipulated far more easily as the model adapts itself to thedata rather than the timestamp on the time line. This allows for a simpler layout thatdoes not sacrifice clarity or detail. In the following screenshot (Fig. 4), active datatransfer is denoted by a solid connection, and the currently selected connection isdenoted by the highlighted connection.Fig. 4New flow-based modelApproved for public release; distribution is unlimited.4
This new functionality makes selecting individual packets for details much easier.As stated previously, the selected connection is then illustrated in the interface as asmaller time line, as well as highlighted in the overall time line, to allow viewingof individual packets and their sizes (Fig. 5). The red line (seen in the applicationscreenshot) denotes the current point in time, and packets sent are either drawnabove or below the horizontal time line according to whether they originate fromsource or destination.Fig. 5Snip of connection time lineThis new model also allows for more flexibility in changing the layout of the visiblegraph, allowing individual nodes and connections to be visible only when they areactively sending or receiving data to reduce overall clutter. This is particularlyimportant on larger, complex networks with hundreds or thousands of nodes. TheGUI allows for easy manipulation of individual node positions so the user cancustomize the general layout. The program also automatically balances the relativenode positions, using a force-directed graph algorithm.4 This makes for an intuitiveand aesthetically pleasing graph drawing that is easy to learn and manipulate.Aside from the visual aspects of the GUI, selected nodes, connections, and packetsalso provide direct information, including addresses, ports, bytes, and protocols(Fig. 6). Both TCP and user datagram protocol packet protocols are supported bythe visuals through different colors and can also be viewed in the attributes ofselected nodes. These data panels can be extended and configured to displayadditional information as well.Fig. 6Connection and packet informationApproved for public release; distribution is unlimited.5
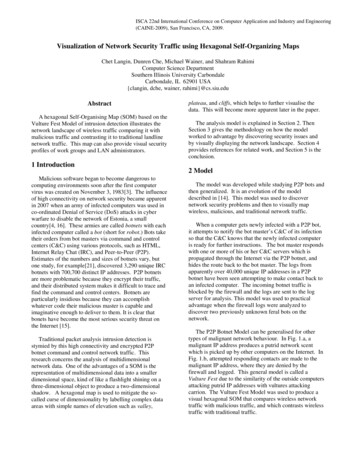
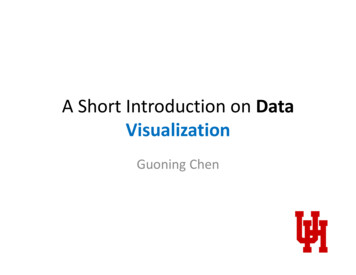
2.3 Running a Network VisualizationCurrently, the application has not been exported and runs through the Processingintegrated development environment (IDE). After retrieving the JSON file fromDshell, it must be named data.json and placed into the data directory in theapplication folder. Then the application file NetVis.pde must be loaded and runthrough the Processing IDE (Fig. 7).From here, there are multiple controls to interact with as well as the visualizationitself. The time line can be manipulated freely, similar to a video player.5 There are2 timers, one for direct timestamps and one for the duration of the playback only.On the right side, there is a slider that manipulates playback speed from 0.1 up to100 speed. There are also multiple buttons that manipulate the layout, with 2primary functions: Lock: Keep node visible at all times, even when inactive (i.e., nottransmitting or receiving data) Anchor: Keep node anchored at its current position, unaffected byautomatic position adjustmentThere is one final button labelled Start of Flow, which simply moves the time-linecursor to the beginning of the currently selected connection. Nodes and connectionscan be freely selected individually, and packets can be selected while a connectionis active.Along with the button functionalities, there are also a variety of keyboard shortcuts: Space: Play/Pause L: Lock current node/ all visible if no node is selected (Shift L for all) A: Anchor current node/ all visible if no node is selected (Shift A for all) F: Move to start of selected flowApproved for public release; distribution is unlimited.6
Approved for public release; distribution is unlimited.7Application screenshotFig. 7
3.Conclusion and Future WorkData networks are a pervasive part of daily life in the modern era, but few are trulyaware of what really happens in these systems. Even competent systemadministrators and network managers struggle to manage the ever-growingcomplexity. As network size and usage continue to grow, the chances of error andthreats become more and more pertinent. Today, even the common householdshould be able to monitor and make full use of their home network to avoidexploitation and other possible configuration issues. NVP seeks not only to providea helpful tool for experienced analysts, but also to promote awareness of theimportance of how networks are structured and operate.Though the base of NVP is complete, there is still much that needs to be expandedupon. As stated in the original goals for the project, aesthetics should not sacrificetechnical detail in an interactive interface. There remain many details in the networkpackets (in the original pcap data) that are not currently presented via the GUI. Aprimary attribute of packets to highlight is the TCP flags to help capture more detailinto what is occurring in each of the flows portrayed in the visualization. The GUIalso currently functions primarily as a large-scale interactive and animatedplayback visualization with no simulation capabilities. Other issues in the layout liein the simplicity of the nodal graph drawing: while the clarity is important, adifficult issue to address is how to distinguish or group similar nodes withouthaving to look into their details.These issues can be readily accounted for with future improvements to the usercustomization and interaction, which could use color-coding and node filtering aswell as other ways to present information, such as node sizing and clustering. Otherideas discussed included data exportation, which could allow for sharedvisualizations that include highlighting, annotations, and user-specified orpreconfigured layouts that better communicate a given network analysis.To simplify application deployment, NVP needs to be configured as a stand-aloneapplication that does not require the Processing IDE to run. It may also beincorporated as a web application using Processing.js, a Javascript framework forProcessing. All of these functions can be built off of the current base application,which is released as open source to enable further innovation and communitydriven development possibilities.Approved for public release; distribution is unlimited.8
4.References1.WireShark [accessed 2015 June 3]. http://www.wireshark.org.2.Dshell [accessed 2015 June 8]. essing. Documentation [accessed 2015 June 3]. https://processing.org/reference/.4.Marchi L. Force directed placement ID 177.5.ControlP5. Documentation [accessed 2015 June 20]. /index.html.Approved for public release; distribution is unlimited.92015July9].
List of Symbols, Abbreviations, and AcronymsGUIgraphical user interfaceIDEintegrated development environmentIPinternet protocolJSONJavaScript object notationNVPnetwork visualization toolTCPtransmission control protocolApproved for public release; distribution is unlimited.10
1DEFENSE TECHNICAL(PDF) INFORMATION CTRDTIC OCA2DIRECTOR(PDF) US ARMY RESEARCH LABRDRL CIO LLIMAL HRA MAIL & RECORDSMGMT1GOVT PRINTG OFC(PDF) A MALHOTRA3DIR USARL(PDF) RDRL CIN DL MARVELJ CLARKERDRL SLB SC MORRISONApproved for public release; distribution is unlimited.11
INTENTIONALLY LEFT BLANK.Approved for public release; distribution is unlimited.12
The Network Visualization Project tackles issues regarding the(NVP) display, monitoring, and inspection of network traffic and allows such data to be pr