Transcription
IRDS: VisualizationCharles SuttonUniversity of Edinburgh
Why visualisation? Exploratory What’s in the data? What’s wrong with it? Today’s lecture.Presentation Display results of algorithms for publicationEngagement Infographics from web sites, word clouds, etc
Summary Statistics Univariate Mean Median Variance QuantilesMultivariate Correlation Covariance
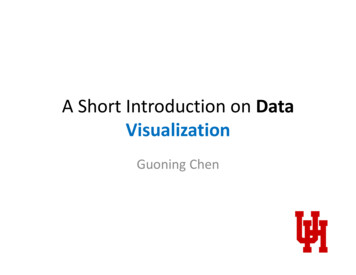
46810 12 14 16806020000 ultimodalitythese three have same summary statistics!14
Outliersin histogramsHistogramDetectingOutlier (Missing Data)uresblood pressure 0 ?Blood pressuredata setUCI ML repositorysays no missing dataLecture on EDA and Visualization(well, for 20 years it did)Padhraic Smyth, UC Irvine[Source: Padhraic Smyth]
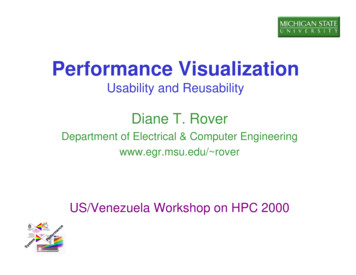
80Class-Conditional Histograms 406080 100200150100Negative negposQuartileExtremedataDiabetes?050Median40Blood PressureQuartile6020Pressure00Frequency 80100 12040Positive(diabetes)20Frequency60Alternative: Box plot020406080 100Blood PressureMaybe for only 2 groups, graphs not necessary.For more visual comparisons, can be helpful.
Slight rant about bar chartsWeka’s automatic visualisation 6040200Pressure80100 120Here’s my boxplot negposDiabetes?Bar charts often seem like a better idea than they are
0102030405060Effect of bin size01020304050
005101020153020402550306035Effect of bin size0102030405001020304050
00551010151520202525303530Effect of bin size0102030405001020304050
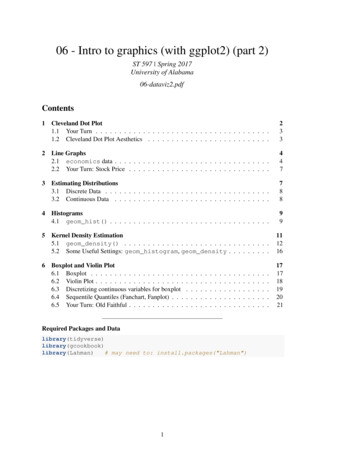
More misleading histogramsZipCode Data: 00300200020010000100024681001242068101244x 10x 10400350300250200150100500Data Mining Lectures05001000150020002500300035004000Lecture on EDA and Visualization45005000Data: US Post CodesPadhraic Smyth, UC Irvine[Source: Padhraic Smyth]
Bivariate data Numerical summaries about linear dependence Histograms sort of scale to 2-D but not really higher More common to use scatter plots
Numerical bivariate summariesData are (x1 , y1 ), (x2 , y2 ), . . . (xN , yN )Sample covariance:NX1sxy (yi ȳ)(xiN 1 i 1Sample correlation: xysxy sx sywhere as beforex̄)1 Xx̄ xiN i1 Xȳ yiN is1 Xsx (xiN 1 isy s1N1Xi(yix̄)ȳ)
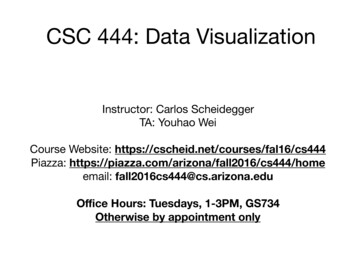
148 1064468 1014Dangers of correlation81012144681012144681012148 1064468 10146144810 12 14 16 18[Anscombe, 1973]
2Scatterplots 1 0 1 2x2 2 101x123
2 1 0 1 x2 Overplotting samples from bivariate normal also: notice the axes! 2 2 10123x143100 data points 2 x22 0 2 1x2012 3
[Source: William Cleveland, Visualizing Data] Wait, what if you have categorical data? Colour Contingency tables Multiple plots (e.g., class-conditional histograms) Tools here include: Colour in Scatterplots 0.0 0.2 0.4 0.6 0.8 1.0 0.0 0.2 0.4 0.6 0.8 1.0 Token score after attack Token score before attack 0. 0 0.2 0.4 0.6 0.8 1.0 0.0 0.2 0.4 0.6 0.8 1.0 Token score after attack Tok