Transcription
Use this document when viewing,designing, sharing andUnderstanding Dashboards in P6EPPM Web interface R8.0 and later.White Paper - UnderstandingDashboards in P6 EPPMR8.0 By Charles Wrightcharleswrightsnr@gmail.com
Table of ContentsCopyright Notice . 3References . 4Who should read this paper? . 4Introducing Dashboards . 5What does a Dashboard look like? . 6What kinds of Dashboards are in P6? . 71. P6 Dashboard . 72. Workspace . 73. Workgroup . 7What Portlets are available in P6? . 8Creating a P6 Dashboard in 6 easy steps . 9Step 1: Important Considerations . 10Step 2: Create the empty Dashboard . 11Step 3: Decide on the content of the Dashboard. 12Step 4: Review your selections. 17Step 5: Change the Layout . 18Step 5: Decide on Access to this Dashboard . 20Step 6: All done . 20Managing your Dashboards . 21The differences between Workspace and Dashboard . 231. Launch Contract Management . 232. No Project Filters . 233. No title needed for a Workspace . 234. There are no Personalized Portlets . 235. Oracle Primavera Contract Management Portlets . 236. Access . 237. Workgroups . 248. Portfolio Views . 249. Workspace Management . 24Conclusion . 25Page 1 of 51 Charles Wright 2012
Tips and Tricks . 25Available Dashboard Portlets . 27Appendix 1a: Available P6 Performance Dashboard Portlets . 28Schedule Performance Portlet: . 28Earned Value Performance: . 28Index Performance: . 29Project Statistics: . 29Project Health: . 30Project Notebooks: . 30Project Gantt Chart:. 31Appendix 1b: Available ‘Personal Information’ Dashboard Portlets . 32My Projects: . 32My Workgroups: . 32My Activities: . 33My Risks: . 33My Issues: . 34My Documents:. 34My Calendar: . 35Communication Centre: . 35Appendix 1c: Available ‘Resource’ Dashboard Portlets . 36Resource Team Summary: . 36Open Request for Resources . 36Resource Analysis Chart . 37Appendix 1d: Examples of ‘Portfolio View’ Dashboard Portlets . 38Bubble Chart . 38Histogram . 38Pie Chart. 39Scorecard . 39Appendix 1e: Available ‘Primavera Contract Management’ Dashboard Portlet . 40Cost Worksheet. 40Appendix 2a: Available ‘Project Performance’ Workspace Portlets . 41Page 2 of 51 Charles Wright 2012
Earned Value Performance . 41Index Performance. 41Schedule Performance . 42Project Statistics . 42Project Health . 43Appendix 2b: Available ‘Project Related’ Workspace Portlets . 44Critical Activities Behind Schedule . 44Milestone Status . 44Notebook Topics . 45Over allocated Resources . 45Project Documents. 46Project Issues . 46Project Risks . 47Appendix 2c: Available ‘Project Collaboration’ Workspace Portlets . 48Communication Centre . 48Project Calendar . 48Workgroups . 49Available portlets in a Workgroup: . 49Appendix 2d: Examples of ‘Integrated O-PCM’ Workspace Portlets . 50Request for Information . 50RFI Turnaround . 50Submittals . 51Copyright NoticeThis publication and its contents are the copyright of Charles Wright - Charles Wright 2012. All rights reserved.All referenced trademarks are the property of their respective owners.Page 3 of 51 Charles Wright 2012
References1.2.3.All P6 Web illustrations are taken from a demonstration sample of P6 EPPM R8.2 installed on a virtual machine onmy computer.Non P6 related illustrations are taken from www.freeimages.com (Automotive Section)Dashboard Portlet descriptions listed in the Appendix sections are taken from the Oracle Primavera P6 EPPMDocumentation Library R8.2.Who should read this paper?This paper can be read and used by anyone who has ever logged onto P6 Web, whether you are an experienced P6 Planneror even if you are a novice P6 user. Read this paper from start to finish, or merely use the paper for reference when designinga dashboard, it’s entirely up to each individual.Who should read this paper should not be limited to a user role, but rather limited to the P6 infrastructure you have in yourorganisation. There is no point in developing your Dashboard skills if you have no underlying data to base it on. Mature datais the key, in other words, an EPS full of Named Resource Loaded schedules; Activity / Project Owners assigned; with clearand descriptive Project / Activity names; coded; well thought out EPS & OBS; Stored Financial Periods, a large P6 user base,etc. Once your organisation has these aspects in place, designing dashboards becomes easy. If none of this made any senseat all, I suggest you start with Oracle University or a certified Oracle Primavera training facility, maybe even a Primaverapartner.You can also use this paper to help build mature data, by that I mean create an empty dashboard and identify how you needto structure your project data in order to populate the dashboard with meaningful information. This approach may seembackward, but it’s a place to start.One last thing, you need P6 Web to create Dashboards. That means, you need the web services version of P6 EPPMEnterprise Primavera Portfolio Management 8.0 and later only. The Windows Client aka P6 Professional / Optional Clientdon’t support Dashboards. In addition, earlier versions of P6 Web do support Dashboards, however I’ve decided to onlyinclude down to version R8.0, as they have the same look and feel. In any case, these versions R8.0 and above are recentupgrades, and more is better. As long as you have a service agreement with Oracle, why waste time with old technology?CHARLIE’S TIP:As you go along, I’ll be including ‘Charlie’s Tips’, which is basically tips to you, gained from experience when implementingPrimavera P6 Web Dashboards to clients.CHARLIE’S TIP:In order to utilize the full functionality of P6 Dashboards, organisations who plan and manage projects in P6 with ‘named’resources will gain the most from P6 Dashboards. Prepare to interpret Dashboards differently when using ‘shortcuts’ or‘alternatives’ during implementation when resources are considered.Page 4 of 51 Charles Wright 2012
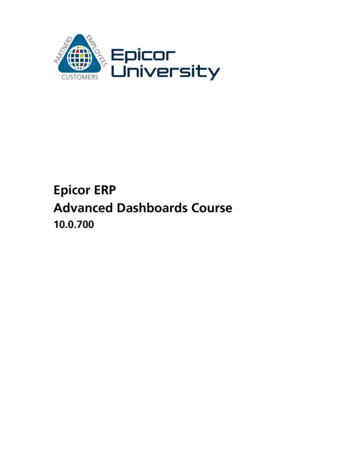
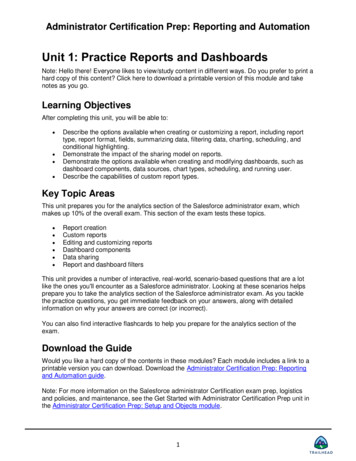
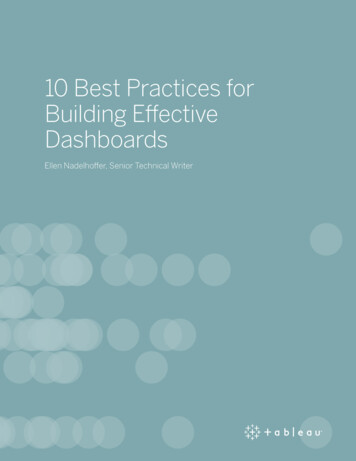
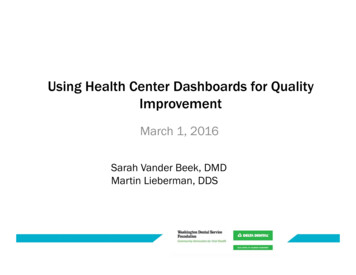
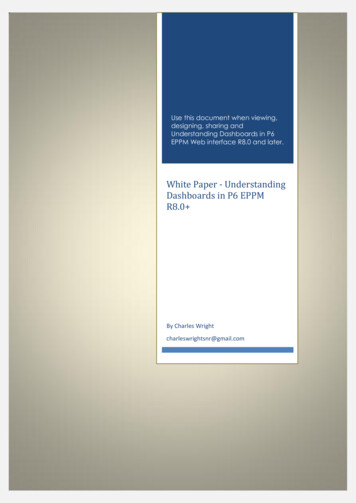
Introducing DashboardsWhen you think of a Dashboard,think of it like the Dashboard(heads up display) of a motorvehicle.Whilst the Dashboard doesn’tnecessarily drive the vehicle, itspurpose is to provide up to datereal time information aboutvehicle’s performance to thedriver/s. The use of short,colourful and well thought outlayouts make Dashboards notonly appealing, but functionaltoo.Standard performance metrics like speed, total distance covered, oil temperature and other driving metrics are shown in onespot, with clear visibility. And for those fortunate with a deeper pocket might have AMB temp, GPS, and other bling bling asadditional performance metrics on your vehicle. The point is that a vehicle’s dashboard is a single interface for multipledrivers to view performance details, in one place, separated into boxes of detail, with visible and colourful displays, to viewsummary information about the car.In fact, when you think there is a problem with the car whilstdriving, the first thing one would normally check is the dashboardoil temp, before actually checking under the hood. The sameprinciple is applied to a P6 Dashboard.Getting back to P6, the landing page in Primavera P6 Web is the Dashboard; it’s the first thing a driver sees when they log on.From the dashboard, you identify the problem, and then navigate to the various other places in P6 to fix the problem. Forinstance, there is a problem in the project as it is falling behind schedule, so you would look on the dashboard for the SPI,Project Float value or Finish Variance Values. When you come to the same conclusion that the project is behind schedule,based on the values displayed on the Dashboard, you will know the severity and what needs to be done. In this case, throwmore resources at it, increase the budget, change the calendar; constraints or durations, or possibly change relationships in aproject for more parallel works to happen with Start to Start logic links.As you read through this document, continue to use the motor vehicle dashboard example, particularly when it comes to theDashboard design. When you are designing a Dashboard in a car, you need to consider that other drivers might use thedashboard, you need to consider access to the dashboard, the layout, the personal preferences and so on.CHARLIE’S TIPSo, if the Dashboard on P6 is comprisable to that of a Vehicle Dashboard, when things go wrong, and the Dashboards startflickering red warning lights, it’s time to call a mechanic, a P6 Planner or the Planning Management department, or changethe way you plan to drive the project. Use Portfolio view’s to imitate these red lights!Page 5 of 51 Charles Wright 2012
What does a Dashboard look like?Traditionally, P6 as a standalone desktop application was always a bit clumsy when it came to reporting performance to amonitoring group, like Managers, Stakeholders and Shareholders. It did the job of working as a tool to manage a project, butlacked the ability to provide easy, configurable and graphical appealing outputs like the many of Primavera’s competitors.Naturally this annoyed the P6 community and with the release of P6 R8.0 (actually a bit earlier) came the functionality ofDashboards.Dashboards in P6 are a selection of ‘Portlets’, in other words ‘boxes of information’ displayed on one single page, withoutadditional tabs or sub pages. That means a P6 Dashboard is one page, and the tabs to the left or right of the current selectedDashboard is another Dashboard.These Portlets will be described in the next section however for the most are what’s known as Meta data, i.e.: data thatdescribes data. That means the portlet is a design that will describe certain data in the database. For instance Risk portletdescribes risks captured in the database, applicable to a project, programmes or portfolios. These Portlets are a collection oftabular reports, forms, graphic outputs or a combination of the 3.Therefore, a Dashboard looks like a page of boxes which contain SUMMARIZED data applicable to the person viewing thatparticular Dashboard. The boxes are all the same height, and the length is limited to half the page or across the entire page.Suffice to say, there is no space for detailed activity level information.Page 6 of 51 Charles Wright 2012
CHARLIE’S TIP:You will noticed I made the word SUMMARIZED in bold and capitals. If you don’t know what this means, I suggest you takethe time to read up on it now, but basically it’s a process you run on projects to populate summary tables in the database.Lastly, unlike a flat or stacked printed paper report, a Dashboard does have some functional interaction, drill down / slice ndice functionality. Therefore a user can in some instances for example, see the SPI of a project, then drill down to see the SPIat the different WBS levels.ANOTHER CHARLIE’S TIP:For an unlimited number of ‘Interactive Dashboards’, you may want to consider P6 Analytics in your organisation, which is acomponent of Oracle Business Intelligence suite of products. Get onto Oracle’s website for further details.What kinds of Dashboards are in P6?P6 Dashboards are a collection of Portlets, therefore there is no standard dashboards available, and it’s up to theorganization and the collection of it’s users to decide what dashboards to create and maintain. There are however 3 differenttypes or categories of so called ‘Dashboards’:1.P6 DashboardA P6 Dashboard is a page on the P6 Web Navigation Bar to summarize and report data from multiple Projects or Portfolios(groupings of projects). It allows the user to see the same information about one project in comparison to another. Otherthan the ‘My Activities’ Portlet, most Portlets on the P6 Dashboard provide summary data to a portfolio; project or WBS levelonly. The Dashboard is not designed to manage projects, simply to provide summary information about the projects,allowing the user to make a decision, based on the results they see.2.WorkspaceA Project Workspace is a page on the Projects navigation bar to show detailed information limited to a single project. If youhad a Dashboard open on one system, and a Workspace opened on another, only experienced Dashboard creators could tellthe difference, as they are almost identical. It’s their location and purposes that differentiate the two. A P6 Dashboard allowsyou to view multiple projects, A Workspace only looks at the project that you have open. There are no ‘personalized’ Portletson the workspace page, like ‘My Risks’ or
Enterprise Primavera Portfolio Management 8.0 and later only. The Windows Client aka P6 Professional / Optional Client don’t support Dashboards. In addition, earlier versions of P6 Web do support Dashboards, however I’ve decided to only include down to version R8.0, as they have the same look and feel.File Size: 1MB