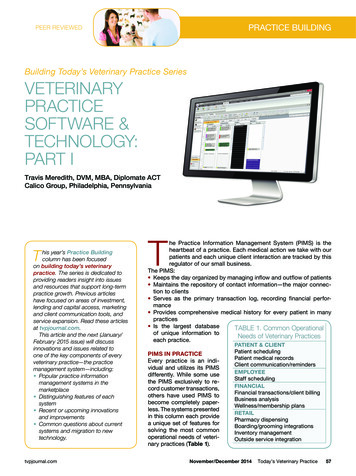
Transcription
Administrator Certification Prep: Reporting and AutomationUnit 1: Practice Reports and DashboardsNote: Hello there! Everyone likes to view/study content in different ways. Do you prefer to print ahard copy of this content? Click here to download a printable version of this module and takenotes as you go.Learning ObjectivesAfter completing this unit, you will be able to: Describe the options available when creating or customizing a report, including reporttype, report format, fields, summarizing data, filtering data, charting, scheduling, andconditional highlighting.Demonstrate the impact of the sharing model on reports.Demonstrate the options available when creating and modifying dashboards, such asdashboard components, data sources, chart types, scheduling, and running user.Describe the capabilities of custom report types.Key Topic AreasThis unit prepares you for the analytics section of the Salesforce administrator exam, whichmakes up 10% of the overall exam. This section of the exam tests these topics. Report creationCustom reportsEditing and customizing reportsDashboard componentsData sharingReport and dashboard filtersThis unit provides a number of interactive, real-world, scenario-based questions that are a lotlike the ones you'll encounter as a Salesforce administrator. Looking at these scenarios helpsprepare you to take the analytics section of the Salesforce administrator exam. As you tacklethe practice questions, you get immediate feedback on your answers, along with detailedinformation on why your answers are correct (or incorrect).You can also find interactive flashcards to help you prepare for the analytics section of theexam.Download the GuideWould you like a hard copy of the contents in these modules? Each module includes a link to aprintable version you can download. Download the Administrator Certification Prep: Reportingand Automation guide.Note: For more information on the Salesforce administrator Certification exam prep, logisticsand policies, and maintenance, see the Get Started with Administrator Certification Prep unit inthe Administrator Certification Prep: Setup and Objects module.1
Administrator Certification Prep: Reporting and AutomationExam Practice QuestionsReady to jump in? The sample tool below is not scored—it’s just an easy way to quiz yourself.To use it, read the scenario on the left side, then click on the answer you think is correct. Somequestions may have more than one correct answer. Click submit, and you get a pop-up tellingyou whether the answer you chose is correct or incorrect, and why. When you reach the end,you can review the answers or retake the questions.Scenario 1A sales manager at Ursa Major Solar wants a team of sales reps to know how many openopportunities they have at any given time.How should an administrator configure a report for each sales rep to see their own openopportunities?FEEDBACKANSWERA. CREATE A REPORTING SNAPSHOTGROUPED BY SALES REP.Incorrect. This does not show a sales rep justtheir own open opportunities.B. CREATE A REPORT WITH A CROSSFILTER BY MY OPPORTUNITIES.Incorrect. Cross filters are used in reports to filterfor cross object fields.C. CREATE A REPORT FILTERED BYMY OPPORTUNITIES.Correct. This report shows a sales rep theirown open opportunities.D. CREATE A REPORT SCHEDULEFOR EACH SALES REP.Incorrect. A schedule doesn’t create a report thatallows each sales rep to see their own openopportunities.2
Administrator Certification Prep: Reporting and AutomationScenario 2Which three report charts show how many leads are in the marketing pipeline based on leadstatus and what percent each lead status represents? (Choose three answers.)FEEDBACKANSWERA. GROUPED BAR CHARTIncorrect. A grouped bar chart shows siloed,individual lead information.B. PIE CHARTCorrect. A pie chart shows the number of leadsand the percentage of leads as part of thewhole.C. DONUT CHARTCorrect. A donut chart shows the number ofleads and the percentage of leads as part ofthe whole.E. FUNNEL CHARTCorrect. A funnel chart shows the number ofleads and the percentage of leads as part ofthe whole.3
Administrator Certification Prep: Reporting and AutomationScenario 3A finance user with the View All Data permission enabled sees no opportunities when opening asales pipeline report. However, a sales rep sees opportunities as expected. Opportunitiesshould be visible to only those with permission.Which two actions should the administrator perform to ensure that the finance user seesopportunities in the pipeline report? (Choose two answers.)FEEDBACKANSWERA. SELECT SAVE HIERARCHY LEVELON THE PIPELINE REPORT.Correct. The Save Hierarchy Level checkboxbeing selected ensures that the hierarchy levelthat was used when creating a report staysintact. So if the finance user had permission tosee reports originally, the same applies whenany subsequent report is created.B. CREATE A NEW REPORTFORMULA ON THE PIPELINEREPORT.Incorrect: Creating a formula does not changewhich opportunities are visible.C. UPDATE THE REPORT FILTER TOSHOW ALL OPPORTUNITIES.Correct. Using a filter to show allopportunities allows users with the View AllData permission enabled to see all of theopportunities on the report.D. CHANGE THE ORG-WIDEOPPORTUNITY SHARING DEFAULTTO PUBLIC READ.Incorrect. This would allow everyone in theorganization to see opportunities.4
Administrator Certification Prep: Reporting and AutomationScenario 4What should an administrator configure to provide each sales rep a dashboard that shows theircurrent Opportunity pipeline?FEEDBACKANSWERA. SET A DASHBOARD FILTER TOTHE CURRENT USER.Incorrect. Setting the dashboard filter to the currentuser would only show opportunities for that user,not the user running the dashboard.B. CREATE A DASHBOARD FOLDERFOR EACH USER.Incorrect. Creating a dashboard folder for eachuser would not filter the dashboard for users. Adashboard folder is for storing dashboards, limitingvisibility to the dashboards in the folder.C. FILTER THE DASHBOARD WITH ADYNAMIC VIEW SET TO THE VP OFSALES.Incorrect. Dynamic dashboards are limited. TheView Dashboard As options are: Me Another person Dashboard viewerD. SET THE DASHBOARD RUNNINGUSER TO “THE DASHBOARDVIEWER.”Correct. This ensures that the dashboardshows data relevant to only the user viewingit.5
Administrator Certification Prep: Reporting and AutomationScenario 5A sales user wants to add components to their dashboard.What is the maximum number of components that can be added to a single dashboard?FEEDBACKANSWERA. 3Incorrect. Each dashboard can have up to 20components. Each report can have up to 3 crossfilters.B. 15Incorrect. Each dashboard can have up to 20components.C. 20Correct. Each dashboard can have up to 20components.D. 50Incorrect. Each dashboard can have up to 20components. A dashboard filter can have up to 50values.6
Administrator Certification Prep: Reporting and AutomationScenario 6What should the system administrator do when users are unable to find a custom report type?FEEDBACKANSWERA. MAKE SURE THE NEW REPORTTYPE IS DEPLOYED.Correct. Users are not able to access a customreport type if it hasn’t been deployed.B. MAKE SURE THE USER PROFILEINCLUDES THE REPORT TYPE.Incorrect. Access to objects is controlled byprofiles not based on report type.C. ADD THE NEW REPORT TYPE TOTHE RELATED OBJECTS.Incorrect. Report types are created for the objectthat is reported on.D. ADD A BUTTON FOR THE NEWREPORT TYPE TO THE REPORTBUILDER.Incorrect. Report types are part of the ReportBuilder when deployed.7
Administrator Certification Prep: Reporting and AutomationScenario 7Ursa Major Solar uses a private data access model. Product managers and salesrepresentatives are in different branches of the role hierarchy.What should an administrator do to ensure that product managers can report on opportunities intheir product line?FEEDBACKANSWERA. CREATE A SHARING RULE BASEDON CRITERIA.Correct. Criteria-based sharing rulesdetermine what records to share based onfield values other than ownership.B. SAVE ALL OPPORTUNITYREPORTS IN A PUBLIC FOLDER.Incorrect. Saving reports in a public folder willgive access to everyone.C. MOVE ALL PRODUCT MANAGERSTO A ROLE BELOW THE SALESREPRESENTATIVES.Incorrect. If product managers are in a role belowsales representatives, they will not be able to seethe reports. Product managers would have to bein a role above the sales representativesaccording to the role hierarchy.D. CREATE A NEW ROLE FORPRODUCT MANAGERS AND SALESREPRESENTATIVES.Incorrect. Creating a new role would furtherseparate the role hierarchy. The productmanagers and sales representatives would notneed to be combined or branched off.8
Administrator Certification Prep: Reporting and AutomationExam Topic FlashcardsThe following flashcards cover reports, dashboards, and data sharing. Use these interactiveflashcards to brush up on some of the key topics you'll find on this part of the exam.Read the question or term on each card, then click on the card to reveal the correct answer.Click the right-facing arrow to move to the next card, and the left facing arrow to return to theprevious card.Question/TermAnswer/DefinitionWhat report should anadministrator use todisplay the number ofcontacts related to anaccount?Summary report with areport formulaTabular report with Rows toDisplay set to 10What are three reportsthat can be used todisplay a list of the top10 accounts on adashboard?Summary report with a chartSummary report without achartWhat should anadministrator do toorganize the fieldsavailable on a report?Create a custom report type.9
Administrator Certification Prep: Reporting and AutomationTabular ReportThis report is the simplestand fastest way to look atdata. Similarto spreadsheets, it consistsimply of an ordered set offields in columns, with eachmatching record listed in arow. Use this report type forcreating lists of records or alist with a single grand total.They can’t be used to creategroups of data or charts, andcan’t be used in dashboardsunless rows are limited.Examples include contactmailing lists and activityreports.Summary ReportThis report is similar to atabular report, but allowusers also to group rows ofdata, view subtotals, andcreate charts. It can be usedas the source report fordashboard components. Usethis type of report to showsubtotals based on the valueof a particular field, or whenyou want to create ahierarchical list, such as allopportunities for your team,subtotal by Stage andOwner.10
Administrator Certification Prep: Reporting and AutomationMatrix reports allow you togroup and summarize data byboth rows and columns. Theycan be used as the sourcereport for dashboardcomponents. Use this type ofreport for comparing relatedtotals, especially if you havelarge amounts of data tosummarize and you need tocompare values in severaldifferent fields, or you want tolook at data by date and byproduct, person, orgeography. Matrix reportswithout at least one row andone column grouping show assummary reports on thereport run page.Matrix ReportTwo kinds of report types: Standard report Custom reportStandard report type givesyou access to mostSalesforce data. For example,the opportunities report typegives you access toopportunity records and fieldsin your report.Report TypeCustom report type gives youaccess to custom objects inSalesforce, or custom viewsof standard objects, which anadmin configures.11
Administrator Certification Prep: Reporting and AutomationUse filter logic to customizehow existing filters apply to areport. Each filter isassigned a number. If you’dlike your report to returnrecords that meet the criteriaof Filter 1 and either Filter 2or Filter 3, use this filterlogic: Filter 1 AND (Filter 2OR Filter 3). Filter logicrequires at least one fieldfilter.Filter Logic12
Administrator Certification Prep: Reporting and AutomationRelated BadgesLooking for more information? Explore these related badges.BadgeContent TypeProjectCreate Reports and Dashboards for Salesand Marketing ManagersModuleReports & Dashboards for LightningExperienceModuleSales Reports for Lightning ExperienceSuperbadgeLightning Experience Reports &Dashboards SpecialistCongratulations! You’ve studied up on analytics—reports- and dashboards-related. Up next,dive into the exam section on workflow and automation. Let’s go!13
Administrator Certification Prep: Reporting and AutomationUnit 2: Study Up on Workflow and AutomationLearning ObjectivesAfter completing this unit, you will be able to: Identify the appropriate automation solution based on the capabilities ofworkflow/process.Describe and demonstrate capabilities and use cases for the approval process.Key Topic AreasThis unit prepares you for the workflow and automation section of the Salesforce administratorexam, which makes up 8% of the overall exam. This section of the exam tests these topics. Approval processesWorkflowsTime dependent workflowsApproval processesProcess BuilderLike the previous units, this unit contains practice scenario-based questions and flashcards.Exam Practice QuestionsReady to jump in? The sample tool below is not scored—it’s just an easy way to quiz yourself.To use it, read the scenario on the left side, then click on the answer you think is correct. Somequestions may have more than one correct answer. Click submit, and you get a pop-up tellingyou whether the answer you chose is correct or incorrect, and why. When you reach the end,you can review the answers or retake the questions14
Administrator Certification Prep: Reporting and AutomationScenario 1The administrator at Ursa Major Solar created a process in Process Builder that sends emailalerts when a high-priority case is created. A new support engineer who works remotelycomplains about not receiving the email alerts. All other users receive these email alerts.How can a Salesforce administrator troubleshoot this issue?FEEDBACKANSWERA. VERIFY THE USER’S EMAIL ADDRESS.Correct. Make sure the user’s ema
Salesforce data. For example, the opportunities report type gives you access to opportunity records and fields in your report. Custom report type gives you access to custom objects in Salesforce, or custom views of standard objects, which an admin configures.