Transcription
Using Health Center Dashboards for QualityImprovementMarch 1, 2016Sarah Vander Beek, DMDMartin Lieberman, DDS
Participants Will Be Able To: Understand the 15 measures that make upthe dashboard Review the principles of Quality Improvement Use the Dashboard to identify targeted areasfor improvement and develop improvementgoals Leave the session with a plan for next stepsto implement the Dashboard
Session Overview Quality Improvement Overview History of the Project How we use our Dashboard and why wewould never go back What are the 15 Oral Health Measures? How to Use the Online Dashboard & User’sGuide Develop operational definitions of themetrics Prioritize metrics for use within yourorganization
Our Quality Improvement JourneyDr. Vander Beek Neighborcare Health Mentorship via CDO/CEO Institute for HealthcareImprovement NNOHA– CHC partners External Partners Healthcare Home ConceptDr. Lieberman Private Practice Dentist Neighborcare Health Quality Improvement Institute for HealthcareImprovement IMPACT NNOHA Measure, Measure,Measure
Who Uses Dashboards? “Shorter, more focused dashboards that arereviewed on a frequent basis are associated withhigher performance. According to the results of thisdashboard analysis, hospitals that use dashboardswith fewer measures are more likely to be in thehigh-performance group, suggesting that higherperforming hospitals have developed dashboardsthat focus on areas they see as critical for quality.”Kroch et al. (2006)
Measure, Measure, Measure Managementtool Clinic Leadership Clinic SeniorManagement Board Telling our story7
Model for Improvement The Model for Improvement enables anorganization to approach qualityimprovement through rapid cycles of changeand continual feedback on the effectivenessof those changes. When used in conjunction with the ChronicCare Model, the Model for Improvement canlead to positive, sustainable changes in thequality of health care.
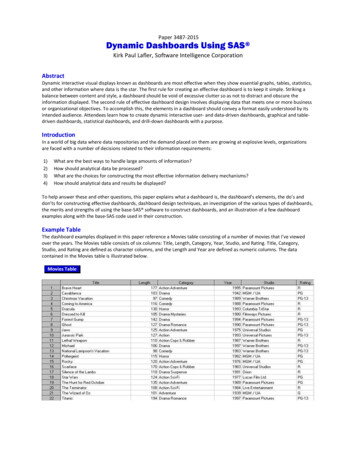
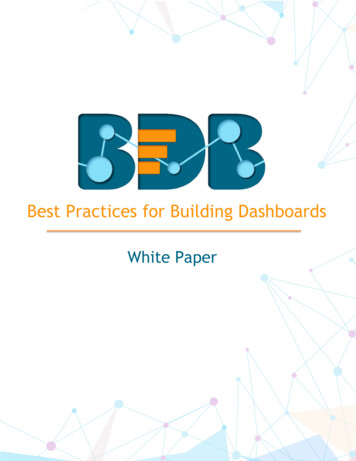
Quality Improvement (QI) An approach to the analysis of performance andefforts to improve it Measuring where you are, figuring out ways toimprove Data collected establishes “baseline” for an aspectof the dental program, and QI process developsmethods to improve from the baseline Avoids attributing blame Creates systems to increase/decrease outcome
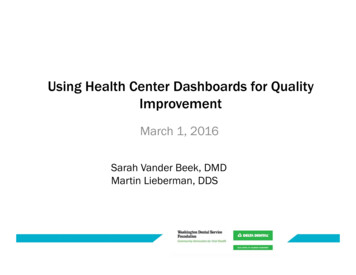
Profound Knowledge in ereBetterQualityOld Way(Quality Assurance)RejectdefectivesWorseAction takenon alloccurrencesBetterQualityWorseNew Way(Quality Improvement)
Opportunity for ImprovementDesiredThe GapActual Access to care (visit)Type of service (sealant)Cost (lower)Adverse patient event (latex allergy)Oral health outcomes (BP)
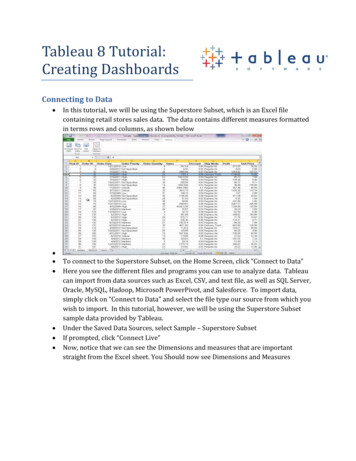
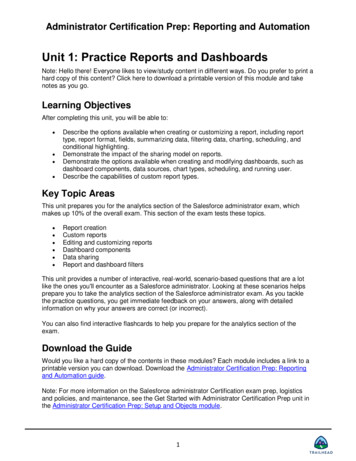
Plan-Do-Study-Act CycleIdeasActionLearning Demonstrate improvement What changes are to be made? What is the next cycle?Improvement Identify problems and createa planActPlanStudy Do Complete the data analysis Compare data to predictions Summarize what was learned Implement the plan Monitor and documentresults Begin analysis of the data
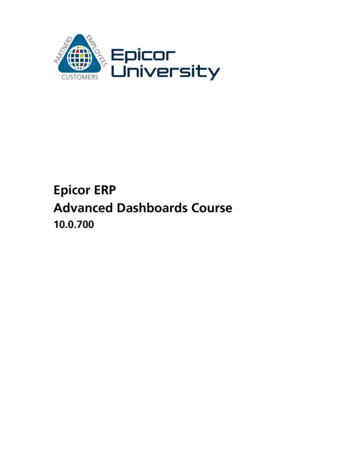
Using the Cycle to ImproveImprovementSpreadA PS DImplementation of ChangeWide-Scale Tests of ChangeIdeasA PS DFollow-up TestsVery Small Scale Test
What Do We Do Next ?
Use the Dashboard forQuality Improvement There are differing levels of capability toeffectively and efficiently use the data andimplement quality improvement plans Readiness questionnaire in the User’s Guide– designed to help you and your organizationthink through how to best use a dashboardbefore initiating its use.
Use the Dashboard forQuality Improvement Start small Establish baseline data for the DentalDashboard measures Develop specific goals Identify areas for improvement (don’t just watchthe dashboard, use the dashboard) PDSAs Over time, make course corrections Regularity
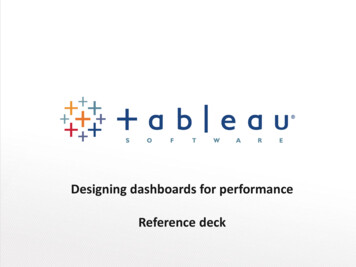
The “Triple Aim”ImprovedHealthImprovedCareReducedCost
Discussion
History Of The Project Delta Dental of Colorado Foundation andWashington Dental Service Foundation havebeen working with expert advisers to developa set of recommended oral health measuresfor High-Performing Health Centers. We have also developed an online,interactive tool to help Health Centers gatherdata for the measures.
DevelopmentParticipants from: CMSNNOHAInstitute for Oral HealthColorado and Washington CHCCHCs working on oral healthWA Dental Service FoundationDelta Dental of ColoradoFoundation
Vision For This WorkHealth Centers are sustainable, highperforming healthcare providers with strongoperations to ensure high productivity andhealth improvements (including oral healthimprovements) among their patients.
Quality Improvement And Data Health Centers are required to have an ongoingQuality Improvement/Quality Assurance (QI/QA)program that includes clinical services andmanagement. The QI/QA program must include: Clinical director who supports the QI/QA programand provision of high quality patient care Periodic assessment of the appropriateness of theutilization of services provided or proposed to beprovided to individuals served by the health center
Attention To DentalMetrics Expanding 1st Dental UDS Measure this year!National Quality Measures ClearinghouseCHIPRA Pediatric Quality Measures ProgramMeaningful Use measuresDental Quality AllianceHealthy People 2020National Committee on Quality Assurance HEDISNNOHANational Oral Health Quality Improvement CommitteeNational Quality ForumOregon Dental Quality Metrics Workgroup
How To Use TheOral Health Measures You cannot improve what you don’t measure. Selecting oral health measures places a value onoral health and focuses quality improvement effortstowards them. You do not need to select all 15 measures. Start with1-2 measures that are inline with your center’smission, your strategic plan, or parallel nationalstandards. Collect data regularly, share with the appropriatepeople, use the data to instigate action. Add additional measures when you’re ready.
Why Use A Dashboard Dashboards give a quick status updatefor key measures. They are a snapshot, not an in-depthanalysis. Regularly seeing the data makes itmuch easier to respond quickly toareas of concern, or to change coursesof action. Dashboards can be used to facilitatecommunication between departments,highlight successful strategies, tomaintain momentum in QI activities,and identify operational deficiencies. It is a tool to take action!
How Neighborcare Health UsesOur Dashboard And Why WeWould Never Go Back
Our Organization’s Dashboard Goal
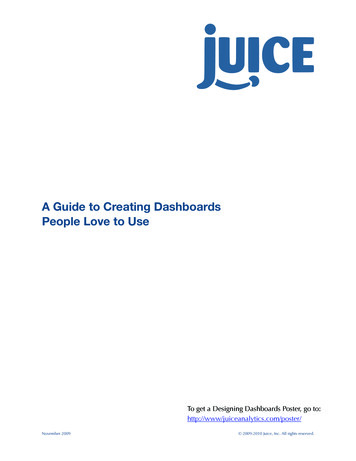
Dashboard (continued)Caries Rate, Self Management Goal Setting, and Self Management Goal Review 0-5 year 00%20.00%10.00%0.00%%No Risk%Low Risk%Medium Risk%High Risk%New Decay%SMGsCaries Rate, Self Management Goal Setting, and Self Management Goal Review 6 0.00%10.00%0.00%% No Risk% Low Risk% Medium Risk% High Risk% New Decay% SMGs
How We Use Our Dashboard Reviewed monthly by dental leadership team– Takes the temperature of each clinic and program– Highlight one achievement from last month and onearea of concern/focus for improvement– Share ideas with colleagues about metrics Has driven quality improvement projects– Examples: kids, supply costs, models Accountability and transparency– Currently clinic level data on report
Day-to-day Implementation Background data is collected via:– Automated reports– Weekly person reports (no show and enc/hour) See weekly productivity and no shows byprovider for closer monitoring On the portal for reference at any time Goals (no show, productivity, treatment plancompletion) are tied to dashboard
Best Practices Supply costs for clinics––––Process improvement teamDigging deeperFormularyLead DA duties and training No Show work started here––––Reminder callsRolling 5 week scheduleNew RDH model (pilot)Monitoring 3rd available
Possible Roadblocks Have to make sure the data is reliable– Example: RVU’s Hard to discover the “why” behind some dataand what the actionable item is– Example: Encounters per hour Too much data- not focused on what matters! Hard to get data out of EDR; measuresask and EDR cannot deliver
Advice Buy in Start small. If you do not currently utilize a dashboard,pick 1-3 measures If you are part of an organization with medical, what dothey measure? Why? Opportunity to build off theirmetrics Pick things that are not just easy to measure, but thatMATTER to you– The why. What gets measured, gets worked on Set goals- focuses people and providers– Clarity around expectations Work with your IT/BI team/program
The Dental Dashboard The Dental Dashboard is a set of measures thatis an optional tool for Health Centers to use aspart of their quality improvement program to – More effectively monitor and measure factors thataffect quality– Establish baselines for key measures– Set targeted improvements for individual measures– Develop methods to improve performance– Track improvements over time
The Dental Dashboard
①TREATMENT PLANCOMPLETION②CARIES AT RECALL
③RISK ASSESSMENT OF ALLDENTAL PATIENTS④ORAL EVALUATION AND/OR RISKASSESSMENT OF ALL PRIMARYCARE PATIENTS
⑤TOPICAL FLUORIDE⑥SEALANTS (6-9 YEAROLDS)
⑦SEALANTS (10-14 YEAROLDS)⑧SELF-MANAGEMENT GOALSETTING
⑨SELF-MANAGEMENT GOALREVIEW⑩GROSS CHARGES(PRODUCTION) PER ENCOUNTER
11) ENCOUNTERS PER HOUR12) NO SHOWS
13) DIRECT COST PER VISIT14) RECALL RATES
⑮ RECOMMENDATION TOFAMILY AND FRIENDS
How to Use the Online Dashboard &User’s Guide
Overview The Dental Dashboard combines twoprocesses: data entry and data charting.– The data entry system uses a browser-basedform to gather and store the data.– The data charting function uses Microsoft Excelto display the data graphically.
Getting Started System Requirements– Computer– Internet connection & browser– Microsoft Excel Requesting Access– ormation/dental-dashboard-access/– Fill out form– An email will be sent to you with invitation link– Click on invitation link
Login to tool Afl-enterprises.com/dentaldashboardapp
Data Entry Tool
Data Charting Tool
User’s Guide Complete instructions foraccessing the Dental Dashboardare included in the User’s Guide. The User’s Guide gives moredetails about:– How the recommended measureswere selected– Specifies the numerators anddenominators– What codes are needed to track themeasures– Tips for how to collect the data
Discussion/Questions
Develop operational definitions ofthe metrics Worksheet: If you don’t currently use a dashboard, thinkabout 3 measures you want to try. Fill out theworksheet.– What is the measure – how will you define it?– Why measure this? If you do use a dashboard think about ameasure you might want to add or expand– What is the measure – how will you define it?– Why measure this?
Breakout Session What metrics should you prioritize foryour organization?
Small Group Breakout Break into 3 Groups Appoint a presenter to share key themesdiscussed in your group Discussion Questions: What did you choose/What did you prioritize, Why choose these measures? Whatchallenges do you anticipate?
Debrief What are the most commonly selectedmetrics? Themes about the why? Major challenges? Did you come up with any solutions that youcould share with the larger group? Areas where you need more support?
Create a Balanced View
First any questions?
Wrap Up What is one thing (or the 1st thing) you willtry when you get back to work?
Contact InformationDashboard Questions:Debra A Schmidt MPH CHESProject Coordinator, NNOHAdebra@nnoha.org
Use the Dashboard for Quality Improvement There are differing levels of capability to effectively and efficiently use the data and implement quality improvement plans Readiness questionnaire in the User’s Guide – designed to help you and your organization think through how to best use a dashb