Transcription
Performance Dashboards:Measuring, Monitoring, andManaging Your Business
Wayne W. Eckerson Copyright TDWI, 2006WAYNE W. ECKERSON is theDirector of Research and Services forThe Data Warehousing Institute.Eckerson has 17 years of industryexperience and has covered datawarehousing and business intelligencesince 1995.Eckerson is the author of many indepths reports, a columnist for severalbusiness and technology magazines,and a noted speaker and consultant.Eckerson has recently written a booktitled, Performance Dashboards:Measuring, Monitoring, and ManagingYour Business (Wiley & Sons, 2005).He can be reached at weckerson@tdwi.orgSlide 2
Course Agenda1. Evolution of Performance Dashboards2. Why Performance Dashboards?3. What are Performance Dashboards?4. Architecting Performance Dashboards5. Case Studies7. Costs of Deployment8. How to Build Effective Metrics9. How to Design Effective Dashboard Screens10. Criteria for Evaluating Dashboard Products Copyright TDWI, 2006Slide 3
Appendices A - Performance Dashboard TrendsB- Readiness AssessmentC - How to Ensure AdoptionD - Performance Dashboard MarketSegmentationE – Sample Metrics Report Copyright TDWI, 2006Slide 4
Evolution of PerformanceDashboards Copyright TDWI, 2006Slide 5
The Business ChallengeDecision makers suffer from too much data . too little information delivered too late to make effective decisions. Copyright TDWI, 2006Slide 6
Evolution of a SolutionThe search for the perfect “business insight system”: 1980s– Executive information systems (EIS)– Decision support systems (DSS) 1990s– Data warehousing (DW)– Business intelligence (BI) 2000s– Dashboards and scorecards– Performance management 2010 ? Copyright TDWI, 2006Slide 7
Two MetaphorsDashboardPerformance ChartPerformance Dashboard Copyright TDWI, 2006Slide 8
Two ntelligenceS1.IntegratedDataRules and ModelsAcKnowledgeWce/Da n dsmr arrfo hboeP asDBI/4Data WarehousestionRe s , Dvis ecio isins ons,ct.AtaDaInformationstjudAAnalytical ToolszelyPlansDATA REFINERYnar/AReview, Measure, Refineit oonMDataActPlan3.Events2.s,an elsPlods,tset, M rgedgtsaBu cas s, TreveFo iatiitInWisdomtraMis steiogiOn,bjzeecVat ives luesSt,Iranc , G otegyenalstMap ivessSTRATEGYEXECUTIONPerformance Dashboards Copyright TDWI, 2006Slide 9
Corporate Performance MtsudjAcDatag,tniRioW e nrtoor vi s,polskf si Deotlo on ec, R BI)w, s isseyr(u,Di A ionueishossc ler seQus ts, ,aly WarnsioAtaansD3.1.2.Plans,an etsPlgs,aret,Tdgtsesas ativBucitireInFoteion,bjgiecVazetivluesesM,Ieanc , GoensualsretivsesSTRATEGYEXECUTION Copyright TDWI, 2006Slide 10
2000ÆWaves of Software AutomationEfficiencyFront-Office(Sales, Service, Marketing)Back Office(Manufacturing, Finance, Human Resources,Procurement, Logistics)Software/IT Enablers1985-20001990Æ(Customers, Supplies, Products))ERPPackagesCross-FunctionalValue ChainsSales FoAutoCall matiorceCam Cente n,pai r,Mgmt nessBusiness ActivitiesOperations Copyright TDWI, 2006Slide 11
Why Performance Dashboards? Copyright TDWI, 2006Slide 12
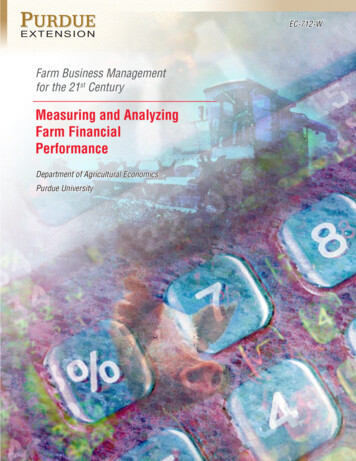
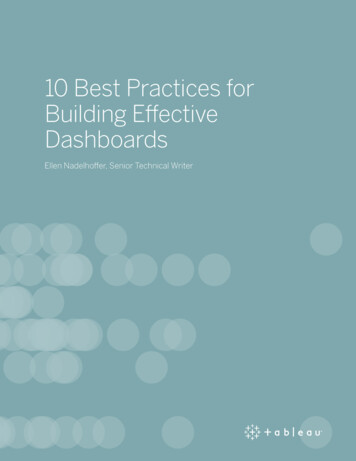
Status of PerformanceDashboardsNo plans,17%Underdevelopment33%Deployed,51%From Wayne Eckerson, “Development Techniques for Creating AnalyticApplications,” TDWI, 2005. Copyright TDWI, 2006Slide 13
Business Week Cover Story- February 13, 2006 Copyright TDWI, 2006Slide 14
Tactical DriversResonates with users Monitors status of several areas on one screenGraphical view of key metricsAlerts users to exception conditionsClick to analyze and drill to detailCustomized views based on rolePersonalized views based on interestNo training required! Copyright TDWI, 2006Slide 15
Tactical Drivers (cont.)Rich data Blends data from multiple sourcesBoth detailed and aggregatedBoth historical and real-timeEmpowers workers Focuses users on what’s really importantShows them how their contributions countMotivates with goals, competition, & incentivesDrives proactive intervention Copyright TDWI, 2006Slide 16
Strategic DriversAligns the business Everyone uses the same dataEveryone uses the same metricsEveryone works toward the same strategyImproves communication Tool for communicating strategyManagers & staff - collaborationAmong departments - coordinationImproves visibility and compliance Fewer surprises Copyright TDWI, 2006Slide 17
Strategic Drivers - The “Five Cs” e Copyright TDWI, 2006Slide 18
Agent of Organizational Change Copyright TDWI, 2006Slide 19
Charting a CourseGoalDirection without a Performance DashboardDirection with a Performance Dashboard Copyright TDWI, 2006Slide 20
What are Performance Dashboards? Copyright TDWI, 2006Slide 21
The “Three Threes” Three Applications Three Layers Three Types Copyright TDWI, 2006Slide 22
Three borationConvey performancestatus & trends at aglanceAnalyze exceptions andfind root causeCollaborate, plan,and ACT- Multi-paneled screens- Graphical metrics (i.e.dials, gauges, symbols)- Charts and tables- Status, trend, andthreshold indicators- Color-coded,conditional formatting- Alerts: Web-based,email, other- Drill down/uphierarchies- Pivot and swap outdimensions- Drill through tooperational data- Time series,segmentation, predictive,and other analyses- Reporting-Telephone-Meetings- Email (notification)- Annotations- Threadeddiscussions- Recommendedanalysis, actions- Publish to server- Workflow- Triggers, Updates Copyright TDWI, 2006Slide 23
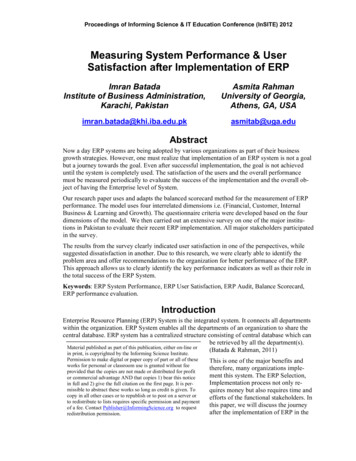
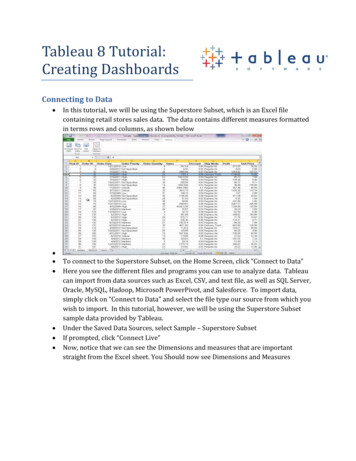
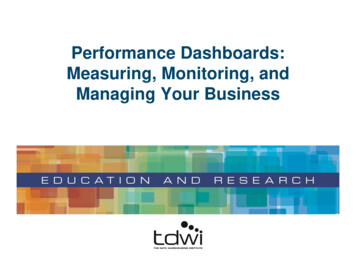
Three Layers of InformationReportingGraphs, Symbols, ChartsSummarized Dimensional DataDimensions, hierarchies, “slice/dice”Detailed, Operational DataDW queries, Operational reportsPerformance Dashboard Copyright TDWI, 2006Plans, models, forecasts, updatesAnalysisGraphical Abstracted DataPlanningMonitoringSlide 24
Dashboard Usage“Our executives will drill one or two levelsdown before they call someone who can fixthe problem, while our managers will oftendrill three or four layers down before theymake a call.”– Thomas Tomlinson, director of BI for BullMoose Tube, a steel manufacturer inChesterfield, MO. Copyright TDWI, 2006Slide 25
Dashboards vs Scorecards Distinct? Synonymous? Both?Rule of thumb:Use whatever term businessusers prefer! Copyright TDWI, 2006Slide 26
Dashboards vs ScorecardsDashboardScorecardPurposeMeasures current activityCharts progressUsersExecutives, managers, staffExecutives, managers, staffUpdates“Right time” feedsPeriodic snapshotsDataEventsSummariesQueriesRun against remote systemsRun against local data martDisplayChartsSymbolsDashboards and scorecards arevisual interfaces for monitoring business performance Copyright TDWI, 2006Slide 27
Three TypesOperationalTacticalStrategicFocusMonitor operationsOptimize processExecute rsSupervisors Managers Executives y/WeeklyMonthly/Quarterly“Looks like a ”“Dashboard”“BI Portal”“Scorecard” Copyright TDWI, 2006Slide 28
Pretenders to the throne– Too Flat“A prettified spreadsheet”– Too Isolated“Another spreadmart”– Too Manual“Not scalable or sustainable”– Too Cheap“You get what you pay for!” Copyright TDWI, 2006Slide 29
How Do You Architect aPerformance Dashboard? Copyright TDWI, 2006Slide 30
Three ArchitecturesBusiness ArchitectureBI ArchitectureData Architecture Copyright TDWI, 2006Slide 31
Business pliersRegulatorsObjectives Strategy MapProcessProjectsEducation GovernanceLeadingDisplaysDashboardBI ementData StoresIntegrationData SourcesODSLaggingMemory cacheCustom APILegacy SystemsEAIData warehouseEIIPackaged AppsDiagnosticData martsDirect queriesWeb nical ArchitectureMetricsBusiness ArchitectureStakeholdersPerformance Dashboard Copyright TDWI, 2006Slide 32
BI ArchitectureMonitoring LayerAnalysis LayerDimensions, hierarchies, “slice/dice”Reporting LayerManagement and operational reportsPlans, models, forecastsDashboards, scorecards, KPIs, AlertsPlanning LayerIntegrated BI CapabilitiesBusiness ArchitectureBI Platform (Analytic Server)- Common services, object model, API, file formats, etc.Data Delivery Architecture Copyright TDWI, 2006Slide 33
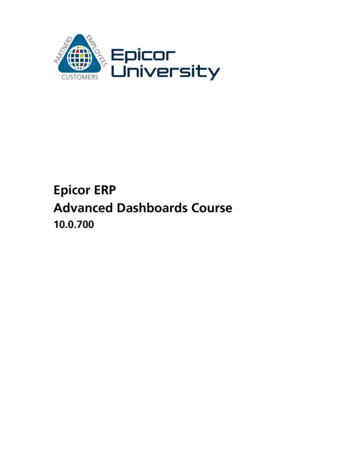
Data Architecture – Quicken mWebMessaging BackboneWebService(Enterprise Application Integration software)Data Warehouse(7 years of data)250CubesOLAP Cubes(7 years of data)Reporting &Analysis Tools Copyright TDWI, 2006ETLOperationalData StoreETLReal-time Store(2 days of data)(2 months of data)100CubesOLAP Cubes(2 weeks of data)Operational andTactical DashboardsSlide 34
Direct Query ArchitectureDataWarehouseData MartsScreen elementslinked directly toindividual queries Copyright TDWI, 2006MainframePackagedApplicationsQuery enginePhoneSystemReportsSpreadsheetsPros:- Deploy quickly- Low costCons- No depth, limited drill down- No dimensions- Hard-wired queriesSlide 35
Query and Cache ArchitectureDataWarehouseData MartsMainframePackagedApplicationsQuery EngineIn-memory or disk cacheQueries populate aqueryable cache Copyright TDWI, 2006PhoneSystemReportsSpreadsheetsPros:- Deploy quickly- Fast response- Rapid navigationCons- Static data setsSlide 36
BI Semantic LayerDataWarehouseData DBCQuery EngineSemanticSemantic SemanticSemantic SemanticLayerLayerLayerLayerLayerBI tools providequery objects thatrepresent a databasein business termsfor users. Copyright TDWI, 2006ReportsSpreadsheetsODBCPros:- Abstract query objects- Dimensionalized viewsCons- Generic ODBC connections-Primarily historical data in DWSlide 37
Federated Query ArchitectureDataWarehouseData MartsAn EII tooldynamicallyqueries data frommultiple sourcesto populate screenelements. Copyright TDWI, buted Query Engine/EIISemantic LayerReportsSpreadsheetsPros:- Multiple sources- Semantic layer abstraction- Quick to deploy- Prototype before you persistCons- No history- Data quality issues- ComplexitySlide 38
Data Mart ArchitectureDataWarehouseData MartsDashboardqueries its ownpersistent datamart loaded inbatch. Copyright TDWI, sSpreadsheetsETLDimensionalized Data Mart(OLAP or star schema)Query engine and semantic layerPros:- Multiple sources- Dimensional model- Historical context- Fast complex queriesCons- No right time data- Non-integrated?Slide 39
Event-driven lSystemsOutputsSQL/Stored ProceduresOperational DashboardData Capture, Data Aggregation, Metrics Management,Event Detection, Rule Processing, Agents/TriggersHistorical ContextEnterprise Service BusOperationalSystem Copyright TDWI, eInputsSlide 40
“Manual” ArchitectureUse when . Data doesn’t exist Strategy is short-term Want to prototype the KPIs Executives can’t waitBut don’t be fooled Permanent prototypes No scale, depth, value Reputations on the line! Copyright TDWI, 2006Slide 41
Performance DashboardCase Studies Copyright TDWI, 2006Slide 42
Operational Dashboard Case- Quicken Loans The largest U.S.-based online lender– 12 billion in loans in 2004, 2,500 employees– Sells mortgages via call center and Web Web Call Center in Livonia, Michigan– 500 “mortgage lenders” on one giant floor– Disruptions costs millions of dollars an hour Copyright TDWI, 2006Slide 43
Situation Company philosophy/culture– What gets measured, gets approved– Leverage “velocity as a competitive problem” Information systems – pre-2002– Reports run off operational systems Run slowly, Deliver obsolete data– Disjointed data for historical analysis Took three weeks to do 18-24 month analysis– Executives and users very frustrated! Negative view of data warehousing/OLAP Copyright TDWI, 2006Slide 44
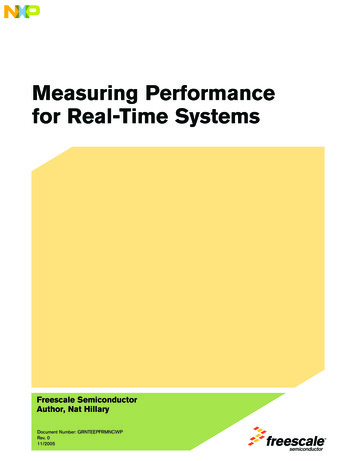
Solution Right-time data warehousing architecture– 1 year at 1 million– Trickle fed OLAP cubes– Existing ESB Different dashboards for different users––––Dashboard ticker – mortgage specialistsKanban reports – Sales managers, TV monitorsManagerial dashboards – Call center managersAnalytical dashboards/BI tools – Analysts Metrics– Phone statistics, Number and quality of leads, Salespipeline, Web traffic, Commissions, products mix Copyright TDWI, 2006Slide 45
Quicken Loans neSystemWebMessaging BackboneWebService(Enterprise Application Integration software)Data Warehouse(7 years of data)250CubesOLAP Cubes(7 years of data)Reporting &Analysis Tools Copyright TDWI, 2006OperationalData StoreETLETLReal-time Store(2 days of data)(2 months of data)100CubesOLAP Cubes(2 weeks of data)Operational andTactical DashboardsSlide 46
Dashboard TickerPersonal and groupmetrics updated dailyPersonal and groupmetrics updated instantlyPersonal forecasts updatedevery 15 minutes Copyright TDWI, 2006Slide 47
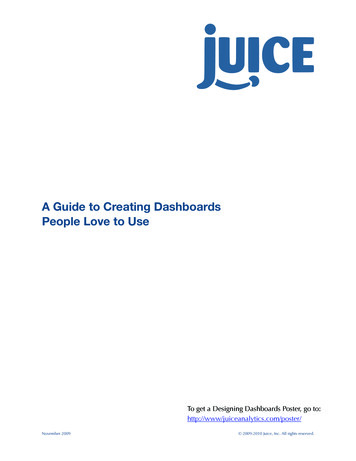
Kanban ReportMetric 1Metric 2Metric 3Metric 4Metric 5Metric 6Metric 7Metric 8Metric 9Employee 1Employee 2Employee 3Employee 4Employee 5Employee 6Employee 7Employee 8Employee 9Employee 10Employee 11Employee 12Employee 13Employee 14Employee 15Employee 16Employee 17 Copyright TDWI, 2006Slide 48
Managerial Dashboard Copyright TDWI, 2006Slide 49
Tactical Dashboard CaseInternational Truck and Engine 9.7 billion manufacturer of trucks, buses,diesel engines, and parts based in Illinois Key business
Three Layers of Information Detailed, Operational Data DW queries, Operational reports Summarized Dimensional Data Dimensions, hierarchies, “slice/dice” Graphical Abstracted Data Graphs, Symbols, Charts Performance Dashboard Monitoring Analysis