Transcription
UiPath Tableau DashboardsTable of ContentsIntroduction: UiPath Analytics Data Flows . 2Data Source and standard connection . 3Data Flows and Refresh . 3Incremental Refresh details – please read . 4Duplicate jobs / queue items created by Incremental Refreshes . 4Incremental Refreshes and Full Refreshes . 4Using Tableau as a monitoring tool . 4Step-by-step Tableau Dashboards setup . 5Contents of the UiPath Tableau Dashboards package: . 5Instructions: . 5Step 1: Create View in SQL Server . 5Step 2: Import and save the pre-packaged dashboards, as well as the Excel file containing the dummy sourcedata: . 5Step 3: Open the Tableau file and create in it a new data source: . 6You will need Tableau Desktop installed on your computer. Double-click on the Tableau file to open it. . 6Click on any of the dashboard tabs; the charts that are displayed contain dummy data that will need to bereplaced. . 6-In the Data menu at the top left select "New Data Source" . 6Step 4: Set up the Refresh configuration of the new data source: . 7Step 5: Switch the data source of the Tableau file with the newly created one:. 8Step 6: Delete the references to the original dummy data file: . 9Step 7: Save the new Tableau Dashboard: . 10Step 8: Publishing the Extract and the Dashboard: . 10Data Dictionary for Jobs and Queues data sets . 10
Introduction: UiPath Analytics Data FlowsThis document describes the Reporting and Analytics for Orchestrator from the data, data flows andimplementation points of view, and provides a step-by-step set of instructions to deploy the describedfunctionality using your existing Tableau environment.Why reporting and analytics using off-the-shelf BI (Business Intelligence) tools? Take advantage of and leveraging existing BI/Analytics architecture and knowledge Easily blend RPA data with external data Handle large volumes of data (weeks-months) with minimal impact on Orchestrator functionality Leverage high-performance data engine and user-friendly building tools Lightweight: easy to implement and customize
Data Source and standard connectionThe primary data source is Orchestrator’s SQL Server database, specifically the operational tables used formanaging the Jobs and Queue Items, among others.Since the Orchestrator DB schema changes potentially for every update, external BI systems can get the data froma SQL Server Views that abstract the UiPath data model and provides a standardized data pipeline for the BIreporting tools. These Views are implemented in the database after every Orchestrator update, by running aspecific SQL script (provided after each upgrade).The advantage of using this setup is that it hides the database schema complexity and changes, and exposes astandard, documented data model and set of KPIs.Data Flows and RefreshOnce the Views are saved in the SQL Server database, the data can be easily extracted and added to existingsystems. To minimize the load on the Orchestrator Database, it is extremely important that the same data isqueried as few times as possible (ideally only once), which is possible by using the Incremental Refresh method.This method uses a timestamp field containing the last time a record was modified, and only retrieves the recordsthat have changed since the last time the database was queried.There are several options for the data flow setup:1. Direct connection (SQL Server Tableau), using Tableau Extracts and Tableau’s Incremental Refreshfunctionality2. Use a secondary Operational Data Store (SQL Server ODS Tableau). In this case, you will need tomanage the Incremental Refresh for the first step to avoid overloading Orchestrator.NOTE: You can also use flat or Excel files extracts as data sources if none of the options above is feasible,however try to limit the number of rows queried and to run the query during a time when Orchestrator is notheavily used. In all cases, the system should use the Views described in the previous section.The direct connection setup has been built and tested to minimize the load on the SQL Server database, whichhas not been designed as a reporting database. Ideally, the Tableau data engine should connect to a "mirrorDB" as described here: n-availability-groups-sql-server?view sql-server-2017 , especially if youhave a high volume of transactions on the database. This setup takes advantage of the high-performanceTableau Data Engine by using data extracts and querying every piece of information only once (by usingincremental refresh), while maintaining enough history for meaningful analysis. Configuring the Tableauextracts and refresh schedules as described in the step-by-step instructions is critical for optimal functionalityand avoiding Orchestrator problems.
Incremental Refresh details – please readThe timestamp field used for Incremental Refresh is called “Last Modification Time” in Tableau(lastModificationTime in the SQL Server views). When you set the Incremental Refresh in Tableau, you have theoption to pick the timestamp field for it. If you select the option of using an Operational Data Store as anintermediate step, you need to set up your ETL process to do something similar, to minimize the queries on theOrchestrator database.Incremental Refreshes in Tableau in conjunction with the “Extract” option for the data source (rather than the“Live” option). Setting up the “Live” connection in Tableau for a data source will bring all data every time the userrefreshes the report, which could potentially cause Orchestrator problems.More details here: /en-us/extracting refresh.htmDuplicate jobs / queue items created by Incremental RefreshesSince all records that have changed since the last refresh are added to the Tableau extract, it is very likely thatolder versions of some records will appear in the extract. For example, a job will appear as Pending, thenpotentially as Running, finally as Successful or Failed. Only the most recent record for the job should be used forreport, so all default Tableau visualizations have a filter on a calculated binary field “Last Rec” that flags thoserecords and eliminates from the report older versions of the same job (or Queue Item).Please check that every Jobs and Queue Items visualization has the “Last Rec” filter enabled and set to True.Incremental Refreshes and Full RefreshesWe suggest setting up the Incremental Refresh frequency to hourly or half-hourly for normal reporting andanalytics utilization. A full refresh can be scheduled weekly (during low load periods like week-end nights) or every2 weeks.Using Tableau as a monitoring toolWe do not encourage using the above described setup for short-term monitoring of jobs. Using incremental refreshand extracts, you can set up Tableau refreshes as often as every few minutes (using the tabcmd utility), however wecannot guarantee the stability of the system.
Step-by-step Tableau Dashboards setupContents of the UiPath Tableau Dashboards package:1.2.3.4.SQL script for adding Views to the SQL Server databaseTableau default dashboardsExcel file containing the mock data (current data sources for the provided dashboards)DocumentationInstructions:Step 1: Create View in SQL ServerUse the SQL code in script file to create the views. Please make sure you are using the script version correspondingto your Orchestrator version.Then, for each of the dashboards you want to import, follow the next steps:Step 2: Import and save the pre-packaged dashboards, as well as the Excel file containing the dummysource data:Download the necessary dashboard(s) from the link/repository provided and save them to your computer. Do thesame for the dummy data Excel file that you will be prompted to point to when you open the dashboards' datasource. Save the Excel file on your computer and point to it whenever Tableau asks for the original data sourcelocation. You will only need it until you switch to the SQL Server data source.
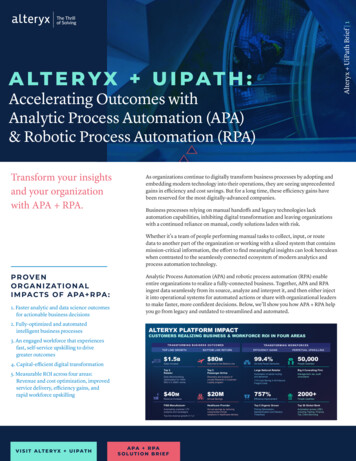
Step 3: Open the Tableau file and create in it a new data source:You will need Tableau Desktop installed on your computer. Double-click on the Tableau file to open it.-Click on any of the dashboard tabs; the charts that are displayed contain dummy data that will need tobe replaced.-In the Data menu at the top left select "New Data Source"-Select Microsoft SQL Server from the listInsert the server name, database name and the authentication information in the connection windowthen click Sign In. If the information is correct and you have access to the database, you should get anempty table with the database name at the top.From the tables/views list on the left, click and drag the view with the required name (for ex.Jobs BI View) into the blank area at the top of the page:-
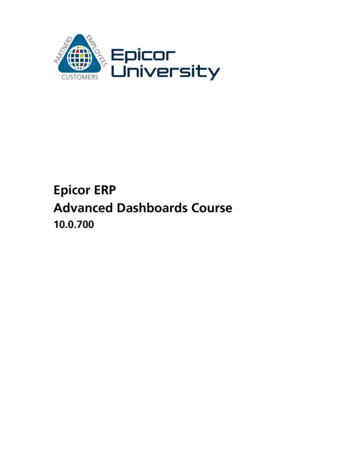
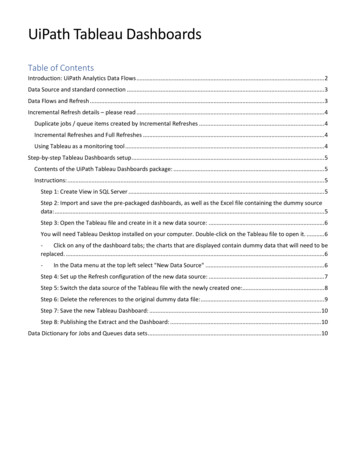
Step 4: Set up the Refresh configuration of the new data source:To minimize the load on the database and to use the power and speed of the Tableau data engine, we need tostore the queried data into Tableau extracts. Also, these extracts must be set up for Incremental Refresh, whichmeans that only the rows that have been modified since the last query are retrieved from the database.-At the top right of the page, set the Connection setting to Extract then click Edit to open the Edit dialogSet the Number of Rows setting to All RowsCheck the "Incremental Refresh" box and set the identifying column name to "Last Modification Time".Then click OK to close the dialog box.-If you need to bring more than one data source into a dashboard, you need to perform steps 3 and 4completely for each new data source you are creating. Bringing more than one view at a time asexplained in the last part of step 3 will create unwanted joinsAlthough the refresh is incremental, the first one will bring the full data set, and should be done duringa low activity period. Also, consider querying only part of the data (the most recent x months) usingfilters.NOTES:-
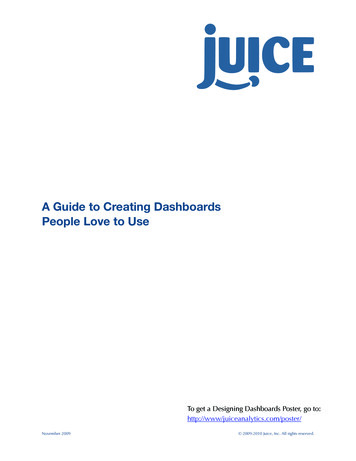
Step 5: Switch the data source of the Tableau file with the newly created one:Select any visualization tab (not a dashboard one) by clicking on a visualization in the dashboard, then clicking onthe "Go to Sheet" button at the top left (or right). This should open the hidden visualization.In the top menu of the newly displayed visualization, click on the "Data" item and click on "Replace Data Source".The Replace Data Source should appear:-In the Replacement field, select the new data source you have just created then click OKGo back to any Dashboard tab and check that the visualizations look OK.NOTE: While switching the data source, some of the legends and colors might get reset; this is a known Tableauissue. You will need to adjust those manually.
Step 6: Delete the references to the original dummy data file:Go to the Data Source tab of Tableau (left hand side).In the upper part of the Tableau window, select the original data source the one you have replaced by the SQLServer view and select it. (FYI: for Jobs you will see JobsDB and for Queues you will see QueueDB)Then, in the "Data" menu, click on "Close Data Source".Alternatively you can right click the old data source and click the “close” option (which will remove the link fromthe dashboard to the old data source).
Step 7: Save the new Tableau Dashboard:In the File menu, click on Save As and give the file a meaningful name. In the lower part of the window, select thefile type .twbx (which already contains the data in it) and click OK.Step 8: Publishing the Extract and the Dashboard:Once you have connected the dashboard to your SQL Server, you need to deploy it from Tableau Desktop toTableau Server. You will find information about this topic on the Tableau website, however here are a few hints:--It is much better to export the extract separately to Tableau Server, then the dashboard (this willautomatically set the data source for the local file to the extract on the Tableau Server). Have allanalysts work on the extract. The alternative, exporting the packaged bundle (Tableau file Extract)risks to duplicate the extracts and overload the database. This will ensure only one extract is queryingthe database, regardless of how many Tableau analysts are using the data.Set up a suitable refresh schedule for the extract. Incremental refreshes every 15 minutes (or evenevery hour) should work fine. You can also schedule full refreshes during week-ends etc.Note: Process has to be repeated for both the Jobs and Queues dashboards, in order to have the 2 dashboardsconnected to your Orchestrator database as data source.Data Dictionary for Jobs and Queues data setsIn the below tables the datasets that are contained in the specific views created in the database are described. Thefields in black are native and are extracted directly from the Orchestrator database and the blue fields are derivedfields calculated through the views definitions, mostly KPIs that are tracked in the dashboards.JobsField NameJob IdJob KeyJob StartJob EndQuery TimeJob StateJob TriggerJob InfoJob CreatedLast Modification TimeOrg Unit IdRelease IdDescriptionDB primary key of the jobUnique key for job, can be used for joining with external dataTimestamp of the start of the job, in Orchestrator local timeTimestamp of the end of the job, in Orchestrator local timeTimestamp of the time the SQL Server query was actually ran (for all practicalpurposes, this should be considered the report time)Any of the following: 'Pending', 'Running', 'Canceling', 'Terminating', 'Failed','Successful', 'Canceled'Manual' or 'Scheduled'Free Text field, used for finished jobs to add more information about theoutcome (especially non-successful situations)Timestamp of the moment the job was created in the databaseTimestamp of the most recent time the job record has been changed. This isused for incremental refresh purposes, to avoid duplicatesId of the organization unit the job belongs toDB primary key of the release of the process being ran
Process NameUnattended FlagRobot IdRobot NameMachine NameUser NameRobot TypeTenant NameEnvironment NameStDev Dur ProcHrsAvg Dur PendingHrsFinishedExecDuration OutlierLast RecGantt Filteris successfulsuccessful%Avg Process Duration (h)JobPendingHrsJobDurDaysGanttJob Duration (h)Hours Robot DayJob State2Max Query TimeName of the Process. More than one release can share the same ProcessNameBinary flag for Attended / Unattended robotsDB primary key of the robot which ran the jobUser-given name for robot. Can have duplicates (more than one Robot Id forone Robot Name)Identifier for the computer on which the job was runIdentifier for the Windows User for which the job was runIdentifier for the computer on which the job was runName of the Orchestrator tenant in which the job has been (or will be)executedName of the environment in which the job has been (or will be) executedAggregate: Standard deviation of the job duration, computed separately foreach Process Name (will aggregate all releases that share the same ProcessName)Aggregate: Average of the "pending time" for jobs, computed separately foreach Process Name (will aggregate all releases that share the same ProcessName). Time in pending Job Start - Job CreatedBinary flag marking whether a job has finished executionEqual to 1 if the duration of a job is more than 2 standard deviations abovethe average duration for that specific Process Name. In this situation, theduration of the job is equal to JobDurDaysGantt (includes jobs that were stillrunning at time of the query, see definition below). Is used to flag jobs thatmight be "frozen" or waiting for an input from the user. Otherwise, it is NULL.Binary flag marking whether a certain record is the most recent in thedatabase, for each specific jobs. Due to the incremental refresh mechanism,the data set might have more than one record for each job, and only the mostrecent one must be used for reporting. All visualizations MUST have this fieldas a filter, otherwise the same job might be counted multiple times.Binary flag marking all the jobs that have started within 24 hours of the querytime. Used for the jobs Gantt ChartBinary flag marking whether a job has successfully finished executionAggregate: percentage of successful jobs out of all finished jobsAggregate: Average job duration, computed separately for each ProcessName (will aggregate all releases that share the same Process Name)Time (in hours) between the moment the job was created and when itactually startedFor finished jobs, the difference between the start and the end of the job. Forcurrently running jobs, the difference between the start of the job and thequery time. Unit daysFor finished jobs, the difference between the start and the end of the job. Forcurrently running jobs, the difference between the start of the job and thequery time. Unit hoursAggregate: for each robot and for each day, the total duration in hours of alljobs that started during that dayDuplicate of the Job State field, needed for technical reasons :)Equal to the time the DB query was run last time
QueuesField NameQueue NameQueue IdTenant NameRobot NameRobot IdMachine NameUser NameOrg Unit IdItem IdTransaction KeyItem PriorityTransaction StatusReview StatusTransaction StartTransaction EndQuery TimeLast Modification TimeRetry NumberSeconds Prev AttemptsItem CreatedItem DataDeferred DateItem ReferenceHas Due Date FlagDue DateTransaction OutputException TypeException ReasonException DetailsException TimeExc. TypeTransactionDurSecFinishedExecStartedExecFirst Pass YieldDescriptionName of the queueDB primary key of the queueName of the Orchestrator tenant in which the job has been (or will be) ex
Contents of the UiPath Tableau Dashboards package: 1. SQL script for adding Views to the SQL Server database 2. Tableau default dashboards 3. Excel file containing the mock data (current data sources for the provided dashboards) 4. Documentation Instructions: Step 1: Create View in SQL Server Use the SQL code in script file to create the views.