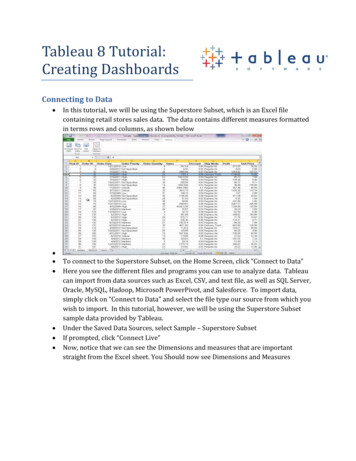
Transcription
Aware ServicesTableau Dashboards
Contents1.Sales Current Events . 31.1. Dashboard . 31.2. Performance . 42.Sales Analysis . 52.1. Dashboard . 52.2. Time Analysis . 52.3. Discovery . 63.Location . 73.1. Dashboard . 73.2. Map . 84.Marketing Code . 94.1. Dashboard . 94.2. Comparison . 94.3. Map . 105.Event Marketing Analysis . 115.1. Dashboard . 115.2. Capacity Achieved . 116.First Time Attendees . 136.1. Definition . 136.2. Dashboard . 136.3. Time Analysis . 136.4. Map . 146.5. Spend Distribution . 147.Customer Evaluation . 167.1. Dashboard . 168.Membership . 178.1. Dashboard . 178.2. Time Analysis . 188.3. Map . 189.Fund Raising . 209.1. Dashboard . 209.2. Time Analysis . 209.3. Map . 2110.Operator . 2210.1. Dashboard . 2211.Scanning . 2311.1. Dashboard . 231THE AWARE GROUP PTY LTD ABN 64 628 295 269 theawaregroup.com.au
12.Gift Voucher . 2312.1. Dashboard . 2412.2. Details . Error! Bookmark not defined.2THE AWARE GROUP PTY LTD ABN 64 628 295 269 theawaregroup.com.au
1. Sales Current EventsThis dashboard is dedicated to follow up ticket sales for upcoming events and how they aretracking towards tickets and revenue targets.1.1. Dashboard - https://vimeo.com/376267279The Sales Current Events dashboard provides with an overview of the sales for upcomingevents# Key Metrics Capacity TargetIt refers to the capacity target set up during the event build (event summary page).If the target is not set up, it is replaced by the total capacity for the event. Revenue TargetIf refers to the revenue target set up during the event build (event summary page).If the target is not set up, the target is calculated as follows:Sum (Average price across sales channel by ticket type * Number seats by ticket type) Revenue this monthTotal revenue for the current month Ticket this monthTotal ticket sold for the current month Days to Last PerfIt is the number of days from today to the last performance date of an eventThe list of events is sorted by the smallest to the largest number of days.# Key Visuals Target barsThe target bar colour goes:o from dark red for 0%o to dark green for 100%The background greys represent the 50 and 100% mark. Sales line chartThe dotted lines represent the sales trends for revenue and sold tickets.3THE AWARE GROUP PTY LTD ABN 64 628 295 269 theawaregroup.com.au
1.2. Performance - https://vimeo.com/376267298The Performance report provides insights on the sales towards the targets for the event andeach performance dates.# Key Metrics Tickets to TargetIt represents to the remaining number of tickets to sold to meet the capacity target.For each performance date, the target is calculated as follows:Event Capacity Target / Number of Performance Dates Revenue to TargetIt represents the remaining total revenue to generate to reach the revenue target.For each performance date, the target is calculated as follows:Event Revenue Target / Number of Performance Dates Days to Last PerformanceIt reflects the number of days from today to the last performance date Daily Tickets TargetIt represents the number of tickets to sell per day to reach the capacity target and iscalculated as follows:Tickets to Target / Days to Last Performance Daily Revenue TargetIt represents the revenue per day to generate to meet the revenue target and iscalculated as follows:Revenue to Target / Days to Last Performance# Key Visuals4 Ticket and revenue targetsThe grey band above the area charts represents the revenue target Tickets and revenue to targetThe tickets and revenue to target is reflected by the white band below the targetband.If the area chart crosses the target band, it means the target was metTHE AWARE GROUP PTY LTD ABN 64 628 295 269 theawaregroup.com.au
2. Sales AnalysisThe Sales Analysis allows to reflect on past and upcoming events.2.1. Dashboard - https://vimeo.com/376267196The dashboard offers an overall view of the sales broken down by the main features such assales channel or event category.# Key Metrics RevenueIt represents the total revenue across all the events TicketsIt represents the total number of tickets soldThe yield is calculated as follows:Total Revenue / Number of Tickets Unique CustomersIt represents the total number of unique customers who purchased a ticket to aneventThe yield is calculated as follows:Total Revenue / Number of Unique Customers EventsIt represents the total number of eventsThe yield is calculated as follows:Total Revenue / Number of Events2.2. Time Analysis - https://vimeo.com/376267261The time analysis provides with a view of sales over time and on a hour by day basis.# Key MetricsSee 2.1. Dashboard above# Key Visuals Sales by HourThe cell colour goes:o from white for 0 o to orange for the maximum revenueConsequently:o5the most performing days and hours can be easily identified by spotting outthe orange cells or regionsTHE AWARE GROUP PTY LTD ABN 64 628 295 269 theawaregroup.com.au
oUnderperforming days and hours can be identified by the white cells orregions2.3. Discovery - https://vimeo.com/376267243The Discovery report allows to compare different dimensions such as event category or saleschannel on a revenue and ticket prospective at one glance.# Key Visuals Position of the data pointso A point located at the right of another point generated more ticketso A point located higher up than another point generated more revenueo A point located at the right and higher up than another point generated moretickets and more revenue Pattern and ticket yieldo If 2 points are vertically aligned, they are generating different revenue for thesame number of tickets: the ticket yield of the highest point is betteroIf 2 points are horizontally aligned, they are generating the same revenue witha different number of the tickets: the ticket yield of the furthest point is lower2.4. Detailed Report - https://vimeo.com/3762672226THE AWARE GROUP PTY LTD ABN 64 628 295 269 theawaregroup.com.au
3. LocationThe location reports provide insights about the source of revenue from a geographicalprospective.3.1. Dashboard - https://vimeo.com/376267109The dashboard provides an overview of the revenue by postcode.# Key Metrics PostcodesNumber of unique postcodes generating revenue. New PostcodesNumber of postcodes which generate revenue for the first time during the selectingpurchase period. Postcode YieldAverage revenue generated by postcode RevenueTotal revenue generated by all the postcodes Unique CustomersTotal number of unique customers who purchased a ticket New CustomersTotal number of new customers TicketsIt represents the total number of tickets sold# Key Visuals Top 10 PostcodesThe bar colour goes:o from dark blue for 0 of revenueo to orange for the maximum revenueIdentifying the best performing postcodes consists of spotting out the orangepostcodes on the map7THE AWARE GROUP PTY LTD ABN 64 628 295 269 theawaregroup.com.au
3.2. Map - https://vimeo.com/376267164The Map report provides a larger map promoting a better reading.# Key VisualsRefer to 3.1. Dashboard.3.38Detailed Report - https://vimeo.com/376267135THE AWARE GROUP PTY LTD ABN 64 628 295 269 theawaregroup.com.au
4. Marketing CodeThe Marketing Code reports provide with insights on the performance of each marketingcodes4.1. Dashboard - https://vimeo.com/376266805The dashboard allows to get an overall prospective of the marketing performance.# Key Visuals Best performing postcode mapA unique colour is allocated for each marketing code on the map and matches thecolour from the bar chart.Hovering a marketing code from the bar chart will highlight the postcode on themap.If there isn’t any highlighted postcode, it means simply the marketing doesn’t score as#1 for any of the postcode: click on the bar to filter the map and reveal where themarketing code has been generating revenue from.4.2. Comparison - https://vimeo.com/376266748The Comparison report allows to compare the performance of marketing codes acrossmultiple dimension such as module or sales channel# Key Visuals 9Highlighted barsBy default, the size of bars only allows to compare marketing codes.Selecting one or more codes will show the revenues on top of the bars and highlightthe codes in each section allowing to easily compare the codes.THE AWARE GROUP PTY LTD ABN 64 628 295 269 theawaregroup.com.au
4.3. Map - https://vimeo.com/376266869The Map report provides a larger map promoting a better reading.# Key VisualsRefer to 3.1. Dashboard.4.410Detailed Report - https://vimeo.com/376266836THE AWARE GROUP PTY LTD ABN 64 628 295 269 theawaregroup.com.au
5. Event Marketing AnalysisThe Event Marketing Analysis reports provide insight on event performance.5.1. Dashboard - https://vimeo.com/376266423The dashboard provides an overall view on an event.# Key Metrics RevenueTotal revenue generated by the event TicketsTotal number of tickets soldThe yield is calculated as follows:Total Revenue / Number of TicketsThe percentage of capacity ref
The First Time Attendees reports provide with insights on the source of customers and their buying patterns. 6.1. Definition The concept of first-time attendees is applicable to an order (not a customer) and is calculated form 2 tables: Customer OrderSummary An order
