Transcription
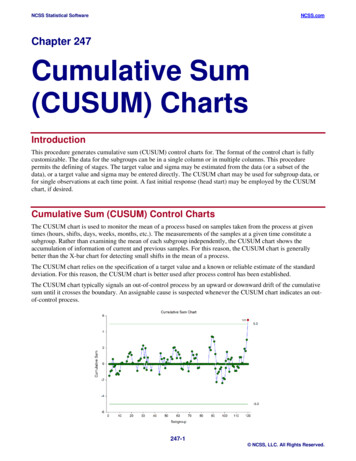
PLOS ONERESEARCH ARTICLEA new CUSUM control chart underuncertainty with applications in petroleumand meteorologyMuhammad Aslam ID1*, Ambreen Shafqat ID2, Mohammed Albassam1, JeanClaude Malela-Majika ID3, Sandile C. Shongwe ID41 Department of Statistics, Faculty of Science, King Abdulaziz University, Jeddah, Saudi Arabia,2 Department of Statistics and Financial Mathematics, Nanjing University of Science and Technology,Nanjing, Jiangsu, P.R. China, 3 Department of Statistics, Faculty of Natural and Agricultural Sciences,University of Pretoria, Hatfield, South Africa, 4 Department of Statistics, College of Science, Engineering andTechnology, University of South Africa, Pretoria, South a1111111111OPEN ACCESSCitation: Aslam M, Shafqat A, Albassam M, MalelaMajika J-C, Shongwe SC (2021) A new CUSUMcontrol chart under uncertainty with applications inpetroleum and meteorology. PLoS ONE 16(2):e0246185. : Dragan Pamucar, University of Defence inBelgrade, SERBIA* aslam ravian@hotmail.com, malbassam@kau.edu.saAbstractIn these last few decades, control charts have received a growing interest because of theimportant role they play by improving the quality of the products and services in industrialand non-industrial environments. Most of the existing control charts are based on theassumption of certainty and accuracy. However, in real-life applications, such as weatherforecasting and stock prices, operators are not always certain about the accuracy of anobserved data. To efficiently monitor such processes, this paper proposes a new cumulative chart under the assumption of uncertainty using the neutrosophic statisticsum (CUSUM) X(NS). The performance of the new chart is investigated in terms of the neutrosophic runlength properties using the Monte Carlo simulations approach. The efficiency of the pro chart is also compared to the one of the classicalposed neutrosophic CUSUM (NCUSUM) XReceived: October 31, 2020 chart. It is observed that the NCUSUM X chart has very interesting propertiesCUSUM X chart. The application and implementation of the NCUcompared to the classical CUSUM XAccepted: January 14, 2021 chart are provided using simulated, petroleum and meteorological data.SUM XPublished: February 4, 2021Copyright: 2021 Aslam et al. This is an openaccess article distributed under the terms of theCreative Commons Attribution License, whichpermits unrestricted use, distribution, andreproduction in any medium, provided the originalauthor and source are credited.Data Availability Statement: All relevant data arewithin the paper.Funding: The article was funded by the Deanshipof Scientific Research (DSR), King AbdulazizUniversity. The authors, therefore, thankful to DSRfor their technical and financial supports.Competing interests: The authors have declaredthat no competing interests exist.IntroductionControl charts play an essential role in monitoring processes in the production andmanufacturing sectors. Shewhart-type control charts are the most popular charts because of itssimplicity and attractive sensitivity towards large shifts in the process parameters. These chartsare widely applied in many fields and operations (such as manufacturing processes, health caremonitoring, stock exchange, credit card, financial fraud detection, weather updates, and internet traffic flow, etc.). However, Shewhart-type charts are inefficient in detecting small to moderate process shifts. Due to this drawback, researchers have developed new control chartsbased on classical and adaptive sampling designs to detect small-to-moderate process shifts asquickly as possible, including large shifts. Control charts are classified into memory-type (e.g.PLOS ONE https://doi.org/10.1371/journal.pone.0246185 February 4, 20211 / 16
PLOS ONECUSUM control chart under uncertaintycumulative sum (CUSUM), exponentially weighted moving average (EWMA), etc.) and memoryless (e.g. Shewhart-type) control charts; see for instance [1]. The latter uses only the latestinformation of the process to compute the charting statistics, which makes it less sensitive todetect small-to-moderate shifts, but enhances its ability to detect large shifts in the process.The first (i.e. memory-type control chart) uses both current and past information to computethe charting statistics, which makes it more sensitive in detecting small-to-moderate shifts andless sensitive in detecting large shifts in the process. The CUSUM and EWMA charts are themost popular memory-type control charts. To enhance the aforementioned charts, variousadvanced techniques are used including the addition of run rules, the use of variable samplinginterval (VSI) and variable sample size (VSS) sampling designs for adaptive charts. Among allthe advanced developments in the statistical process control (SPC) field, the CUSUM chart isan efficient alternative to the Shewhart chart when it comes to the detection of small to moderate shifts, see [1].Both memory-type and memory-less control charts are used to monitor and control thespread or location parameters in any process. The sensitivity of memory-type charts haveattracted the attention of many researchers and brought many more improvements in the SPCfield and management of many organizations. Due to the efficiency of the CUSUM andEWMA charts, many other control charts have been developed. Lucas and Crosier [2] incorporated a fast initial response (FIR) feature to the classical CUSUM and compared its performance to that of the classical CUSUM chart. Zhao et al. [3] developed a dual CUSUM schemewhich combines two CUSUM chart to detect a small shift in a process. Li and Wang [4] proposed an adaptive CUSUM Q chart also known as the self-starting approach. Shafqat et al. [5]introduced a linear prediction model based on the double EWMA control chart for non-normal situations for monitoring the location parameter. Haq [6] and Haq et al. [7, 8] proposedthe use of EWMA control charts to monitor various processes, i.e. the mean and varianceusing ranked set sampling and the mean under the effect of measurement errors using rankedset sampling. Sanusi et al. [9] introduced a different approach for the EWMA-based chartwhen supplementary information about the main variable is not constant. Some differentapplications of attributes and variables control charts can be found in [10, 11].The classical Shewhart control charts cannot be used efficiently when data are collectedfrom uncertain and random situations, or when there are inconsistencies in the collected data.Khademi and Amirzadeh [12] reported that “fuzzy data exist ubiquitously in the modernmanufacturing processes”; hence, in certain monitoring environments, ‘fuzzy model’ controlcharts are preferred when parameters or observations are uncertain, see for instance [13]. Senturk and Erginel [14] introduced the dispersion control chart by using the fuzzy logic, andFaraz et al. [15] proposed a control chart combining uncertainty and randomness assumptions. Smarandache [16] provided an overview of the fuzzy logic and reported that the neutrosophic logic deals efficiently with indeterminacy. In [17, 18], the neutrosophic logic is used todevelop the idea of the neutrosophic statistics. Neutrosophic statistics is an extension of theclassical statistics that is more efficient in analyzing data from ambiguous environment. Forpublications on neutrosophic statistics applied in various fields of knowledge, the readers arereferred to [19–21]. For non-normal processes, control charts with a fuzzy approach are discussed by [22]. Pereira et al. [23] designed a fuzzy chart for monitoring the blood componentsunder the violation of the normality assumption. The most recent research works on controlcharts that use neutrosophic statistics concepts, can be found in [24–28].At the best of the authors’ knowledge, there is no work on the CUSUM control chart under control chart using the neutrosophic staneutrosophic statistics. In this paper, the CUSUM Xtistical method is proposed. Following the reports in [16, 17], it is presumed that the proposedPLOS ONE https://doi.org/10.1371/journal.pone.0246185 February 4, 20212 / 16
PLOS ONECUSUM control chart under uncertainty chart will provide very interesting properties (i.e. will beneutrosophic CUSUM (NCUSUM) Xmore efficient in detecting a small shift in the process and more informative, flexible, andeffective in uncertain conditions).The rest of this paper is structured as follows: The second section gives a brief description chart and an introduction to the NCUSUM X control chart. In theof the classical CUSUM X chart is extensively investigatedthird section, the performance of the proposed NCUSUM Xin terms of the neutrosophic run length properties. Moreover, the performance of the pro chart. Fourth and fifth sections provideposed chart is compared with the classical CUSUM Xillustrative applications of the new chart using simulated and real-life datasets, respectively.The conclusion and recommendations are given in the last section.The CUSUM control chart chart for monitoring small and moderateThe classical CUSUM chart. The CUSUM Xshifts in the mean was first introduced by [29]. The two-sided CUSUM chart is used to monitor upwards and downward shifts in the process parameters using the charting statistics Ciþand Ci , respectively, where i represents the sample number (or sampling time). Assume that Xis a sequence of independent normally distributed observations given that the in-control mean chart (i.e. Ciþ andμ0 and variance s20 ; thus, the charting statistics of the two-sided CUSUM XþCi , with C0 ¼ C0 ¼ 0) are plotted versus a single control limit denoted by H. These chartingstatistics are mathematically defined by( i ðm0 þ KÞ þ Ciþ 1 Ciþ ¼ max½0; X;ð1Þ i þ Ci 1 Ci ¼ max½0; ðm0 KÞ X is the sample mean, μ0 is the target mean value of X and K is the reference value. Thewhere XCUSUM chart depends on two singleton parameters, i.e. K and H, which need to be selectedcarefully because the sensitivity of the CUSUM chart depend on them, see pages 404–405 ofMontgomery [1]. These parameters are chosen such iqffiffiffiffiffiffiffiffiffiffiffiffiffiffiffi and H ¼ h VarðXÞ ;K ¼ k VarðXÞð2Þ ¼ s2X n; s2X is the variance of X, k is selected to be half of the shift (i.e. k ¼ d 2 ,where VarðXÞwith δ is the shift in standard deviation units) and h is usually selected to be approximately fivetimes the standard deviation units. Note that the process has moved upwards if Ciþ H forany value of i; however, if Ci H, the process has moved downwards. chart is introduced using the frameworkIn the next sub-section, the proposed NCUSUM X chart.of the classical CUSUM XThe proposed neutrosophic CUSUM chart. In the uncertain environments havinginconsistency data, the quality characteristic of interest (denoted by XNi) is not a deterministicvalue; hence, it falls within some interval, say [XLi, XUi], where the subscripts L and U refers tothe lower and upper bound of those particular values; for instance, XLi is a lower bound of XNiand XUi is the upper bound of XNi (i.e. XLi XNi XUi). The latter lower and upper notationholds for other expressions defined in this subsection. That is, the neutrosophic quality characteristic of interest XNi; XNi2[XLi, XUi], follows neutrosophic normal distribution with neutrosophic mean μ0N; μ0N2[μL, μU] and neutrosophic variance s20N ; s20N 2 ½s2L ; s2U , with μL μU Ni 2 ½X Li ; X Ui ,and s2L s2U . Hence, the sample mean of the variable XNi is given by X 2 Ni Þ ¼ sNi nN ; nN 2 ½nL ; nU with nL nU, σNi2[σLi, σUi] is the observed neutrosophicVarðXstandard deviation of XiN, with σLi σUi. Thus, the plotting statistics of the proposed NCUSUMPLOS ONE https://doi.org/10.1371/journal.pone.0246185 February 4, 20213 / 16
PLOS ONECUSUM control chart under uncertainty chart under uncertain environments is given byX8þþ Ni ðm0N þ KN Þ þ MNði MNi¼ max½0; X1Þ Ni þ MNðiX1Þ : MNi ¼ max½0; ðm0NKN Þð3Þþþwhere MNi2 ½MLiþ ; MUi , MNi 2 ½MLi ; MUi , KN2[KL, KU], HN2[HL, HU] and μ0N is the targetmean value. In addition, μ1N μ0N δσ0N, where μ0N2[μ0L, μ0U] and μ1N2[μ1L, μ1U] representsthe in-control and out-of-control neutrosophic mean, respectively; with δ denoting the shift inthe mean. iffiffiffiffi N Þ and HN ¼ hN VarðX N Þ; kN 2 ½kL ; kU ; hN 2 ½hL ; hU ;KN ¼ kN VarðXð4Þ chart. The initial valwhere kN and hN are the design parameters of the proposed NCUSUM Xþues for the plotting statistics which are given in Eq (3) are equal to zero, i.e. MN0¼ MN0 ¼ 0.The plotting statistics of the proposed chart are plotted versus the control limit HN. The evaluaþtion rule for the proposed chart is given as: for any value of i, if the value of MNi HN then theprocess of the mean is declared to have shifted upward; otherwise, if the value of MNi HNthen the process mean is declared to have moved downward. The values of kN and hN need tobe selected with caution because the run length (RL) properties of the chart depend on them.Note that the RL is the number of charting statistics that are required before the first out-ofcontrol signal is issued by a control chart. The manner in which the design parameters kN andhN are obtained is discussed in the next section.Run length performance chart. For some selected values of kN and nN, for examPerformance of the NCUSUM Xple kN2{[0.20,0.25], [0.4,0.5]}, and nN2{[3,5],[10,20]}, the corresponding values of hN arefound by running 105 simulations in R software for some given fixed nominal neutrosophicaverage RL (denoted by NARL0) values of 300, 370, 400, 500. Tables 1–3 display the in-controland out-of-control neutrosophic average and standard deviation of the RL (denoted as NARLand NSDRL) profiles of the proposed chart using different parameters, where NARL2[NARLL,NARLU] and NSDRL2[NSDRLL, NSDRLU], with NARLL NARLU and NSDRLL NSDRLU. Inother words, Tables 1–3 give the ideal combinations of hN and kN when the nominal NARL0values are 300, 370, 400 and 500 for different values of nN.The following algorithm was applied to determine the values of kN and nN.Step-1: specify the values of NARL0 and nN.Step-2: Determine the values of kN and nN where NARL NARL0. Chose the values of kN andnN where NARL is very close or exact to NARL0.Step-3: Determine the values of NARLs and NSDRLs for various values of δ. control chart is evaluated in terms of differThe performance of the proposed NCUSUM Xent RL criteria, i.e. NARLs, NSDRL and the percentiles of the run length (PRL), i.e. the 25th,50th and 75th percentiles which are denoted by P25 (i.e. P252[P25L, P25U]), P50 (i.e. P502[P50L, P50U]) and P75 (i.e. P752[P75L, P75U]). The following analysis would be noticedthrough Tables 1–6:1. Tables 1–5 show that there are inverse relationships between the values of out-of-controlNARL (denoted as NARL1) and the values of δ. That is, the smallest value of NARL1 isfound at the largest values of δ, i.e. [1.00,1.00]. In other words, as δ increase, the values ofPLOS ONE https://doi.org/10.1371/journal.pone.0246185 February 4, 20214 / 16
PLOS ONECUSUM control chart under uncertainty chart when nN2[3, 5], kN2[0.20, 0.25] for different nominal NARL.Table 1. The NARL and NSDRL values of the proposed NCUSUM doi.org/10.1371/journal.pone.0246185.t001NARL1 decrease until they approach a value of one, i.e. [1.00,1.00]. The latter implies that,for large values of δ, the control chart will give an out-of-control signal on the next sampling point. Similarly, the NSDRLs tend to zero for largest values of δ, i.e. [0.00,0.00], whichmeans that the variability is reduced when δ values are large.2. For a specified neutrosophic sample size, nN, there is an increasing trend in NARL1 valuesas the neutrosophic value of kN increase at small shifts of δ; however, there is an decreasingtrend in NARL1 values for large shifts of δ (see Tables 1 and 2). For instance, whenkN2[0.20,0.25], nN2[3,5] and δ 0.25 for a NARL0 370, the NARL12[24.94,35.23]; however, when kN2[0.40,0.50], the NARL12[28.53,41.29] using the same parameters. Notethough, at δ 3 for the same NARL0 value, the NARL1 is equal to [1.96,2.29] and [1.08,1.82] chart when nN2[3, 5], kN2[0.4, 0.5] for different nominal NARL.Table 2. The NARL and NSDRL values of the proposed NCUSUM .org/10.1371/journal.pone.0246185.t002PLOS ONE https://doi.org/10.1371/journal.pone.0246185 February 4, 20215 / 16
PLOS ONECUSUM control chart under uncertainty chart when nN2[10, 20], kN2[0.4, 0.5] for different nominal NARL.Table 3. The NARL and NSDRL values of the proposed NCUSUM urnal.pone.0246185.t003for kN equal to [0.20,0.25] and [0.40,0.50], respectively. Moreover, when design parametersare kept fixed, as δ increase, there is a decrease in the values of NARL1.3. From Tables 2 and 3, it can be noticed that the NARL1 decreases rapidly when nN increase,with the restriction for the value of [kL, kU] being constant. For instance, when δ 0.25 and[kL, kU] [0.40,0.50] for a nominal NARL0 370, the NARL1 is equal to [28.53,41.29] and[8.43,14.49] when nN is equal to [3,5] and [10,20], respectively. This indicates improvingdetection ability.4. The in-control neutrosophic RL distribution of the proposed chart is positively skewed asthe in-control NARL are greater than the in-control P50. For instance, for the designparameters kN2[0.20,0.25] and nN2[3,5] corresponding to δ 0, the in-control values of chart when nN2[3, 5], kN2[0.20, 0.25] for different nominal NARL.Table 4. The neutrosophic percentile points of the proposed NCUSUM OS ONE https://doi.org/10.1371/journal.pone.0246185 February 4, 20216 / 16
PLOS ONECUSUM control chart under uncertainty chart when nN2[3, 5], kN2[0.4, 0.5] for different nominal NARL.Table 5. The neutrosophic percentile points of the proposed NCUSUM doi.org/10.1371/journal.pone.0246185.t005the P502[273,277] are smaller than NARL0 370 (see for instance Tables 1–6). The latter chart is positively skewed.implies that the distribution of the NCUSUM X chart increase rapidly as δ5. Regardless of the NARL0 value, the sensitivity of the NCUSUM Xincreases in terms of the P25, P50 and P75 values, see Tables 4–6. and classical CUSUM X charts. The persisComparison of the proposed NCUSUM X tent need for more awareness of the proposed NCUSUM X chart, comprehensive comparison chart. To get valid deductions, the in-control ARLs ofhas been made with classical CUSUM Xboth charts are set at nominal levels of 370 and 500, and the performance is compared in termsof the out-of-control ARLs and SDRLs. The strategy of working in this section is parallel to[27], that is, a control chart under neutrosophic design is said to be capable if it has smallerNARL values compared to its counterpart. Thus, the efficiency of the proposed chart in terms chart when nN2[10, 20], kN2[0.4, 0.5] for different nominal NARL.Table 6. The neutrosophic percentile points of the proposed NCUSUM 71/journal.pone.0246185.t006PLOS ONE https://doi.org/10.1371/journal.pone.0246185 February 4, 20217 / 16
PLOS ONECUSUM control chart under uncertainty charts when k 0.5, kN [0.4, 0.5].Table 7. Comparison of the NCUSUM and the classical CUSUM (CCUSUM) XNCUSUM chart: NARL0 370CCUSUM chart: ARL0 370CCUSUM chart: ARL0 500nN2[3, 5], hN2[4.887, 5.894]h 4.822NCUSUM chart: NARL0 500nN2[3, 5], hN2[5.224, 6.172]h 007 chart. Forof the NARL values is compared to the ARL values of the classical CUSUM X instance, the classical CUSUM X chart with parameters k 0.5 and h 4.822 identifies a shiftof size equal to 0.25 after 125.27 charting statistics for an ARL0 of 370; however, the proposed chart with parameters kN2[0.4,0.5] and hN2[4.887,5.894] identifies a shift of sizeNCUSUM Xequal to 0.25 between the interval [28.53,41.29] samples for an NARL0 of 370. In general, thecomparison in Table 7 indicates that for small, moderate and large shifts in the process mean,the NARL and NSDRL are smaller in magnitude as compared to the ARL and SDRL of the clas chart persical chart, at each corresponding shift value; and thus, the proposed NCUSUM X forms better than the classical CUSUM X chart. In summary, the neutrosophic and classical charts indicate that the NCUSUM X chartARLs and SDRLs of the NCUSUM and CUSUM X chart.has the higher shift detection ability as compared to the classical CUSUM X chart using simulated dataApplication of the NCUSUM X chart is compared to one of the classicalIn this section, the performance of the NCUSUM X CUSUM X chart using simulated data. Fifty observations are generated using the neutrosophicnormal distribution. The first twenty observations are generated by assuming that the processis statistically in-control and the next 30 observations are generated by assuming that the process has shifted with δ 0.25. The simulated data along with nN2[3,5], kN2[0.4,0.5],hN2[4.887,5.894], σ0N2[1.00,1.00], and NARL12[28.53,41.29], so the shift should be detectedbetween the 28th and 41st samples. The results from the simulated data are displayed in Figs 1 chart,and 2 for the proposed NCUSUM chart and the existing classical CUSUM Xrespectively. chart detects the first shiftFrom Figs 1 and 2, it can be seen that the proposed NCUSUM Xththstat around the 30 sample in between the 28 and 41 samples; however, the classical CUSUM chart indicates that all the charting statistics are in-control. Hence, it can be deduced that,X chart has the ability to detect the shifts in the process mean earlierthe proposed NCUSUM X chart is more efficientas compared to its classical counterpart. Therefore, the NCUSUM X and performs better than the classical CUSUM X chart.PLOS ONE https://doi.org/10.1371/journal.pone.0246185 February 4, 20218 / 16
PLOS ONECUSUM control chart under uncertainty chart for simulated dataset.Fig 1. The proposed NCUSUM Xhttps://doi.org/10.1371/journal.pone.0246185.g001 chartReal-data application of the proposed CUSUM X chart that were applied to two types ofThis section presents case-studies for the NCUSUM Xdata; the first example was dedicated to the case-study on the Pakistan state oil (PSO), whilethe second example is the case-study on the weather forecasting. The data were taken from theStock Exchange and Meteorological Department of Pakistan. However, as mentioned in [28],all the observations and measurements of the current variables are not crisp numbers; they are chart for simulated dataset.Fig 2. The classical CUSUM PLOS ONE https://doi.org/10.1371/journal.pone.0246185 February 4, 20219 / 16
PLOS ONECUSUM control chart under uncertaintyneutrosophically varied with some indeterminacy in representing intervals instead of singletonnumbers.Petroleum industry case-stud
The CUSUM control chart The classical CUSUM chart. The CUSUM X chart for monitoring small and moderate shifts in the mean was first introduced by [29]. The two-sided CUSUM chart is used to moni-tor upwards and downward shifts in the process parameters using the charting statistics Cþ i and C
