Transcription
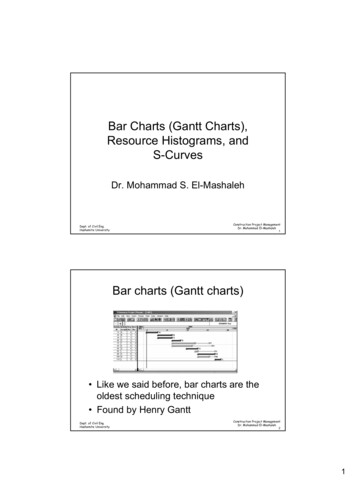
NCSS Statistical SoftwareNCSS.comChapter 247Cumulative Sum(CUSUM) ChartsIntroductionThis procedure generates cumulative sum (CUSUM) control charts for. The format of the control chart is fullycustomizable. The data for the subgroups can be in a single column or in multiple columns. This procedurepermits the defining of stages. The target value and sigma may be estimated from the data (or a subset of thedata), or a target value and sigma may be entered directly. The CUSUM chart may be used for subgroup data, orfor single observations at each time point. A fast initial response (head start) may be employed by the CUSUMchart, if desired.Cumulative Sum (CUSUM) Control ChartsThe CUSUM chart is used to monitor the mean of a process based on samples taken from the process at giventimes (hours, shifts, days, weeks, months, etc.). The measurements of the samples at a given time constitute asubgroup. Rather than examining the mean of each subgroup independently, the CUSUM chart shows theaccumulation of information of current and previous samples. For this reason, the CUSUM chart is generallybetter than the X-bar chart for detecting small shifts in the mean of a process.The CUSUM chart relies on the specification of a target value and a known or reliable estimate of the standarddeviation. For this reason, the CUSUM chart is better used after process control has been established.The CUSUM chart typically signals an out-of-control process by an upward or downward drift of the cumulativesum until it crosses the boundary. An assignable cause is suspected whenever the CUSUM chart indicates an outof-control process.247-1 NCSS, LLC. All Rights Reserved.
NCSS Statistical SoftwareNCSS.comCumulative Sum (CUSUM) ChartsOther Control Charts for the Mean of a ProcessThe X-bar chart is the most common control chart for monitoring the process mean. The X-bar chart is usuallyused in Phase I monitoring, when process control is being established. The X-bar chart is useful for detectinglarge changes in the process mean. The CUSUM chart is based on an established target mean and a reliable valuefor sigma. The CUSUM chart is useful for quickly detecting small shifts in the process mean.An alternative to the CUSUM chart is the exponentially weighted moving average (EWMA) chart. The EWMAchart has similar properties to the CUSUM chart and is also useful for detecting smaller shifts in the processmean.When only a single response is available at each time point, then the individuals and moving range (I-MR) controlcharts can be used for early phase monitoring of the mean and variation. CUSUM and EWMA charts may also beused for single responses and are useful when small changes in the mean need to be detected.Control Chart FormulasSuppose we have k subgroups, each of size n. Let xij represent the measurement in the jth sample of the ithsubgroup.The ith subgroup mean is calculated usingnxi xj 1ijnEstimating the Target ValueIn the CUSUM procedure, the target value may be input directly, or it may be estimated from a series ofsubgroups. If it is estimated from the subgroups the formula for the grand average iskx ni xi 1 j 1k ni 1ij.iIf the subgroups are of equal size, the above equation for the grand mean reduces tokx xi 1ki x1 x 2 x k.k247-2 NCSS, LLC. All Rights Reserved.
NCSS Statistical SoftwareNCSS.comCumulative Sum (CUSUM) ChartsEstimating Sigma – Sample RangesEither the range or the standard deviation of the subgroups may be used to estimate sigma, or a known (standard)sigma value may be entered directly. If the standard deviation (sigma) is to be estimated from the ranges, it isestimated asσˆ Rd2wherek Rii 1R kd2 E (R )σ µRσThe calculation of E(R) requires the knowledge of the underlying distribution of the xij’s. Making the assumptionthat the xij’s follow the normal distribution with constant mean and variance, the values for d2 are derived throughthe use of numerical integration. It is important to note that the normality assumption is used and that the accuracyof this estimate requires that this assumption be valid.When n is one, we cannot calculate Ri since it requires at least two measurements. The procedure in this case is touse the ranges of successive pairs of observations. Hence, the range of the first and second observation iscomputed, the range of the second and third is computed, and so on. The average of these approximate ranges isused to estimate σ.Estimating Sigma – Mean of Standard DeviationsThe true standard deviation (sigma) may be input directly, or it may be estimated from the standard deviations byσˆ sc4whereks sc4 ii 1kE (s )σ µsσThe calculation of E(s) requires the knowledge of the underlying distribution of the xij’s. Making the assumptionthat the xij’s follow the normal distribution with constant mean and variance, the values for c4 are obtained fromc4 n Γ 2 2n 1 n 1 Γ 2 247-3 NCSS, LLC. All Rights Reserved.
NCSS Statistical SoftwareNCSS.comCumulative Sum (CUSUM) ChartsEstimating Sigma – Weighted ApproachWhen the sample size is variable across subgroups, a weighted approach is recommended for estimating sigma(Montgomery, 2013): k2 ( ni 1) si σˆ s i 1 k ni k i 1 1/ 2CUSUM ChartsFollowing the CUSUM procedure presented by Ryan (2011), the steps for creating a CUSUM chart may besummarized as follows:1. Calculate the zi using the formulazi xi xσ x2. Calculate the lower and upper cumulative sums as followsS Li max[0, ( zi k ) S Li 1 ]S Hi max[0, (zi k ) S Hi 1 ]3. Plot SHi and SLi on a control chart. The control limits are chosen as plus or minus h. The usual choice fork is 0.5 (for detecting one-sigma shifts in the mean) and h is typically set to 5.4. When an out-of-control situation is detected, the corresponding sum may be left as it is, or reset to anappropriate starting value. In NCSS, the re-starting value may be set to zero or the fast initial restart (FIR)value of h/2.Data StructureIn this procedure, the data may be in either of two formats. The first data structure option is to have the data inseveral columns, with one subgroup per row.Example 47-4 NCSS, LLC. All Rights Reserved.
NCSS Statistical SoftwareNCSS.comCumulative Sum (CUSUM) ChartsThe second data structure option uses one column for the response data, and either a subgroup size or a secondcolumn defining the subgroups.Alternative example n the alternative example dataset, the Subgroup column is not needed if every subgroup is of size 5 and the userspecifies 5 as the subgroup size. If there are missing values, the Subgroup column should be used, or the structureof the first example dataset.247-5 NCSS, LLC. All Rights Reserved.
NCSS Statistical SoftwareNCSS.comCumulative Sum (CUSUM) ChartsQuality Control Chart Format Window OptionsThis section describes a few of the specific options available on the first tab of the control chart format window,which is displayed when a quality control chart format button is pressed. Common options, such as axes, labels,legends, and titles are documented in the Graphics Components chapter.[Xbar] / [Range] Chart TabSymbols SectionYou can modify the attributes of the symbols using the options in this section.A wide variety of sizes, shapes, and colors are available for the symbols. The symbols for in-control and out-ofcontrol points are specified independently. There are additional options to label out-of-control points. The label247-6 NCSS, LLC. All Rights Reserved.
NCSS Statistical SoftwareNCSS.comCumulative Sum (CUSUM) Chartsfor points outside the primary control limits is the subgroup number. The label for points that are out-of-controlbased on the runs test is the number of the first runs test that is signaled by this point.The user may also specify a column of point labels on the procedure variables tab, to be used to label all or someof the points of the chart. The raw data may also be shown, based on customizable raw data symbols.Lines SectionYou can specify the format of the various lines using the options in this section. Note that when shading isdesired, the fill will be to the bottom for single lines (such as the mean line), and between the lines for pairs oflines (such as primary limits).Lines for the zones, secondary limits, and specification limits are also specified here.Titles, Legend, Numeric Axis, Group Axis, Grid Lines, and BackgroundTabsDetails on setting the options in these tabs are given in the Graphics Components chapter. The legend does notshow by default but can easily be included by going to the Legend tab and clicking the Show Legend checkbox.247-7 NCSS, LLC. All Rights Reserved.
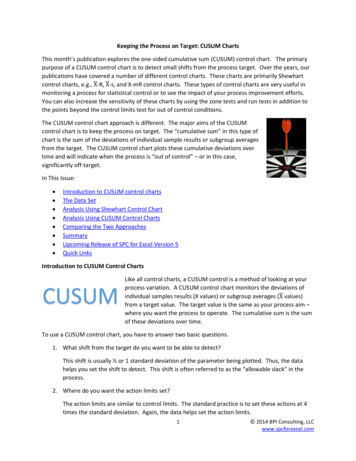
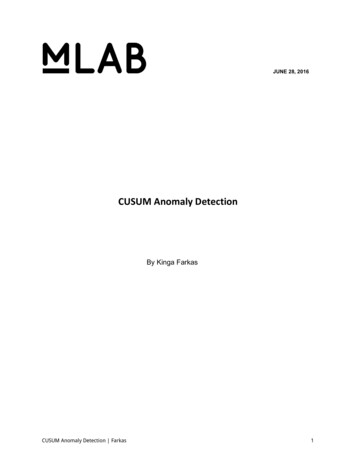
NCSS Statistical SoftwareNCSS.comCumulative Sum (CUSUM) ChartsExample 1 – In-Control CUSUM ChartThis section presents an example of how to produce a CUSUM chart. The data represent 50 subgroups of size 5.The data used are in the QC dataset. We will analyze the variables D1 through D5 of this dataset. The target valueis to be set to 67 and the sigma value is 8.SetupTo run this example, complete the following steps:1Open the QC example dataset From the File menu of the NCSS Data window, select Open Example Data. 2Select QC and click OK.Specify the Cumulative Sum (CUSUM) Charts procedure options Find and open the Cumulative Sum (CUSUM) Charts procedure using the menus or the ProcedureNavigator. The settings for this example are listed below and are stored in the Example 1 settings template. To loadthis template, click Open Example Template in the Help Center or File menu.OptionValueVariables TabData Variables . D1-D5Target & Sigma TabTarget Value Specification . Enter Target Value(s)Target Value(s) . 67Sigma Specification . Enter Sigma Value(s)Sigma Value(s) . 83Run the procedure Click the Run button to perform the calculations and generate the output.Target Value SectionTarget Value Section for Subgroups 1 to 50 Number of Subgroups50Target Value SpecificationUser-Specified Target ValueValue67This section displays the target value that is used in the CUSUM chart.Target Value SpecificationThis is the method by which the target value is obtained.Target ValueThis is value of the target value used to create the CUSUM chart.247-8 NCSS, LLC. All Rights Reserved.
NCSS Statistical SoftwareNCSS.comCumulative Sum (CUSUM) ChartsSigma Specification SectionSigma Specification Section for Subgroups 1 to 50 a Value8This section shows the specification of the standard deviation used in the CUSUM chart.Sigma SpecificationThis is the method by which the sigma value is obtained.User-Specified Sigma ValueThis is value of the sigma entered by the user, and is the value used to create the CUSUM chart.CUSUM ChartChart Section for Subgroups 1 to 50 This CUSUM plot shows the progress of the cumulative sum across the 50 subgroups. There does not appear tobe an indication of a change in the process mean.247-9 NCSS, LLC. All Rights Reserved.
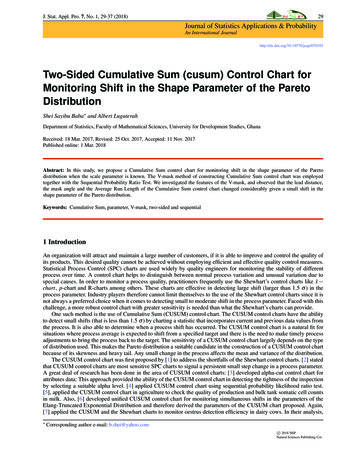
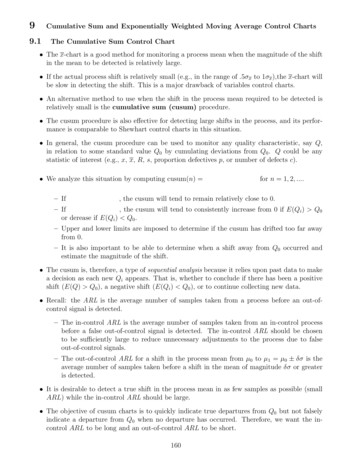
NCSS Statistical SoftwareNCSS.comCumulative Sum (CUSUM) ChartsExample 2 – CUSUM Chart with a Change in Process MeanThis section presents a continuation of the previous example. In this example the means are monitored for anadditional 100 subgroups. The data are given in the columns D1ext – D5ext of the QC dataset. In this dataset, themean of the process changed from 67 to 70 somewhere between subgroup 110 and 120.SetupTo run this example, complete the following steps:1Open the QC example dataset From the File menu of the NCSS Data window, select Open Example Data. 2Select QC and click OK.Specify the Cumulative Sum (CUSUM) Charts procedure options Find and open the Cumulative Sum (CUSUM) Charts procedure using the menus or the ProcedureNavigator. The settings for this example are listed below and are stored in the Example 2 settings template. To loadthis template, click Open Example Template in the Help Center or File menu.OptionValueVariables TabData Variables . D1ext-D5extTarget & Sigma TabTarget Value Specification . Enter Target Value(s)Target Value(s) . 67Sigma Specification . Enter Sigma Value(s)Sigma Value(s) . 8CUSUM Chart TabRestart Method . None3Run the procedure Click the Run button to perform the calculations and generate the output.Target Value and Sigma Specification SectionsTarget Value Section for Subgroups 1 to 150 Number of Subgroups150Target Value SpecificationUser-Specified Target ValueValue67Sigma Specification Section for Subgroups 1 to 150 a Value8Since the target value and sigma value specified are the same as those of Example 1, the results for these sectionsare the same as those of Example 1.247-10 NCSS, LLC. All Rights Reserved.
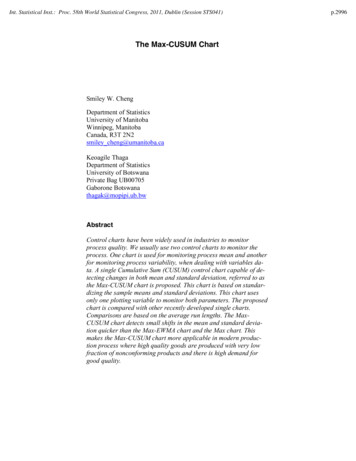
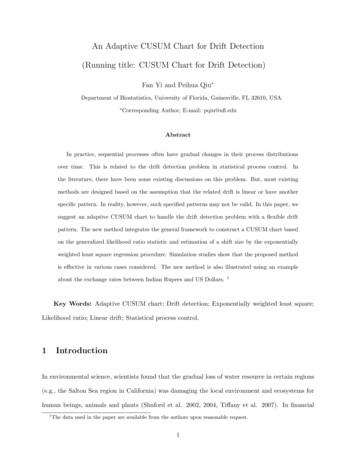
NCSS Statistical SoftwareNCSS.comCumulative Sum (CUSUM) ChartsCUSUM ChartChart Section for Subgroups 1 to 150 This plot gives a clear indication of a change in the process mean somewhere shortly before subgroup 120.Corresponding X-bar ChartBased on the X-bar chart of the same subgroups, the change in process mean is much less apparent.247-11 NCSS, LLC. All Rights Reserved.
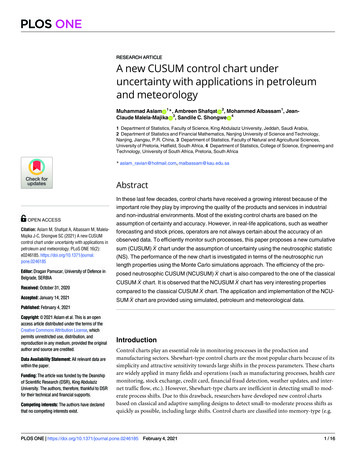
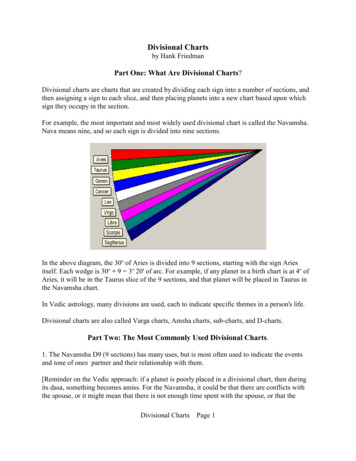
NCSS Statistical SoftwareNCSS.comCumulative Sum (CUSUM) ChartsExample 3 – CUSUM Chart with Additional FormattingThis example uses the same setup as Example 2, except that a variety of improvements are made in the plotformat. These improvements are made by clicking the CUSUM Chart format button on the CUSUM Chart tab.You can load the completed template Example 3 by clicking on Open Example Template from the File menu ofthe CUSUM Charts window.CUSUM ChartChart Section for Subgroups 1 to 150 As shown here, a variety of enhancements can be made to the formatting of the control charts to make the chart aseasy to read as possible. The numbers above the points represent the subgroup number.247-12 NCSS, LLC. All Rights Reserved.
better than the X-bar chart for detecting small shifts in the mean of a process. The CUSUM chart relies on the specification of a target value and a known or reliable estimate of the standard deviation. For this reason, the CUSUM chart is better used after process control has been established. The CUSUM chart typically signals an out-of-control .