Transcription
Int. Statistical Inst.: Proc. 58th World Statistical Congress, 2011, Dublin (Session STS041)The Max-CUSUM ChartSmiley W. ChengDepartment of StatisticsUniversity of ManitobaWinnipeg, ManitobaCanada, R3T 2N2smiley cheng@umanitoba.caKeoagile ThagaDepartment of StatisticsUniversity of BotswanaPrivate Bag UB00705Gaborone Botswanathagak@mopipi.ub.bwAbstractControl charts have been widely used in industries to monitorprocess quality. We usually use two control charts to monitor theprocess. One chart is used for monitoring process mean and anotherfor monitoring process variability, when dealing with variables data. A single Cumulative Sum (CUSUM) control chart capable of detecting changes in both mean and standard deviation, referred to asthe Max-CUSUM chart is proposed. This chart is based on standardizing the sample means and standard deviations. This chart usesonly one plotting variable to monitor both parameters. The proposedchart is compared with other recently developed single charts.Comparisons are based on the average run lengths. The MaxCUSUM chart detects small shifts in the mean and standard deviation quicker than the Max-EWMA chart and the Max chart. Thismakes the Max-CUSUM chart more applicable in modern production process where high quality goods are produced with very lowfraction of nonconforming products and there is high demand forgood quality.p.2996
Int. Statistical Inst.: Proc. 58th World Statistical Congress, 2011, Dublin (Session STS041)1. IntroductionControl charts are basic and most powerful tools in statisticalprocess control (SPC) and are widely used for monitoring qualitycharacteristics of production processes. The first types of controlcharts were developed by Shewhart in the 1920s and ever since, several new charts have been developed in an effort to improve theircapability to quickly detect a shift of the process from a target value.The statistical control chart, generally with 3σ action limits and2σ warning limits, is the longest established statistical form ofgraphical tool. The control chart statistics are plotted by simply plotting time on the horizontal axis and a quality characteristic on thevertical axis. A quality characteristic is regarded to be in an incontrol state if the statistic falls within the action limits of the chartand out-of-control if the statistic plots outside the action limits.The disadvantage of the Shewhart control charts is that they only usethe information about the process contained in the last plotted pointand information given by the entire sequence of points. This has ledto various additional rules about runs of points above the mean. Attempts to incorporate the information from several successive resultshave resulted in charts based on some form of weighted mean ofpast results. In particular the Arithmetic Running Mean has beenused in some instances by Ewan (1963).One of the charts developed as an improvement to the Shewhart chart is the cumulative sum (CUSUM) chart developed by Pagein 1954. This technique plots the cumulative sums of deviations ofthe sample values from a target value against time. The Shewhartcontrol chart is effective if the magnitude of the shift is 1.5σ to2σ or larger (Montgomery (2001)). The CUSUM charts are highlyrecommended by Marquardt (1984) for use in the U.S industry sincethey can detect small changes in the distribution of a quality characteristic and thus maintain tight control over a process. An importantfeature of the CUSUM chart is that it incorporates all the information in the sequence of sample values by plotting the cumulativep.2997
Int. Statistical Inst.: Proc. 58th World Statistical Congress, 2011, Dublin (Session STS041)sums of the deviations of the sample values from a target value. Ifthere is no assignable cause of variation, the two-sided CUSUMchart is a random walk with a drift zero. If the process statistic shifts,a trend will develop either upwards or downwards depending on thedirection of the shift and thus if a trend develops, a search for the assignable causes of variation should be taken. The magnitude of achange can be determined from the slope of the CUSUM chart and apoint at which a change first occurred is the point where a trend firstdeveloped. The ability to show a point at which changes in theprocess mean began makes the CUSUM chart a viable chart and alsohelps to quickly diagnose the cause of changes in the process. Thereare two ways to represent CUSUM charts: the tabular (or algorithmic) CUSUM chart and the V-mask form of the CUSUM chart. Weshall discuss the tabular CUSUM chart in this article.The CUSUM chart for the change in the mean and the standard deviation for variables data have been extensively studied andtwo separate plots generated to assess for a shift from the targetedvalues. Constructing individual charts for the mean and standarddeviation is very cumbersome and sometimes tedious and Hawkins(1993) suggested plotting the two statistics on the same plot usingdifferent plotting variables. This produces a chart that is somewhatcomplicated to interpret and is congested with many plotting pointson the same chart. Other charts have been developed with an effortto propose single charts to monitor both the mean and the standarddeviation of the process such as those suggested by Cheng and Spiring (1998), Domangue and Patch (1991), Chao and Cheng (1996),Chen and Cheng (1998) and Cheng and Xie (1999).The major objective of this paper is to develop a singleCUSUM chart that simultaneously monitors both the process meanand variability by using a single plotting variable. This chart is capable of quickly detecting both small and large shifts in the processmean and/or standard deviation and is also capable of handling casesof varying sample sizes.p.2998
Int. Statistical Inst.: Proc. 58th World Statistical Congress, 2011, Dublin (Session STS041)p.29992. The New Control ChartLet Xi Xi1, K , Xin, i 1, 2, K denote a sequence of samples ofsize n taken on a quality characteristic X. It is assumed that, for eachi, Xi1, K , Xin are independent and identically distributed observations following a normal distribution with means and standard deviations possibly depending on i, where i indicates the ith group. Letµ 0 and σ 0 be the nominal process mean and standard deviation previously established. Assume that the process parameters µ andσ can be expressed as µ µ 0 aσ 0 and σ bσ 0 , where a 0 andb 1 when the process is in control, otherwise the process haschanged due to some assignable causes. Then a represents a shift inthe process mean and b a shift in the process standard deviation andb 0.n (XLet X i ( X i1 K X in ) n and S i2 ij X i )2j 1n 1be the meanand variance for the ith sample respectively. The sample meanX i and sample variance S i2 are the uniformly minimum varianceunbiased estimators for the corresponding population parameters.These statistics are also independently distributed as do the samplevalues. These two statistics follow different distributions. TheCUSUM charts for the mean and standard deviation are based onX i and S i respectively.To develop a single CUSUM chart, we define the followingstatistics:Zi n( X i µ0 )σ0 ( n 1) S i2 Yi Φ 1 H ; n 1 ,2 σ 0 (1)(2)where Φ ( z ) P ( Z z ) , for Z N (0, 1) the standard normal distribution. Φ 1 is the inverse of the standard normal cumulative dis-
Int. Statistical Inst.: Proc. 58th World Statistical Congress, 2011, Dublin (Session STS041)p.3000tribution function, and H ( w; p ) P (W w p ) for W χ p2 the chisquare distribution with p degrees of freedom. The functions Z i andYi are independent and when the process variance is at its nominalvalue, Yi follows the standard normal distribution. The CUSUM statistics based on Zi and Yi are given byC i max[0, Z i k C i 1 ],(3)C i max[0, Z i k Ci 1 ],(4)andS i max[0, Yi v S i 1 ],(5)S i max[0, Yi v S i 1 ],(6)respectively, where C0 and S0 are starting points. Because Z i and Yifollow the same distribution, a new statistic for the single controlchart can be defined asMi max[C i , Ci , S i , S i ](7)The statistic Mi will be large when the process mean hasdrifted away from µ 0 and/or when the process standard deviationhas drifted away from σ 0 . Small values of Mi indicate that theprocess is in statistical control. Since Mi’s are non-negative, they arecompared with the upper decision interval only.The average run length (ARL) of a control chart is often usedas the sole measure of performance of the chart. The ARL of thechart is the average number of points that must be plotted before apoint plots above or below the decision interval. If this happens, anout-of-control signal is issued and a search for an assignablecause(s) of variation must be mounted. A chart is considered to bemore efficient if its ARL is smaller than those of all other competingcharts when the process is out of control and the largest when theprocess is in control.The out-of-control signal is issued when either the mean orthe standard deviation or both have shifted from their target values.Therefore the plan (the sample size and control limits) is chosen so
Int. Statistical Inst.: Proc. 58th World Statistical Congress, 2011, Dublin (Session STS041)that the ARL is large, when the process is in control and small whenthe process is out of control. Cox (1999) suggested that the criteriafor a good chart are acceptable risks of incorrect actions, expectedaverage quality levels reaching the customer and expected averageinspection loads. Therefore the in-control ARL should be chosen soas to minimize the frequency of false alarms and to ensure adequateresponse times to genuine shifts.For a predetermined in-control ARL, for quickly detectingshifts in the mean and variability, an optimal combination of h and kis determined which will minimize the out-of-control ARL for aspecified change in the mean and standard deviation, where h is thedecision interval and k is the reference value of the chart. The proposed chart is sensitive to changes in both mean and standard deviation when there is an increase in the standard deviation and is lesssensitive when the standard deviation shifts downwards. This phenomenon has been observed for other charts based on the standardized values Domangue and Patch (1991).3. Design of a Max-CUSUM chartWe use the statistic Mi to construct a new control chart. Because Mi is the maximum of four statistics, we call this new chart theMax-CUSUM chart. Monte Carlo simulation is used to compute thein control ARL for our Max-CUSUM chart. For a given in-controlARL, and a shift for the mean and/or standard deviation intended tobe detected by the chart, the reference value k is computed as halfthe shift. For these values (ARL, k), the value of the decision interval (h) follows. For various changes in the process mean and/orstandard deviation, each ARL value is also obtained by using 10 000simulations.Table 1 gives the combinations of k and h for an in-controlARL fixed at 250. We assume that the process starts in an in-controlstate with mean zero ( µ 0 0) and standard deviation of one( (σ 0 1) and thus the initial value of the CUSUM statistic is set atp.3001
Int. Statistical Inst.: Proc. 58th World Statistical Congress, 2011, Dublin (Session STS041)zero. For example if one wants to have in-control ARL of 250 and toguard against 3σ 0 increase in the mean and 1.25σ 0 increase in thestandard deviation, i.e., a 3 and b 1.25, the optimal parametervalues are h 1.215 and k 1.500. These shifts can be detected onthe second sample, i.e., the ARL is approximately two. A good feature of the Max-CUSUM chart is that smaller shifts in the processmean detected much faster than in the single Shewhart chart (Maxchart) as seen in the next section.Table 1 shows that small values of k with large values of hresult in quick detection of small shifts in mean and/or standard deviations. If one wants to guard against 3σ 0 increase in the mean and3σ 0 increase in the standard deviation, the value of h 1.220 andthe value of k 1.500. But for a 1σ 0 increase in mean and 1.25σ 0increase in standard deviation, h 4.051 and the value of k decreases to k 0.500.The Max-CUSUM scheme is sensitive to both small andlarge shifts in both mean and standard deviation. A 0.25σ 0 increasein the process mean reduces the ARL from 250 to about 53 and a1.25σ 0 increase in the process standard deviation with a 0.25σ 0 increase in the process mean reduces the ARL from 250 to about 41runs. If both parameters increase by large values, the ARL is reduced to 2. Thus the increase will be detected within the secondsample. For example, an 3σ 0 increase in both parameters will be detected within the second sample.Another alternative method of assessing the performance ofthe CUSUM chart is to fix the values of h and k and calculate theARL’s for various shifts in the mean and/or standard deviation. Thisis displayed in Table 2. The value of k 0.5 and thus we want todetect a 1σ 0 shift in the mean and h 4.051. This combination givesan in-control ARL 250. From Table 2 it can be concluded that,even when the chart is designed to detect a 1σ 0 shift in the process,p.3002
Int. Statistical Inst.: Proc. 58th World Statistical Congress, 2011, Dublin (Session STS041)p.3003it is sensitive to both small and large shifts in the mean and/or standard deviation.Table 1: (k, h) combinations and the corresponding ARL for theMax-CUSUM chart with ARL0 250.b1.000.51.251.502.002.503.004.00Parameter 0.000.25h4.051 8.572k0.500 0.125ARL250.21 53.21h4.051 8.572k0.500 0.125ARL91.30 67.33h4.051 8.572k0.500 0.125ARL82.42 41.01h4.051 8.572k0.500 0.125ARL41.84 34.92h4.051 8.572k0.500 0.125ARL18.81 23.97h4.051 8.572k0.500 0.125ARL11.78 18.16h4.051 8.572k0.500 0.125ARL8.63 14.32h4.051 8.572k0.500 0.125ARL5.85 10.16ARL0 250a0.50 1.006.161 4.0510.250 0.50022.04 7.996.161 4.0510.250 0.50025.00 8.246.161 4.0510.250 0.50018.98 7.406.161 4.0510.250 0.50016.37 6.936.161 4.0510.250 0.50012.75 5.956.161 4.0510.250 0.50010.22 5.116.161 4.0510.250 0.5008.49 4.536.161 4.0510.250 0.5006.38 81Table 2: ARL’s for the Max-CUSUM chart with h 4.051 and k 0.500.ab0.000.250.50 1.00 1.50 2.00 2.50 3.001.00 250.21 69.66 29.33 7.99 4.95 3.44 2.68 2.241.25 82.4236.97 19.58 7.40 4.93 3.44 2.64 2.211.50 41.8424.08 15.20 6.93 4.86 3.42 2.61 2.172.00 18.8113.72 10.39 5.95 4.59 3.37 2.59 2.122.50 11.789.557.885.11 4.26 3.33 2.55 2.043.00 8.637.406.414.53 3.96 3.28 2.47 1.944.00 5.855.314.843.80 3.49 3.25 2.44 001.391.2201.5001.37
Int. Statistical Inst.: Proc. 58th World Statistical Congress, 2011, Dublin (Session STS041)4. Comparison with other ProceduresIn this section, the performance of the Max-CUSUM chart iscompared with those of several other charts used for quality monitoring. Most of the CUSUM charts developed are designed to monitor the mean and standard deviation separately, even the combinedCUSUM charts developed monitor these parameters separately inthe same plots. This is done by plotting the charts using differentplotting variables for the means and standard deviations, and thencalculating ARLs separately for each parameter. The ARL for thechart will be taken as the minimum of the two. The new chart (MaxCUSUM) is compared with the omnibus CUSUM chart proposed byDomanque and Patch (1991), the Max chart by Chen and Cheng(1998) and the Max-EWMA chart by Cheng and Xie (1999).Table 4 shows the ARL's for the Max-CUSUM chart and theomnibus CUSUM chart developed by Domangue and Patch (1991)for shifts shown in Table 3. For various changes in the mean and/orstandard deviation, we have calculated the ARL's for the MaxCUSUM chart and compared them with those given by Domangueand Patch (1991) in Table 4. The Max-CUSUM chart performs better than the omnibus CUSUM chart for all shifts since its ARL's aresmaller than those of the omnibus chart. The Max-CUSUM chart isalso easy to plot and read as compared to the omnibus CUSUMchart since it plots only one plotting variable for each sample.Table 3: Level of shifts in mean and standard deviation .75S51.3S61.01.2p.3004
Int. Statistical Inst.: Proc. 58th World Statistical Congress, 2011, Dublin (Session STS041)p.3005Table 4: ARL’s of the Max-CUSUM chart and the omnibusCUSUM chartk 1h 1.279α 0.5n USUM9.23.126.115.56.35.0Max-CUSUMIn Table 5 we compare the Max-CUSUM chart with the Maxchart. The Max-CUSUM chart is more sensitive for small shifts inthe mean than the Max chart and there is no significant difference inthe performance of these charts at larger shifts even though the Maxchart has slightly low ARLs for large shifts. This is a major improvement in the CUSUM scheme as existing CUSUM charts areless sensitive to large shifts in the process mean and/or standard deviation.Table 6 shows the performance of the Max-CUSUM chartand Max-EWMA chart for in-control ARL 250. Both charts aresensitive to small and large shifts in the mean and/or standard deviation with the Max-EWMA chart performing better than the MaxCUSUM chart for both small and large shifts. These two charts useonly one plotting variable for each sample and have good proceduresof indicating the source and direction of shifts in the process.Table 5: ARL for Max-CUSUM chart and the Max chart.ARL0 250Max-CUSUMab0.000.25 0.50 1.00 2.00 3.00 0.001.00 250.21 69.66 29.33 7.99 3.44 2.24 250.01.25 82.42 36.97 19.58 7.40 3.44 2.21 34.31.50 41.84 24.08 15.20 6.93 3.42 2.17 9.82.00 18.81 13.72 10.39 5.95 3.37 2.04 2.93.00 8.637.40 6.41 4.53 3.28 1.94 1.4n 4Max Charta0.25 0.50 1.00143.8 49.3 7.227.2 15.9 4.98.96.9 3.52.82.6 2.11.41.4 1.32.001.21.31.31.31.23.001.01.01.01.11.1
Int. Statistical Inst.: Proc. 58th World Statistical Congress, 2011, Dublin (Session STS041)Table 6. ARL for Max-CUSUM chart and the Max-EWMA chartARL0 250Max-CUSUMMax-EWMAaab0.000.25 0.50 1.00 2.00 3.00 0.00 0.25 0.50 1.001.00 250.21 69.66 29.33 7.99 3.44 2.24 250.0 24.6 8.6 2.91.25 82.42 36.97 19.58 7.40 3.44 2.21 17.8 12.3 7.1 2.91.50 41.84 24.08 15.20 6.93 3.42 2.17 6.35.7 4.5 2.52.5 2.3 1.82.00 18.81 13.72 10.39 5.95 3.37 2.04 2.53.00 8.637.40 6.41 4.53 3.28 1.94 1.71.6 1.6 1.55. Charting ProceduresThe charting procedure of a Max-CUSUM chart is similar tothat of the standard upper CUSUM chart. The successive CUSUMvalues, Mi’s are plotted against the sample numbers. If a point plotsbelow the decision interval, the process is said to be in statisticalcontrol and the point is plotted as a dot point. An out-of-control signal is given if any point plots above the decision interval and is plotted as one of the characters defined below. The Max-CUSUM chartis a combination of two two-sided standard CUSUM charts. The following procedure is followed in building the CUSUM chart:1. Specify the following parameters; h, k, δ and the in-controlor target value of the mean µ 0 and the nominal value of thestandard deviation σ 0 .2.If µ 0 is unknown, use the sample grand average X of the data to estimate it, where X ( X 1 L X m ) / m . If σ 0 is un-known, use R d 2 or S c 4 to estimate it, whereR ( R1 L Rm ) / m is the average of the sample rangesand S ( S1 L S m ) / m is the average of the sample standard deviations, and d 2 and c 4 are statistically determinedconstants.3. For each sample compute Zi and Yi.p.30062.001.11.21.21.21.23.001.01.01.01.01.1
Int. Statistical Inst.: Proc. 58th World Statistical Congress, 2011, Dublin (Session STS041)4. To detect specified changes in the process mean and standarddeviation, choose an optimal (h, k) combination and calculate C i , C i , S i and S i .5. Compute the Mi’s and compare them with h, the decision interval.6. Denote the sample points with a dot and plot them againstthe sample number if Mi h .7. If any of the Mi’s is greater than h, the following plottingcharacters should be used to show the direction as well as thestatistic(s) that is plotting above the decision interval:(i)If C i h, plot C . This shows an increase in theprocess mean.(ii)If C i h, plot C . This indicates a decrease in theprocess mean.(iii)If S i h, plot S . This shows an increase in the processstandard deviation.(iv)If S i h, plot S . This shows a decrease in the processstandard deviation.(v)If both C i h and S i h, plot B . This indicates anincrease in both the mean and the standard deviation ofthe process.(vi)If C i h and S i h, plot B . This indicates an increase in the mean and a decrease in the standard deviation of the process.(vii)If C i h and S i h, plot B . This indicates a decrease in the mean and an increase in the standard deviation of the process.(viii)If C i h and S i h, plot B . This shows a decreasein both the mean and the standard deviation of theprocess.p.3007
Int. Statistical Inst.: Proc. 58th World Statistical Congress, 2011, Dublin (Session STS041)8.p.3008Investigate the cause(s) of the shift for each out-of-controlpoint in the chart and carry out the remedial measures neededto bring the process back into an in-control state.6. An ExampleA Max-CUSUM chart is applied to real data obtained fromDeVor, Chang and Sutherland (1992). The data is for measurementsof the inside diameter of the cylinder bores in an engine block. Themeasurements are made to 1/10,000 of an inch. Samples of size n 5 are taken roughly every half hour, and the first 35 samples are given in Table 7. The actual measurements are of the form 3.5205,3.5202, 3.5204 and so on. The entries given in Table 7 provide thelast three digits in the measurements.Table 7: Cylinder diameter dataSample X i1 X i 2 X 204Suppose based on past experience, an operator wants todetect a 1σ shift in the mean, that is a 1 and a 2σ shift in thestandard deviation, that is b 2 with an in-control ARL 250, 201199200201199
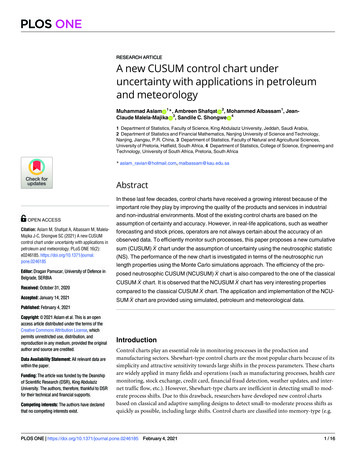
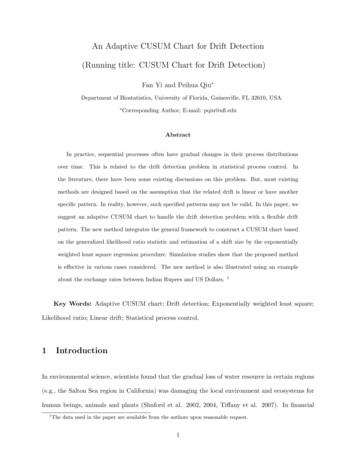
Int. Statistical Inst.: Proc. 58th World Statistical Congress, 2011, Dublin (Session STS041)corresponding decision interval from Table 1 is h 2.475 and thereference value is k 0.500. The chart is developed as follows: Thenominal mean µ 0 is estimated by X and σ 0 is estimated by S / c 4 .The sample produced the following estimates X 200.25 andS / c 4 3.31The Max-CUSUM chart in Figure 1 which plots all the 35observations shows that several points plot above the decision interval. Sample number 6 shows an increase in the standard deviation.After this sample, samples 7 and 8 also plot above the decision interval. However these points show that the standard deviation is decreasing towards the in-control region. Due to very high value of theCUSUM statistic for the standard deviation in sample 6, the successive cumulative values at samples 7 and 8 shows a value above thedecision interval even though the standard deviation values corresponding to these samples are in control. We therefore investigate thecause of higher variability at sample number 6. According to DeVor;Chang and Sutherland (1992), this sample was taken when the regular operator was absent, and a relief, inexperienced operator was incharge of the production line and thus could have affected theprocess.Sample number 11 also plots above the decision interval.This point corresponds to an increase in the mean. This correspondsto a sample taken at 1:00 P.M. when production had just resumed after lunch break. The machines were shut down at lunch time for toolchanging and thus these items were produced when the machineswere still cold. Once the machines warmed up, the process settled toan in-control state. This shows that the shift in the mean was causedby the machine tune-up problem.Sample 16 also plots above the decision interval this shiftshows an increase in the standard deviation. According to DeVor;Chang and Sutherland (1992), this sample corresponds to a timewhen an inexperienced operator was in control of the process. In addition to the above mentioned points which also plotted above thep.3009
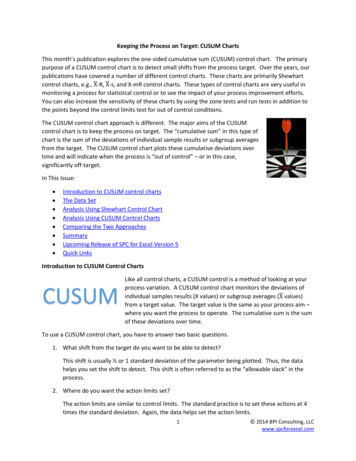
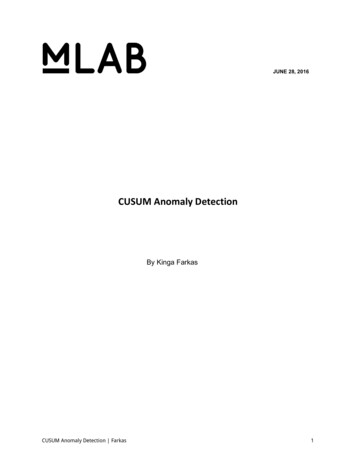
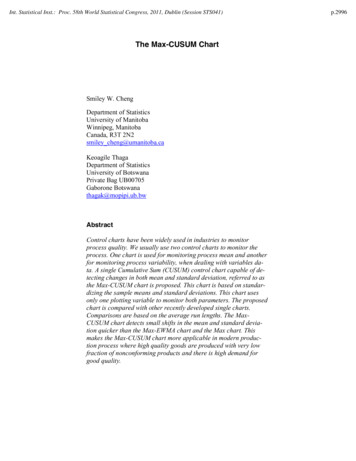
Int. Statistical Inst.: Proc. 58th World Statistical Congress, 2011, Dublin (Session STS041)control limit in the Shewhart chart, Max chart and EWMA chart,sample 34 plots above the decision interval. This point correspondsto a decrease in the standard deviation. The Shewhart S chart plottedthis value close to the lower control limit but within the acceptablearea. Table 1 show that the Max-CUSUM chart is very sensitive tosmall shift and thus signals for this small decrease in the standarddeviation.When these four samples are removed from the data, new estimates for the mean and standard deviation were computed, givingthe following; X 200.08 and S / c 4 3.02. The revised chart isshown in Figure 2. The chart plots only one point above the decisioninterval. This point corresponding to sample 1, this shows an increase in the mean. This point corresponds to a sample that was taken at 8:00 A.M. This corresponds roughly to the start up of the production line in the morning, when the machine was cold. Once themachine warmed up, the production returns to an in-control state.When sample 1 is removed from the data, we re-calculate theestimates and obtain X 199.93 and S / c 4 3.06. The MaxCUSUM chart for this new data is shown in Figure 3. All the pointsplot within the decision interval showing that the process is incontrol.Figure 1: The first Max-CUSUM control chart for the cylinder diameter datap.3010
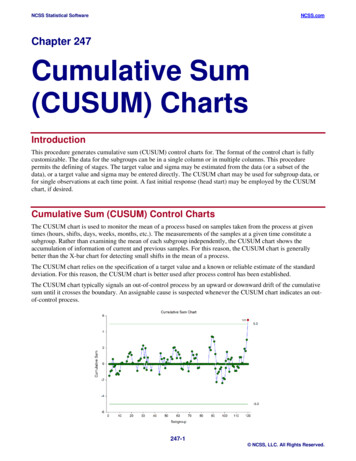
Int. Statistical Inst.: Proc. 58th World Statistical Congress, 2011, Dublin (Session STS041)Figure 2: The second Max-CUSUM control chart for the cylinderdiameter dataFigure 3: The third Max-CUSUM control chart for the cylinder diameter data7. ConclusionThe ARL for this chart reduces as the shift increases. Onedisadvantage of the standard CUSUM chart is that it does not quickly detect a large increase in the process parameters and thus is notrecommended for large increase in both mean and variability.A good feature of the Max-CUSUM chart developed here is its ability to quickly detect both small and large changes in both the processmean and the process variability. Another advantage of the MaxCUSUM is that we are able to monitor both the process center andp.3011
Int. Statistical Inst.: Proc. 58th World Statistical Congress, 2011, Dublin (Session STS041)spread by looking at one chart. The performance of the proposedMax-CUSUM is very competitive in comparison with the Max chartand the Max-EWMA chart.ReferencesBrook, D. and Evans, D. A. (1972). An Approach to the ProbabilityDistribution of CUSUM Run Length. Biometrika 59, 539549.Champ, C. W. and Woodall, W. H. (1987). Exact Results forShewhart Control Charts With Supplementary Runs Rules.Technometrics, 29, 393-399.Chao, M. T. and Cheng, S. W. (1996). Semicircle Control Chart forVariables Data. Quality Engineering, 8(3), 441-446.Chen, G. and Cheng, S. W. (1998). Max-chart: Combining X-BarChart and S Chart. Statistica Sinica 8, 263-271.Cheng, S. W. and Spiring, F. A. (1990). An Alternative VariableControl Chart: The Univariate and MultivariateCase.Statistica Sinica, 8, 273-287.Cox, M. A. A. (1999). Toward the Implementation of a UniversalControl Chart and Estimation of its Average Run LengthUsing a Spreadsheet. Quality Engineering, 11, 511-536.Domangue, R. and Patch, S. C. (1991). Some OmnibusExponentially Weighted Moving Average Statistical ProcessMonitoring Schemes. Technometrics 33, 299-313.DeVor, R. E., Chang, T. and Sutherland, J. W. (1992). StatisticalQuality Design and Control. Macmillan, New York.Ewan, W. D. (1963). When and How to Use CUSUM Charts.Technometrics, 5, 1-22.Gan, F. F. (1993). The Run Length Distribution of a CumulativeSum Control Chart. Journal of Quality Technology 25,205-215.Hawkins, D. M. (1981). A CUSUM for Scale Parameter. Journal ofQuality Technology 13, 228-231.p.3012
Int. Statistical Inst.: Proc. 58th World Statistical Congress, 2011, Dublin (Session STS041)Hawkins, D. M. (1992). A Fast Approximation for Average RunLength of CUSUM Control Charts. Journal of QualityTechnology 24, 37-43.Hawkins, D. M. (1993). Cumulative Sum Control Charting: AnUnderutilized SPC Tool. Quality Engineering, 5, 463-477.Hawkins, D. M. and Olwell, D .H. (1998). Cumulative Sum Chartsand Charting for Quality Improvement. Springer, New York.Lucas, J. M. (1982). Combined Shewhart-CUSUM Quality ControlSchemes. Journal of Quality Technology 14, 51-59.Lucas, J. M. and Crosier, R. B. (2000). Fast Initial Response forCUSUM Quality Control Scheme: Give Your CUSUM aHead Start. Technometrics, 42, 102-107.Lucas, J. M. and Saccucci, M. S. (1990). Exponentially WeightedMoving Average Control Schemes: Properties andEnhancements. Technometrics, 32, 1-12.Marquardt, D. W. (1984). New Technical and EducationalDirections for Managing Product Quality. The American Statistician, 38, 8-14.Montgomery, D. C. (2001). Introduc
mic) CUSUM chart and the V-mask form of the CUSUM chart. We shall discuss the tabular CUSUM chart in this article. The CUSUM chart for the change in the mean and the stan-dard deviation for variables data have been extensively studied and two separate plots generated to assess for a shift from the targeted values.