Transcription
International Journal of Mathematical, Engineering and Management SciencesVol. 6, No. 4, 975-1008, stribution-Free CUSUM-Type Control Charts for MonitoringIndustrial Processes: An OverviewIoannis S. TriantafyllouDepartment of Computer Science & Biomedical Informatics,University of Thessaly, Lamia 35131, Greece.Corresponding author: itriantafyllou@uth.grMangey RamDepartment of Mathematics, Computer Science & Engineering,Graphic Era Deemed to be University, Dehradun-248002, Uttarakhand, India.E-mail: mangeyram@gmail.com(Received on January 23, 2021; Accepted on April 3, 2021)AbstractIn the present paper we provide an up-to-date overview of nonparametric Cumulative Sum (CUSUM) monitoringschemes. Due to their nonparametric nature, such memory-type schemes are proved to be very useful for monitoringindustrial processes, where the output does not match to a particular distributional model. Several fundamentalcontributions on the topic are mentioned, while recent advances are also presented in some detail. In addition, somepractical applications of the nonparametric CUSUM-type control charts are highlighted, in order to emphasize theircrucial role in the contemporary online Statistical Process Control.Keywords- Distribution-free statistical methods, Rank-based procedures, Nonparametric statistical process control,Cumulative sum control charts, Sign statistics.1. IntroductionStatistical Process Control is implemented in industrial procedures and aims at improving theirquality by monitoring the corresponding production process. Among others, control charts areproved to be very useful statistical tools for supervising a quality characteristic of the product andtracking down plausible changes in the underlying distributional model. The most popular andeasy-to-use monitoring schemes, which have been introduced and well-studied in the literature, arethe so-called Shewhart-type, Cumulative Sum (CUSUM, hereafter) and Exponentially WeightedMoving Average (EWMA, hereafter) control charts. For a thorough consideration of the basicprinciples of the topic, the excellent monographs of Montgomery (2007), Qiu (2014) and the worksof Woodall and Montgomery (1999), Woodall (2000) are strongly recommended.A broad variety of monitoring schemes have been already established under the presumption thatthe output matches to a particular distributional model. Nevertheless, this demand is not constantlyfulfilled and consequently it is evident that the distribution-based monitoring schemes do notconstantly provide a reliable framework. To overcome this problem and at the same time hold theordinary frame of a control chart, a lot of nonparametric charts are already known. These charts areindependent from the process distribution and therefore any distributional assumptions arerequired. The general framework of the so-called Nonparametric Statistical Process Control andsome fundamental perspectives of it could be found in the works of Qiu and Li (2011a, 2011b),Chakraborti and Graham (2019a), Qiu (2018).975 https://www.ijmems.in
Triantafyllou & Ram: Distribution-Free CUSUM-Type Control Charts For Monitoring.One of the classes of distribution-free schemes for monitoring univariate processes, is the familyof the Shewhart-type nonparametric monitoring schemes (SNCC class, hereafter). The charts,which are included in the SNCC class, utilize an appropriate nonparametric test statistic, whosevalues are calculated by the aid of individual observations or random groups of observationscollected from the process. These observed values of the test statistic are plotted and compared tothe control limits of the corresponding chart, in order to draw a conclusion about the status of theunderlying process. The SNCC class seems to include the easiest-to-use control charts compared toother families of distribution-free schemes. Some pioneer works on the SNCC class are presentedby the review paper of Chakraborti et al. (2001), while recent advances on the topic are discussedby Chakraborti and Graham (2019b), Koutras and Triantafyllou (2020).A second family of distribution-free monitoring schemes contains memory-type statistical tools,known as nonparametric EWMA control charts (EWMANCC class, hereafter). These charts utilizean appropriate nonparametric testing procedure in order to build the corresponding EWMA statistic,whose values are afterwards plotted and monitored by the aid of the respective control limits. It isevident that the EWMANCC class is supposed to be superior to the aforementioned SNCC class fortracking down slight changes of the underlying process. Some recent advances on the topic areprovided by You and Qiu (2020), Perdikis et al. (2021).The third family of distribution-free schemes for monitoring univariate processes includes the socalled CUSUM nonparametric control charts (CNCC class, hereafter). Each member of this classcalls for an appropriate nonparametric test statistic and afterwards the CUSUM procedure isconstructed via the conventional approach. The CNCC class outperforms the SNCC family fortracking down small or moderate changes of either the location or the scale parameter of theunderlying process. For multivariate CUSUM nonparametric control charts, Qiu and Hawkins(2001), Qiu (2008), Xue and Qiu (2020) provided some excellent works. Throughout the lines ofthe present review article, the CNCC class constitutes the target group of distribution-freemonitoring schemes in the univariate case. The CUSUM nonparametric control charts aim atmonitoring a non-normal process or even a process with an unknown distribution. In other words,the members of CNCC class seem quite capable to monitor adequately a quantitative characteristicof a product, even if its distribution is heavy-tailed or skewed or it cannot be derived by historicaldata. The above-mentioned attribute of the CUSUM nonparametric schemes accompanied withtheir simplicity, makes them quite attractive for the practitioners.The rest of the paper is formulated as follows: Section 3 offers a review of univariate nonparametricCUSUM-type control charts based on sign statistics. Such works start to appear in the literatureforty years ago, while some relative outcomes have been recently published. In Section 4, we studycontrol charts, which belong to the CNCC class and are based on order statistics, while Section 5offers a detailed presentation of CUSUM-type rank-based monitoring schemes. Section 6 puts forththe general outline of the present manuscript, whilst several thoughts for extending the research onthe topic are also discussed.2. General Notations and CUSUM FrameworkIn the present section, general notations are presented in order to make the remaining manuscriptmore readable. The main symbols which are utilized in the next sections, are listed below. However,some specific notations which are not generally used by all charts, are properly introduced anddefined throughout the lines of the corresponding subsection of the present review article.976 Vol. 6, No. 4, 2021
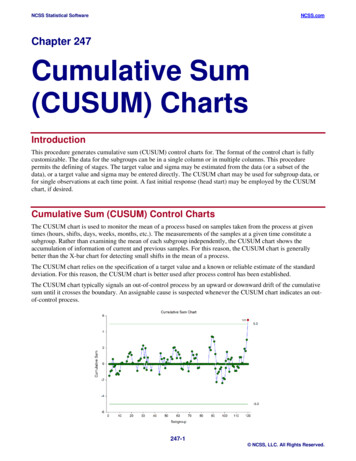
Triantafyllou & Ram: Distribution-Free CUSUM-Type Control Charts For Monitoring.ARL: Average Run LengthAEQL: Average Extra Quadratic Loss.FAR: False Alarm RateIC: in-controlOOC: out-of-controlsign (a): the sign of number aSR: Wilcoxon signed-rank statisticI(b): an indicator (dummy) variable depending on bLCL: Lower Control LimitW: Wilcoxon rank-sum statisticMW: Mann-Whitney test statisticUCL: Upper Control LimitRSS: Ranked set samplingGenerally speaking, the CUSUM control charts provide an attractive alternative monitoring tool,when small location or scale shifts are investigated. In fact, a CUSUM scheme exploits directly thetotal amount of information drawn from the sampling procedure by depicting the cumulative sumsof the deviations of the sample values from the target one (μ). Due to the fact that CUSUM chartscombine information from different samples, they are proved to be more capable than Shewharttype charts for tracking down slight process changes. If a shift in the process is under way, theCUSUM chart is expected to produce a signal, while an adjustment should take place in order toreinstate the process back on the desirable performance level. The tabular CUSUM is constructedby accumulating derivations from target value that are either above it (with the so-called one-sidedupper CUSUM statistic C1) or below the target value (with the corresponding one-sided lowerCUSUM statistic C2). It goes without saying that whenever either the upper or lower CUSUMstatistic exceeds the decision interval, the process is characterized as OOC. A graphicalrepresentation of the general framework for constructing a CUSUM chart follows the ordinaryscheme, namely the cumulative sum statistic is plotted versus the identification number.Afterwards, the process is characterized as IC or OOC by comparing its observed values to thecorresponding control limits Montgomery (2007).3. Distribution-Free CUSUM Control Charts Based on Sign StatisticsThroughout the lines of the present part, univariate nonparametric schemes, which rely on the wellknown sign statistic and follow the general CUSUM framework are discussed. It is evident that thesign statistic and its modifications have been already utilized for constructing Shewhart-typenonparametric schemes (Asghari et al., 2018; Castagliola et al., 2020). However, our study aims atdiscussing the corresponding CUSUM-type advances. The first attempt towards this direction,which has been recorded in the literature, belongs to McGilchrist and Woodyer (1975). In theirarticle, a CUSUM technique which endures distribution-free testing is introduced and implementedfor detecting possible shifts in the median of a rainfall distribution.We next provide a detailed review of nonparametric univariate monitoring schemes based on signstatistics, namely of these members of the CNCC class which employ the well-known sign statisticor its modifications. The set-up of presentation of the included articles is determined to bechronological for the purpose of setting up a comprehensible and well-structured flow.977 Vol. 6, No. 4, 2021
Triantafyllou & Ram: Distribution-Free CUSUM-Type Control Charts For Monitoring.3.1 A Nonparametric CUSUM Control Chart Based on Wilcoxon Signed-RankStatisticBakir and Reynolds (1979) proposed a distribution-free methodology for tracking down possiblechanges in the mean of a sequence of observations from a specified control value. In the frameworkof their distribution-free scheme, the Wilcoxon signed-rank statistic is monitored, while rankingtakes place within groups. Bakir and Reynolds (1979) treated the cumulative sum procedure as aMarkov chain and consequently they proposed a simple technique for determining the exactAverage Run Length of the corresponding monitoring scheme. It is true that the method introducedby Bakir and Reynolds (1979) can be applied for any process distribution, under the assumptionthat we have at hand the distribution of the Wilcoxon signed-rank statistic for that case. Note thatranking was accomplished within groups, where the groups were either samples taken at each pointor else artificially defined groups and that makes the determination of the corresponding ranksmuch easier. It goes without saying that if single observations are collected randomly from theproduction, then the observation must be artificially divided into groups.Let us denote by X i1 , X i 2 ,., X in , i 1, 2,. a random sample of size n consisting of observationswhich are drawn sequentially from the process. If Rij , j 1, 2,., n corresponds to the rank of theabsolute value of X ij , namely to the rank ofX ijinside the group of observationsX i1 , X i 2 ,., X in , i 1, 2,. and sign(a) denotes the sign of number a, then we define therespective Wilcoxon signed-ranks within the i-th group asU ij sign( X ij ) Rij , j 1, 2,., n(1)The so-called Wilcoxon signed-rank statistic for the i-th sample can be now expressed asnSRi U ij , i 1, 2,.(2)j 1Bakir and Reynolds (1979) proposed a grouped signed-rank test, which relies on the observedSRi , i 1, 2,. of the nonparametric statistic defined in (2) and simultaneously exploits theCumulative Sum Control Chart (CSCC, hereafter) proposed by Page (1954). The CSCC aims atdetecting possible shifts of the underlying distribution process either in the positive or in thenegative direction. In other words, the so-called CSCC produces a signal that a positive shift hasbeen detected at the first d observed values if the following ensues.dm ( X ij w1 ) min ( X ij w1 ) h1, j 1, 2,., n ,i 10 m d(3)i 1where w1 and h1 are design parameters of the CSCC procedure. On the other hand, the CSCCproduces a signal that a negative shift has been detected at the first d observed values if thefollowing ensues.978 Vol. 6, No. 4, 2021
Triantafyllou & Ram: Distribution-Free CUSUM-Type Control Charts For Monitoring.mdi 1i 1max ( X ij w2 ) ( X ij w2 ) h2 , j 1, 2,., n0 m d(4)where w2 and h2 are design parameters of the CSCC procedure. It is straightforward that a twosided CSCC can be constructed by combining the signaling rules (3) and (4), while if we set w1 w2,h1 h2, a symmetric control chart is generated.The proposed distribution-free CUSUM monitoring scheme can be viewed as either one- or twosided chart. More precisely, the one-sided nonparametric CUSUM control chart introduced byBakir and Reynolds (1979) produces an alarm for a positive change in the process mean has beenoccurred at the first d observed values if the following holds true.dm (SRi w) min (SRi w) h .0 m di 1(5)i 1Following a similar argumentation, the one-sided nonparametric CUSUM control chart introducedby Bakir and Reynolds (1979) produces an alarm for a negative shift in the process mean has beenoccurred at the first d observed values ifmdi 1i 1max ( SRi w) ( SRi w) h.0 m d(6)For constructing a two-sided CUSUM chart, we should combine the signaling rules stated in Eq.(5) and (6). Note that design parameters w and h are determined appropriately so that the OOCbehavior of the resulting monitoring scheme is optimized. In more practical terms, the monitoringscheme established by Bakir and Reynolds (1979) can be viewed as sequential testing procedure,dwhere the cumulative sum (SR w) for each test is accumulated till the sum either exceeds ori 1iequals to the value h or is no greater than zero. In case of recording a non-positive sum at the endof a test, a new one is activated based on the next observation. The testing procedure gives an OOCalarm whenever the sum at the end of a test is equal to or exceeds the value h.Under the assumption that parameter w is non-negative integer, it is evident that the Wilcoxonsigned-rank statistic for the i-th sample is also an integer inside the intervald n(n 1) / 2, n(n 1) / 2 . Therefore, the quantity (SRi w)shall be also integer valued.i 1Bakir and Reynolds (1979) stated that the time their CUSUM testing procedure signals coincidesto the first time point that the discrete Markov chainstate space is given as 0,1,., h , S0 0and Sv : v 0,1,. enters the state h, where theSn min h, max{0, Sn 1 SRn w} . It isnoticeable that if state h is viewed as an absorbing state, then the expected amount of groups ofobservations for the procedure is equivalent to the average time to absorption into state h. Basedon the last argument, Bakir and Reynolds (1979) expressed the ARL of their CUSUM scheme as979 Vol. 6, No. 4, 2021
Triantafyllou & Ram: Distribution-Free CUSUM-Type Control Charts For Monitoring.nm0 , where m0 corresponds to the mean time to absorption under the presumption that the chainstarted initially at state 0.From the comparisons accomplished by Bakir and Reynolds (1979), it is concluded that in casewhere the observations are naturally drawn in groups, their CUSUM monitoring scheme performsslightly worse compared to the competitive parametric ones under the normality presumption, whileit is proved to be considerably more capable than the parametric techniques for non-normaldistributions.3.2 A Nonparametric CUSUM Control Chart Based on the Sign Test StatisticAmin et al. (1995) proposed both one-sided and two-sided CUSUM charts which rely on the signtest statistic. It is true that n the case of monitoring schemes based on signs, the correspondingAverage Run Length remains stable for all continuous distributional models, given that therespective median is equal to the target value. The nonparametric monitoring schemes introducedby Amin et al. (1995) aim at supervising the process median (or mean) and rely on signs computedwithin samples. More specifically, the proposed CUSUM control chart utilizes a cumulative sumof sign test statistics in order to monitor the process variability. The scheme established by Aminet al. (1995) is user friendly. Due to their nonparametric nature no assumptions for the underlyingdistribution are required, while their schemes are proved to be more capable than the respectiveparametric ones when the process distributional model is heavy tailed.Let us denote by X i1 , X i 2 ,., X in , i 1, 2,. a group of magnitude n consisting of observationswhich are drawn randomly at regular intervals from the process. The distributional model of theunderlying production is presumed to be continuous with median M and the interest focuses ondetecting possible shifts of its median from a pre-specified target value M0. The main idea of themonitoring scheme established by Amin et al. (1995) is based on the exploitation of the informationincluded inside the samples up to the current time. In their article, all comparisons among theproposed monitoring scheme and other competitive charts rely on the corresponding Average RunLength values.Generally speaking, control schemes which rely on the sign statistic call for comparisons of eachobservation against the target (or control) value M0 and the recording of the amount of observationswhich are located below and above M0 respectively. Denoting by sign(a) the sign of number a,Amin et al. (1995) utilized the following test statisticnSNi sign(X ij M 0 ), i 1, 2,. .(7)j 1It is straightforward that the sign statistic defined in Eq. (7) is computed for each random sampleseparately and corresponds to the diversion between the amount of observations located above M0and the respective number of observations positioned below M0. The CUSUM schemes establishedby Amin et al. (1995) can be constructed for detecting either positive or negative deviations fromthe IC median value. More precisely, the one-sided scheme gives an alarm at the first d samples ifone of the following ensues980 Vol. 6, No. 4, 2021
Triantafyllou & Ram: Distribution-Free CUSUM-Type Control Charts For Monitoring.dm (SNi s) min (SRi s) h0 m di 1i 1Ormdi 1i 1max ( SNi s) ( SRi s) h,0 m d(8)where s, h are positive design parameters of the corresponding scheme. Note that the firstmentioned condition appeared in Eq. (8) is activated whenever a possible positive shift from the ICtarget value is suspected, while the second one is more suitable for dealing with plausible negativeshifts. As mentioned by Amin et al. (1995), the corresponding two-sided scheme is readily deducedif we take into consideration both conditions stated in Eq. (8), namely their two-sided control chartis expected to signal at the first d samples if either of the one-sided charts give an alarm. A differentapproach for implementing the CUSUM scheme established by Amin et al. (1995) is offered by theso-called graphical V-mask scheme (see, e.g. Van Dobben de Bruyn, 1968).Amin et al. (1995) pointed out that the random quantity Ti ( SNi n) / 2 , which corresponds tothe amount of positive signs throughout the observations of the i-th random sample, could be analternative test statistic for their CUSUM procedure. It is evident that the random variable Ti followsa Binomial distribution with parameters n and p P( X ij M 0 ) . Consequently, one may restatethe proposed chart by Amin et al. (1995) by utlizing the test statistic Ti instead of SNi.The ARL of the corresponding CUSUM scheme could be determined in terms of design parameterss and h. For instance, one may optimize the OOC behavior of the control chart, given that its ICperformance is pre-specified. In other words, one may construct the CUSUM control chart suchthat it achieves a desirable IC ARL and it performs simultaneously the minimum OOC ARL. Someinteresting thoughts on the aforementioned optimization issue are offered by Reynolds (1975).Amin et al. (1995) recommended the usage of distribution-free schemes based on signs, for heavytailed or asymmetric distributions. They also argued that their proposal seems to offer an alluringframework when relatively large samples, e.g. samples of size greater than 6, for detecting possiblesmall shifts.3.3 A Distribution-Free CUSUM Mean Control ChartYang and Cheng (2011) established a distribution-free CUSUM mean scheme for monitoringpossible small mean changes in the underlying distribution. In their framework, no assumptionsreferring to the process distribution is required, while an extensive numerical experimentationreveals that the proposed scheme is quite favorable versus other existing competitive charts,especially for unascertained or non-normal distributions.Let us denote by X i1 , X i 2 ,., X in , i 1, 2,. a group of magnitude n consisting of observationswhich are drawn randomly and independently from the production. We next denote by μ the processmean and by p the probability that an observed value taken randomly from the process is greaterthan μ. Presuming that the process is IC, the probability p is said to be equal to p0. Conversely,when a change in the process mean has occurred, the corresponding probability equals to p1.981 Vol. 6, No. 4, 2021
Triantafyllou & Ram: Distribution-Free CUSUM-Type Control Charts For Monitoring.Based on the observed values drawn from the process, Yang and Cheng (2011) formed thedifferences Yij X ij , i 1, 2,. and defined the following sign statisticnM i I (Yij 0), j 1, 2,., n ,(9)j 1where 1, if Yij 0I (Yij 0) , j 1, 2,., n, 0, otherwise(10)while i is a positive integer.It is straightforward that the quantity Mi, which corresponds to the number of non-negative Yijinside the i-th random sample, follows a Binomial distribution with parameters n and p0 for an ICprocess. Yang and Cheng (2011) pointed out that instead of supervising slight process meanchanges, it is similar to look for slight shifts in probability p. Their proposed two-sided CUSUMnonparametric control chart utilizes two different monitoring statistics. If p0 p1 , 0 ,then Yang and Cheng (2011) defined the following CUSUM test statistics (11) (12)Ci max 0, Ci 1 M i (np0 k1 ) , i 1, 2,.andCi min 0, Ci 1 (np0 k1 ) M i , i 1, 2,.where Mi corresponds to the number of non-negative Yij, k1 n / 2 and the starting values equalto zero, e.g. C0 0, C0 0 . Note that both monitoring statistics defined in Eq. (11) and (12) areplotted on the same chart, whose upper and lower control limit is denoted by H1 and -H1respectively. The CUSUM scheme introduced by Yang and Cheng (2011) gives an OOC alarmwhenever at least one the following occursCi H1 or Ci H1 .(13)It is evident that the design constants k1 and H1 of the respective chart are appropriately determinedin order a pre-determined IC or OOC performance level is accomplished. As Yang and Cheng(2011) mentioned, in order to calculate the Average Run Length of their two-sided control scheme,the upper and lower half of the chart should be considered separately. In fact, the upper half(CUSUM , hereafter) is responsible for tracking down plausible upward shifts of the process, whilethe lower half (CUSUM-, hereafter) is activated for monitoring possible downward changes.Denoting by ARL (ARL-) the Average Run Length of the CUSUM (CUSUM-), the overall ARL ofthe corresponding CUSUM scheme is expressed as Hawkins (1992).982 Vol. 6, No. 4, 2021
Triantafyllou & Ram: Distribution-Free CUSUM-Type Control Charts For Monitoring.ARL 1.1/ ARL 1/ ARL (14) Yang and Cheng (2011) managed to determine the ARL and ARL- values appeared in the aboveequation, by the aid of an appropriate Markov chain approach (see, e.g. Lucas and Saccucci, 1990).Yang and Cheng (2011) provided some numerical results for emphasizing the efficiency of theproposed CUSUM scheme in tracking down plausible changes of the process, even if the processdistribution is skewed. Generally speaking, the CUSUM chart established by Yang and Chengseems to constitute an attractive alternative to traditional Shewhart-type or CUSUM-typemonitoring schemes when the underlying distribution is unascertained or non-normal.3.4 A Nonparametric CUSUM Sign Control Chart Using RSSAbid et al. (2017) established a CUSUM sign scheme for tracking down plausible deviations fromthe process mean applying the so-called RSS. According to their simulation study, the proposedCUSUM sign monitoring scheme seems to outperform the modified distribution-free CUSUM signscheme and the parametric CUSUM scheme utilizing simple random sampling framework.Abid et al. (2017) proposed the construction of CUSUM-type monitoring scheme by the aid of theRSS method. According to the aforementioned sampling technique, a group of size n is collectedrandomly from the production and afterwards an expert is due to rank its units. The observationhaving the minimum rank is located and selected for the quantification. The remaining (n-1) unitsare backtracked and a second random sample of size n is collected. After ranking the observationsof the second sample, the observation with the second smallest rank is detected, measured, and theunused observations are backtracked once again. The aforementioned procedure is replicated untiln ordered observations have been measured and that completes the first cycle. After accomplishingm separate cycles, one may obtain a ranked set sample consisting of rm observations. For somerecent advances on the RSS procedure, which has been introduced by McIntyre (1952), theinterested reader is referred to Frey and Zhang (2021), Koshti and Kamalja (2021).Let us denote by X (1)1 , X (2)1 ,., X ( n )1 , X (1)2 , X (2)2 ,., X ( n )2 ,., X (1) m , X (2) m ,., X ( n) m a ranked setrandom sample of size n with m cycles, consisting of observations which are drawn independentlyfrom the process. We next denote by μ the target value and by p the probability that an observedvalue taken randomly from the process is greater than μ. Presuming that the process is IC, theprobability p is said to be equal to p0. Conversely, when a change in the process mean has occurred,the corresponding probability equals to p1.Based on the observed values drawn from the process, Abid et al. (2017) considered the followingsign statistic (Hettmansperger, 1995).rm M RSS I ( X ( j )i 0),(15)j i i 1where 1, if X ( j )i 0I ( X ( j )i 0) 0, otherwise983 Vol. 6, No. 4, 2021(16)
Triantafyllou & Ram: Distribution-Free CUSUM-Type Control Charts For Monitoring.Their proposed two-sided CUSUM nonparametric control chart utilizes two different monitoringstatistics. If p0 p1 , 0 , then Abid et al. (2017) defined the following CUSUM teststatistics (17) (18) Ct max 0, Ct 1 M RSS( t ) ( np0 k ) , t 1, 2,.and Ct min 0, Ct 1 (np0 k ) M RSS( t ) , t 1, 2,. where M RSS ( t ) corresponds to the number of non-negative X ( j )i at time t, np0 coincides tothe mean value, k is a reference value with k n / 2 and the starting values are normally to beequal to zero, e.g. C0 0, C0 0 . Note that both monitoring statistics defined in Eq. (17) and (18)are plotted on the same chart, whose upper and lower control limit is denoted by H and -Hrespectively. The CUSUM scheme introduced by Abid et al. (2017) produces an alarm wheneverat least one the following occursCt H or Ct H .(19)It is evident that the design constants k and H of the corresponding chart are appropriately definedsuch that a pre-determined IC or OOC behavior is accomplished. It is noticeable that several wellknown nonparametric testing procedures have been investigated in terms of the RSS (Bohn andWolfe, 1992; Bohn and Wolfe, 1994; Hettmansperger, 1995). At the same time, some interestingapplications of the RSS method on the development of parametric control charts are provided byAbujiya and Muttlak (2004), Mehmood et al. (2013), Haq et al. (2015). The numerical comparisonsaccomplished by Abid et al. (2017) confirm that their scheme is capable for tracking down slightand big changes in the process mean immediately versus competitive schemes.3.5 A Nonparametric CUSUM Control Chart Based on Ranks and RSSAbid et al. (2018) established a nonparametric scheme, which relies on the Wilcoxon signed rankstatistic and the so-called RSS. Since RSS has been discussed in Sub-Section 2.4 of the presentmanuscript in some detail, we avoid illustrating its framework once again throughout the lines ofthe present section.A variety of distributions, namely the Laplace distribution, the Logistic, Normal or Student’s tdistribution, is utilized to study the behavior of the CUSUM monitoring scheme. According to thenumerical results provided by Abid et al. (2018), the proposed chart seems to outperform othercompetitive control charts.Let us suppose that a random sample of size n is drawn from the process in order to monitor theprocess location θ0. Since Abid et al. (2018), implemented the RSS with m cycles, the proposedtesting procedure is based on the quantity R( ph )i , which corresponds to the within-group absolute
3.1 A Nonparametric CUSUM Control Chart Based on Wilcoxon Signed-Rank Statistic Bakir and Reynolds (1979) proposed a distribution-free methodology for tracking down possible changes in the mean of a sequence of observations from a specified control value. In the framework of their distribution-free scheme, the Wilcoxon signed-rank statistic is .