Transcription
Status of Air Travel in the USAPresentation by John P. HeimlichVice President & Chief EconomistApril 13, 2016 2016 Ipsos. All rights reserved. Contains Ipsos' Confidential and Proprietary information andmay not be disclosed or reproduced without the prior written consent of Ipsos.
Airlines for America: Research Objectives Airlines for America (A4A) sought to better understand various aspects ofthe American airline traveler in 2015: Who is traveling by air, why, where and how often; How many Americans traveled by airline in 2015; What logistical decisions did 2015 travelers make including how muchluggage to take, how many nights to stay, what kind of tickets they buy; What are their upcoming travel plans in 2016; and What are the investments that travelers believe are the most crucial inthe coming years. This study references similar research conducted by Gallup on behalf of theAir Transport Association of America in 1998 for trending purposes. The 1997study was a random sample of 3,016 Americans age 18 conducted viatelephone.2
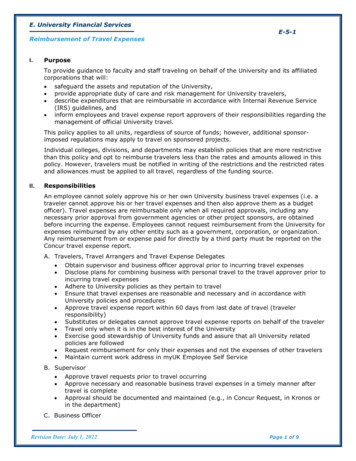
Executive SummaryAirline Travel 2015Airline Travel 1971-2015% of US Adult Population% of US Adult Population81%Flew in 201545%Not on anairlineFlew business 201517%Flew personal 20154955% of Americans who flew on anairline in 20152124652429288181Ever flown323945Flown inlast 87198819891990199119921993199742%762016Ever flownAn Airline7370The 2015 American Adult Flyer at a /Ethnicity6%2%None of these35%55 14%SatisfiedNeitherWhiteBlack17%8%35%2015 Flyer Satisfaction80%DissatisfiedHispanic67%AsianOther3
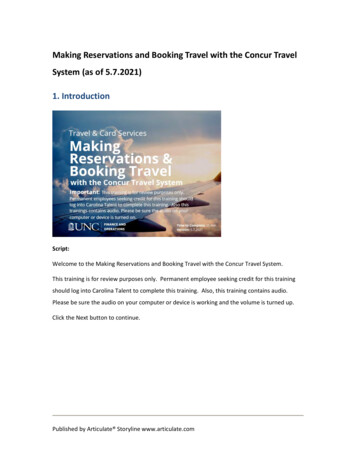
Trips per Airline TravelerAll American Adults2015 Airline Travelers% of all Americans take X trips0 trips% of all 2015 flyers take X trips551 trip142 trips45 trips26 trips3203 trips54 trips312 trips93 trips1 trip104 tripsAverage2.1 trips95 trips6 trips67 trips17 trips28 trips18 trips29 trips69 tripsQ3. In 2015, how many trips did you take on airlines for the following purposes?Count each roundtrip as a single trip and include any trips planned for the last fewweeks of 2015Average4.8 trips5154
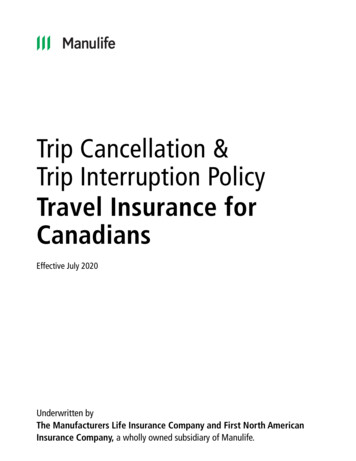
People took flights for many reasons in 2015Total Trips Taken2015 Airline TravelersAverage tripsBusiness purposes31%*1,99531%1.53,3142.3* Compared to 47% in 1997Personal leisurepurposes48%Personal non-leisurepurposes21%1,339Q3. In 2015, how many trips did you take on airlines for the following purposes?Count each roundtrip as a single trip and include any trips planned for the last fewweeks of 201521%1.05
2015 Flyers Come From Across the United States2015 Airline Flyers by Home Location(brackets represents % entire U.S. population)Mountain9%(9%)Pacific17%(15%)West NorthCentral7%(7%)West %(14%)East NorthCentral13%(14%)East SouthCentral3%(4%)SouthAtlantic25%(23%)6
2015 Flyers Come from Urban and Rural Areas2015 Airline Flyers by Home Population(outline represents % entire U.S. population)5M (Urban)29%1-4.9M (Semi-urban)33% 1M (Town/Suburban)Non-metro (Rural)All Americans33%25%8%34%27%11%2015 flyers7
For Americans Airline Travel is Mostly DomesticIndividual/Personal Travel to Region2015 Airline Travelers – Personal ReasonsRegion% of all TripsUSA63%Canada5%Mexico5%Central America5%South America4%Caribbean5%Europe8%Africa2%Middle East2%Australia/Asia3%Q6. What was your destination for the personal flights you took in 2015? Pleasespecify the number of air trips to each locationLatin 14%8
Trip Duration Most personal trips last less than one week. The average across domestic and international is 6.6 nights.How many nights stayed?50%44%45%38%40%Personal domestic36%Average 5.7 nights35%Personal internationalAverage 7.7 nights30%30%25%21%20%15%12%8%10%5%2%3%2%1%2%0%0 nights1-3 nights4-7 nights8-14 nightsQ7. On average, how many nights did you stay at your destination when you took thefollowing types of trips?/Q8. When you travel via airline on personal trips, how manypeople do you usually travel with?15-30 nights31 nights9
Travelers Checked Baggage Experience Travelers going to an international location are likely to check more items thanthose traveling domestically. Personal travelers check an average 1.1 pieces of luggage. Of all personal checked bags in 2015, more than half did not require payment.Checked items needing paymentItems checked70%59% 58%60%50%% of all checked items60%Average 0.9checked itemsPersonaldomesticAverage 1.3checked itemsPersonalinternational 40%57%56%50%43% 44%40%30%24%20%10%30%27%20%15%9%3%1% 1% 2%0%10%0%0 1 item 234itemsitems items itemsQ10-11. How many items did you check?/How many checked items requiredpayment?0 items1 item or more (net)10
Electronic Devices Owned Air travelers are a tech-savvy group: nearly all travelers own some type of computer. Smartphones are also popular: more than three-quarters of flyers own a smartphone. 70% of flyers own a tablet or e-Reader, vs. 60% for the overall population100%Electronic Devices 30%72%68%32%60%20%28%10%Q. Which of the following do you have in your household?Maps (GPS etc)CameraAll AmericansTablet/e-ReaderAir travelerTV & CableMedia GamingPhonesComputer0%11
Booking tickets (what kind and where) for travelers Personal international travelers are twice as likely to splurge on premium seating asthose traveling domestically. [56% vs. 28%] Those flying internationally are more likely to book travel from an online travelagency, such as Expedia, whereas most domestic travel was booked directlythrough the airline website.80%Type of ticket 49%50%50%20%How ticket booked70%20%17%14%22%14%Personal domesticPersonal %8%4% 5% 5%0%Q12. What type of ticket do you (or your company) usually book for these kinds offlights? / Q14. What resource do you usually use to book travel for these kinds offlights?12
Booking tickets (how far in advance) for travelers The majority of personal domestic and international travelers book their ticketsmore than three weeks in advance of the date of departure. [65%, 59%]Booking tickets in 9%8% 8%10%11%14%16% 16%21%18%Personal domesticPersonal internationalPersonal overall5%0%0-3 days4-7 daysQ13. How far in advance do you usually book travel?8-21 days22 days to threemonthsMore than threemonths13
The check-in and upgrade process for flyers Most travelers prefer to check in to their flights on a personal device, using either apersonal computer or mobile device. Only 11% use the ticket counter. 23% of air travelers chose to purchase a seat upgrade in 2015.Purchased seat upgradeCheck-In Automated Airport ticketkiosk at thecounterairport2%0%Q15. What type of ticket do you (or your company) usually book for these kinds offlights? / Q16. Did you purchase a seat upgrade using money, points or miles on anyflight?YesNoNot sure14
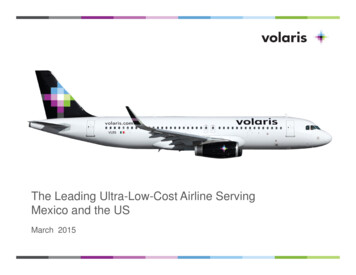
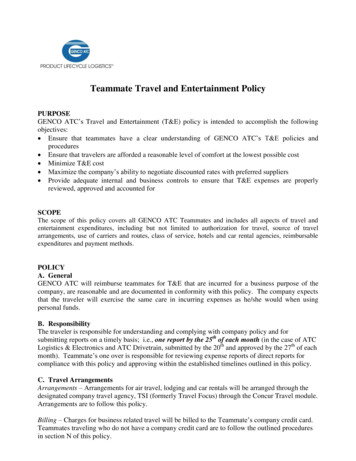
Frequent Flyer Programs for travelers Two-thirds of 2015 flyers are a member of some airline frequent flyer program.Enrollment in frequent flyer programs60%55%50%40%34%30%20%10%10%0%Yes, frequent flyer programmember, but do not have elitestatusYes, have elite status with afrequent flyer programQ17. Are you currently enrolled in any frequent flyer program and do you have anystatus giving you extra privileges?No15
TSA Pre-Check and future enrollment for travelers Nearly a fifth (19%) of travelers are enrolled in the TSA PreCheck security program. Only 13% are enrolled in CBP Global Entry.Enrollment in security programs80%73%70%60%50%40%30%20%19%13%10%0%CBP Global EntryTSA PrecheckNo, I am not enrolled in either of theseBase: N 1364Q18. Are you currently enrolled in either of these expedited security screeningprograms?/ Q19. Do you plan to enroll in either of these expedited security screeningprograms in 2016?16
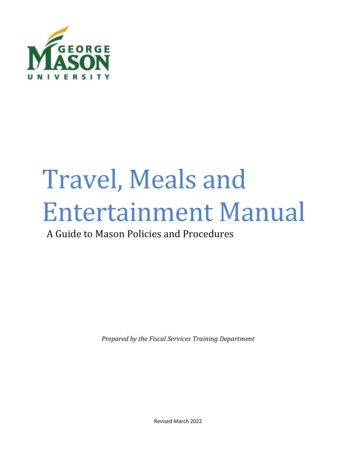
2015 Air Traveler Satisfaction 80% of all 2015 flyers reported being somewhat or very satisfied with their overallair travel experience in 2015, including 35% very satisfied and 1% very dissatisfied. Flyers enrolled in expedited security screening programs reported even greaterlevels of satisfaction: 82% (49% very) for PreCheck; 95% (67% very) for Global Entry.Satisfaction with Overall 2015 Air Travel Experience80%67%70%Overall60%CBP Global Entry49%50%40%TSA PreCheck44%35%33%28%30%20%14% 13%10%3%5% 5%2%1% 1% 0.3%0%Very satisfiedSomewhat satisfiedNeither satisfied nordissatisfiedQ25. Thinking about your overall experience with air travel over the past twelvemonths, how satisfied or dissatisfied are you?Somewhat dissatisfiedVery dissatisfied17
2015 Air Traveler Satisfaction (Cont’d) While air travelers of all incomes and age groups reported satisfaction levelsexceeding 70%, younger [88%] and middle class travelers [83%] reported the highestlevels of satisfaction their 2015 air travel experience.Satisfaction % by Age of TravelerSatisfaction % by Traveler HH r818376 50k 50-100k 100k 88Satisfied18-34Q25. Thinking about your overall experience with air travel over the past twelvemonths, how satisfied or dissatisfied are you?737735-5455 Satisfied18
ProspectiveFlight in 201619
2016 Flight Outlook Americans generally plan to take about the same number of flights next year. 2015 travelers are the most likely to fly again in 2016 – and to take even moreflights, with the most popular type of trip being personal domestic trips.Purpose and Destination for LikelyFlyersMore or less flights in %40%17%16%16%30%20%20%29%29%32%All AmericansEver flown2015 %10%0%0%About the same number of flightsFewer flightsMore flightsQ21. In total, do you think you will take more or fewer flights in 2016 than you did in2015?/Q20. How likely are you to travel by airline for these reasons anddestinations?All AdultsEver flown2015 FlyersPersonal domesticPersonal internationalBusiness domesticBusiness international20
Travel Decision Factors The cost and the time spent traveling are the most important factors in decidingwhether to travel by air. Airport amenities have the least effect on decision making.Importance of Factors in Choosing Air Travel% Ranking 1 or 2 out of 5100%90%86%86%78%76%80%79% 83%74%77%74%73%74%74%71%72%70%60%Ever flown50%40% 43%40%30%36%2015 Flyers30%20%10%0%Total tal time Perception of Operational Conveniencespent in travelsafetyreliability of the airportQ22. How important are each of the following when you are making the decision totravel by airline (versus another mode of travel or versus not going at all)?Quality ofinflightamenitiesAmenities atthe airport21
Importance of pre-flight factors Efficiency in the preflight experience is the most important factor for travelers, withefficiency in the security and boarding process ranked as most important preflightfactors.Importance of Pre-Flight Factors% Ranking 1 to 3 out of 0%24%25%29%24%26%Ever flown2015 Flyer10%0%Q23. In terms of your preflight experience at the airport, how would you RANK thefollowing in importance?22
Importance of inflight factors Space for both the travelers and their luggage is the most important factor for aninflight experience. 2015 travelers value inflight entertainment options more than people who have everflown.Importance of In-Flight Factors% Ranking 1 to 3 out of 6100%90%91% 89%77% 75%80%70%60%53% 51%50%Ever flown40%2015 Flyer30% 31%30%26%29%24% 26%20%10%0%Legroom/seatcomfortSpace for carry-onsFood and drinkoptionsWifi availabilityQ24. In terms of your inflight experience, how would you RANK the following inimportance?EntertainmentoptionsIn-seat power23
Advice for CEO When asked to give advice to an airline CEO, all groups say that the highest priorityshould be improvements to onboard comfort; half put routes/schedules in top 3. Technology onboard the aircraft and the airline’s website or mobile applications areconsidered the lowest priority items, though those who traveled in 2015 are morelikely to say these items are important.80%74%Key Issue to Address% Ranking 1 to 3 out of 771%70%60%59%54%50%46%49%Ever flown40%36%35%36%34%2015 Flyer32%29%30%26%21%20%10%0%Onboard comfort Customer etQ26. If you were able to advise the CEO of a major airline on how to prioritize futurecustomer-oriented investments in the airline, how would you RANK the following?OnboardtechnologyWebsite and apps24
Preference on tickets Two-thirds of Americans prefer the à la carte pricing model in which they pay only forthose airline services/amenities that they need or want. This preference is highest among the least affluent households.Ticket Type 67%60%A la 38%32%33%10%0%AllEver FlownAmericansFlown in2015HH Income HH Income HH Income Flew more 18-34 year 35-54 yearUnder 100-150K 150Kthan fiveoldold 100Ktimes in2015Q27. Which of the following statements do you agree with:“I like paying one all-inclusive ticket price for a bundle/package of services (e.g., seat assignment, checked bag(s), meal), even if it’s more expensive”“I prefer to pay only (à la carte) for those airline services/amenities that I want/need, so my ticket ends up being less expensive”55 yearold25
Recap26
Recap: Looking forward to 2016 Americans are bullish about airline travel in 2016. 75% of 2015 airline travelers and 53% of all Americans say they are somewhat orvery likely to travel by airline this year. Almost a third (29%) of all Americans say they will take more flights in 2016 alongwith the majority (55%) who expect to fly at the same rate. Price, convenience and reliability are the main reasons Americans choose tofly (rather than drive, take rail or other forms of transit). Generally, airport or inflight amenities, while appreciated, are not major reasons toselect airline travel as the preferred travel method. And Americans are mostly looking for a hassle-free experience when they fly. 79% of Americans say ease and speed of getting through security is a top priorityand 77% say the ease or efficiency of the boarding process is a top priority (1-3 outof 7). 91% say legroom is their top priority on the plane (1-3 out of 6), followed by 77%who want space for a carry-on.27
Recap: Airline Travel Trends in 2015 While the fraction of Americans who have ever flown has not changeddramatically in the last 18 years, the fraction of Americans currently flying hasclimbed and more Americans have access to air travel than ever before. In 2015, 81% of the American public reported experiencing airline travel intheir lifetime. This is unchanged from 1997 (also 81%) but up significantlyfrom 1971 (49%) the first year on record. The fraction of Americans reporting airline travel in the last year is 45%, upfrom 39% in 1997, 31% in 1986 and 21% in 1971. Younger travelers (35% of all airline travelers in 2015) and people with lessthan 50,000 household income (35% of all airline travelers in 2015) aremore likely to fly today than 18 years ago. However, the nature of airline travel has changed dramatically since 1997. In1997, 47% of all trips were for business purposes. In 2015, that figure fell to 31%. The large majority – 80% – of airline travelers in 2015 report being satisfied withtheir overall airline travel experience in the past year.28
What type of ticket do you (or your company) usually book for these kinds of flights? / Q16. Did you purchase a seat upgrade using money, points or miles on any flight? Frequent Flyer Programs for travelers 15 Two-thirds of 2015 flyers are a member of some airline frequent flyer program. 55% 10% 34% 0% 10% 20% 30% 40% 50% 60%