Transcription
SAS/QC 13.2 User’s GuideThe CUSUM Procedure
This document is an individual chapter from SAS/QC 13.2 User’s Guide.The correct bibliographic citation for the complete manual is as follows: SAS Institute Inc. 2014. SAS/QC 13.2 User’s Guide. Cary,NC: SAS Institute Inc.Copyright 2014, SAS Institute Inc., Cary, NC, USAAll rights reserved. Produced in the United States of America.For a hard-copy book: No part of this publication may be reproduced, stored in a retrieval system, or transmitted, in any form or byany means, electronic, mechanical, photocopying, or otherwise, without the prior written permission of the publisher, SAS InstituteInc.For a Web download or e-book: Your use of this publication shall be governed by the terms established by the vendor at the timeyou acquire this publication.The scanning, uploading, and distribution of this book via the Internet or any other means without the permission of the publisher isillegal and punishable by law. Please purchase only authorized electronic editions and do not participate in or encourage electronicpiracy of copyrighted materials. Your support of others’ rights is appreciated.U.S. Government License Rights; Restricted Rights: The Software and its documentation is commercial computer softwaredeveloped at private expense and is provided with RESTRICTED RIGHTS to the United States Government. Use, duplication ordisclosure of the Software by the United States Government is subject to the license terms of this Agreement pursuant to, asapplicable, FAR 12.212, DFAR 227.7202-1(a), DFAR 227.7202-3(a) and DFAR 227.7202-4 and, to the extent required under U.S.federal law, the minimum restricted rights as set out in FAR 52.227-19 (DEC 2007). If FAR 52.227-19 is applicable, this provisionserves as notice under clause (c) thereof and no other notice is required to be affixed to the Software or documentation. TheGovernment’s rights in Software and documentation shall be only those set forth in this Agreement.SAS Institute Inc., SAS Campus Drive, Cary, North Carolina 27513.August 2014SAS provides a complete selection of books and electronic products to help customers use SAS software to its fullest potential. Formore information about our offerings, visit support.sas.com/bookstore or call 1-800-727-3228.SAS and all other SAS Institute Inc. product or service names are registered trademarks or trademarks of SAS Institute Inc. in theUSA and other countries. indicates USA registration.Other brand and product names are trademarks of their respective companies.
Gain Greater Insight into YourSAS Software with SAS Books. Discover all that you need on your journey to knowledge and empowerment.support.sas.com/bookstorefor additional books and resources.SAS and all other SAS Institute Inc. product or service names are registered trademarks or trademarks of SAS Institute Inc. in the USA and other countries. indicates USA registration. Other brand and product names aretrademarks of their respective companies. 2013 SAS Institute Inc. All rights reserved. S107969US.0613
Chapter 6The CUSUM ProcedureContentsIntroduction: CUSUM Procedure . . . . . . . . . . . . . . . . . . . . . . . .Learning about the CUSUM Procedure . . . . . . . . . . . . . . . . . .PROC CUSUM Statement . . . . . . . . . . . . . . . . . . . . . . . . . . . .Overview: PROC CUSUM Statement . . . . . . . . . . . . . . . . . . .Syntax: PROC CUSUM Statement . . . . . . . . . . . . . . . . . . . .BY Statement . . . . . . . . . . . . . . . . . . . . . . . . . . .Input and Output Data Sets: CUSUM Procedure . . . . . . . . . . . . .XCHART Statement: CUSUM Procedure . . . . . . . . . . . . . . . . . . . .Overview: XCHART Statement . . . . . . . . . . . . . . . . . . . . . .Getting Started: XCHART Statement . . . . . . . . . . . . . . . . . . .Creating a V-Mask Cusum Chart from Raw Data . . . . . . . .Creating a V-Mask Cusum Chart from Subgroup Summary DataSaving Summary Statistics . . . . . . . . . . . . . . . . . . . .Creating a One-Sided Cusum Chart with a Decision Interval . .Saving Cusum Scheme Parameters . . . . . . . . . . . . . . . .Reading Cusum Scheme Parameters . . . . . . . . . . . . . . .Syntax: XCHART Statement . . . . . . . . . . . . . . . . . . . . . . .Summary of Options . . . . . . . . . . . . . . . . . . . . . . .Dictionary of Special Options . . . . . . . . . . . . . . . . . .Details: XCHART Statement . . . . . . . . . . . . . . . . . . . . . . .Basic Notation for Cusum Charts . . . . . . . . . . . . . . . . .Formulas for Cumulative Sums . . . . . . . . . . . . . . . . . .Defining the Decision Interval for a One-Sided Cusum Scheme .Defining the V-Mask for a Two-Sided Cusum Scheme . . . . .Designing a Cusum Scheme . . . . . . . . . . . . . . . . . . .Cusum Charts Compared with Shewhart Charts . . . . . . . . .Methods for Estimating the Standard Deviation . . . . . . . . .Output Data Sets . . . . . . . . . . . . . . . . . . . . . . . . .ODS Tables . . . . . . . . . . . . . . . . . . . . . . . . . . . .ODS Graphics . . . . . . . . . . . . . . . . . . . . . . . . . .Input Data Sets . . . . . . . . . . . . . . . . . . . . . . . . . .Missing Values . . . . . . . . . . . . . . . . . . . . . . . . . .Examples: XCHART Statement . . . . . . . . . . . . . . . . . . . . . .Example 6.1: Cusum and Standard Deviation Charts . . . . . . . . . . .Example 6.2: Upper and Lower One-Sided Cusum Charts . . . . . . . .Example 6.3: Combined Shewhart–Cusum Scheme . . . . . . . . . . 594597599
540 F Chapter 6: The CUSUM ProcedureINSET Statement: CUSUM Procedure .Overview: INSET Statement . . .Getting Started: INSET StatementSyntax: INSET Statement . . . .References . . . . . . . . . . . . . . .601601602604605Introduction: CUSUM ProcedureThe CUSUM procedure creates cumulative sum control charts, also known as cusum charts, which displaycumulative sums of the deviations of measurements or subgroup means from a target value. Cusum chartsare used to decide whether a process is in statistical control by detecting a shift in the process mean.You can use the CUSUM procedure to apply a one-sided cusum scheme, also referred to as a decision interval scheme, which detects a shift inone direction from the target mean. You can specify the scheme with the decision interval h and thereference value k. apply a two-sided cusum scheme with a V-mask, which detects a shift in either direction from the targetmean. You can specify the scheme with geometric parameters (h and k) for the V-mask or with errorprobabilities ( and ˇ ). implement cusum schemes graphically or computationally specify the shift to be detected as a multiple of standard error or in data units estimate the process standard deviation using a variety of methods compute average run lengths (ARLs) read raw data (actual measurements) or summarized data (subgroup means and standard deviations) analyze multiple process variables. If used with a BY statement, PROC CUSUM produces chartsseparately for groups of observations. save cusums and cusum scheme parameters in output data sets tabulate the information displayed on the chart read cusum scheme parameters from an input data set read numeric- or character-valued subgroup variables display subgroups with date and time formats enhance cusum charts with special legends and symbol markers that indicate the levels of stratificationvariables superimpose plotted points with stars (polygons) whose vertices indicate the values of multivariatedata related to the process
Learning about the CUSUM Procedure F 541 display a trend chart below the cusum chart that plots a systematic or fitted trend in the data produce charts as traditional graphics, ODS Graphics output, or legacy line printer charts. Line printercharts can use special formatting characters that improve the appearance of the chart. Traditionalgraphics can be annotated, saved, and replayed.Learning about the CUSUM ProcedureIf you are using the CUSUM procedure for the first time, begin by reading “PROC CUSUM Statement” onpage 541 to learn about input data sets. Then turn to “Getting Started: XCHART Statement” on page 547 in“XCHART Statement: CUSUM Procedure” on page 546. This chapter also provides syntax information andadvanced examples.If you are not familiar with cusum charts, read “Formulas for Cumulative Sums” on page 577 “Defining theDecision Interval for a One-Sided Cusum Scheme” on page 579 and “Defining the V-Mask for a Two-SidedCusum Scheme” on page 580 in the section “Details: XCHART Statement” on page 576. References listsarticles and textbooks that provide more detailed information on cusum charts. The expository articles byLucas (1976) and Goel (1982) and the textbooks by Montgomery (1996) and Ryan (1989) are recommendedintroductory reading.PROC CUSUM StatementOverview: PROC CUSUM StatementThe PROC CUSUM statement starts the CUSUM procedure and it identifies input data sets.After the PROC CUSUM statement, you provide an XCHART statement that specifies the cusum chart youwant to create and the variables in the input data set that you want to analyze. For example, the followingstatements request a one-sided (decision interval) cusum chart:proc cusum data values;xchart weight*lot / schememu0sigma0deltahkrun; onesided8.1000.05012.20.5;In this example, the DATA option specifies an input data set (values) that contains the process measurementvariable weight and the subgroup-variable lot.You can use options in the PROC CUSUM statement to do the following: specify input data sets containing variables to be analyzed, parameters for cusum schemes, or annotationinformation
542 F Chapter 6: The CUSUM Procedure specify a graphics catalog for saving traditional graphics output specify that line printer charts are to be produced define characters used for features on line printer chartsIn addition to the XCHART statement, you can provide BY statements, ID statements, TITLE statements,and FOOTNOTE statements. If you are producing traditional graphics, you can also provide graphicsenhancement statements, such as SYMBOLn statements, which are described in SAS/GRAPH: Reference.See Chapter 3, “SAS/QC Graphics,” for a detailed discussion of the alternatives available for producingcharts with SAS/QC procedures.N OTE : If you are using the CUSUM procedure for the first time, you should read both this chapter and thesection “Getting Started: XCHART Statement” on page 547 in “XCHART Statement: CUSUM Procedure”on page 546.Syntax: PROC CUSUM StatementThe syntax for the PROC CUSUM statement is as follows:PROC CUSUM options ;The PROC CUSUM statement starts the CUSUM procedure, and it optionally identifies various data sets.You can specify the following options in the PROC CUSUM statement.ANNOTATE SAS-data-setANNO SAS-data-setspecifies an input data set that contains appropriate annotate variables, as described in SAS/GRAPH:Reference. The ANNOTATE option enables you to add features to a cusum chart (for example, labelsthat explain out-of-control points). The ANNOTATE data set is used only when the chart is createdas traditional graphics; it is ignored when the LINEPRINTER option is specified or ODS Graphics isenabled. The data set specified with the ANNOTATE option in the PROC CUSUM statement is a“global” annotate data set in the sense that the information in this data set is displayed on every chartproduced in the current run of the CUSUM procedure.ANNOTATE2 SAS-data-setANNO2 SAS-data-setspecifies an input data set that contains appropriate annotate variables that add features to the trendchart (secondary chart) produced with the TRENDVAR option in the XCHART statement. Thisoption applies only when you produce traditional graphics.DATA SAS-data-setnames an input data set that contains raw data (measurements) as observations. If the values of thesubgroup-variable are numeric, you need to sort the data set so that these values are in increasing order(within BY groups). The DATA data set can contain more than one observation for each value of thesubgroup-variable.You cannot use a DATA data set with a HISTORY data set. If you do not specify a DATA orHISTORY data set, PROC CUSUM uses the most recently created data set as a DATA data set. Formore information, see “DATA Data Set” on page 592
Syntax: PROC CUSUM Statement F 543FORMCHAR(index) ‘string’defines characters used for features on legacy line printer charts, where index is a list of numbersranging from 1 to 17 and string is a character or hexadecimal string. This option applies only if youalso specify the LINEPRINTER option.The index identifies which features are controlled with the string characters, as described in thefollowing table. If you specify the FORMCHAR option and omit the index, the string controls all 17features.Value of index1234567891011121314151617Description of CharacterChart Featurevertical barhorizontal barbox character (upper left)box character (upper middle)box character (upper right)box character (middle left)box character (middle middle)box character (middle right)box character (lower left)box character (lower middle)box character (lower right)vertical barhorizontal barbox character (upper right)box character (lower left)box character (lower right)box character (upper left)frameframe, central lineframeserifs, tick (horizontal axis)framenot usedserifstick (vertical axis)frameserifsframecontrol limitscontrol limitscontrol limitscontrol limitscontrol limitscontrol limitsNot all printers can produce the characters in the preceding list. By default, the form character listspecified by the SAS system option FORMCHAR is used; otherwise, the default is FORMCHAR ’j—-j j—j ’. If you print to a PC screen or if your device supports the ASCII symbol set (1 or 2), thefollowing is recommended:formchar 9'XNote that you can use the FORMCHAR option to temporarily override the values of the SAS systemFORMCHAR option. The values of the SAS system FORMCHAR option are not altered by theFORMCHAR option in the PROC CUSUM statement.GOUT graphics-catalogspecifies the graphics catalog for traditional graphics output from PROC CUSUM. This is useful if youwant to save the output. The GOUT option is used only when the chart is created using traditionalgraphics; it is ignored when the LINEPRINTER option is specified or ODS Graphics is enabled.HISTORY SAS-data-setHIST SAS-data-setnames an input data set that contains subgroup summary statistics (means, standard deviations, andsample sizes). Typically, this data set is created as an OUTHISTORY data set in a previous run of
544 F Chapter 6: The CUSUM ProcedurePROC CUSUM or PROC SHEWHART, but it can also be created with a SAS summarization proceduresuch as PROC MEANS.If the values of the subgroup-variable are numeric, you need to sort the data set so that these values arein increasing order (within BY groups). A HISTORY data set can contain only one observation foreach value for the subgroup-variable.You cannot use a HISTORY data set together with a DATA data set. If you do not specify aHISTORY or DATA data set, PROC CUSUM uses the most recently created data set as a DATA data set. For more information on HISTORY data sets, see “HISTORY Data Set” on page 593.LIMITS SAS-data-setnames an input data set that contains a set of decision interval or V-mask parameters. Each observationin a LIMITS data set contains the parameters for a process.If you are using SAS 6.09 or an earlier release of SAS/QC software, you must specify the optionsREADLIMITS or READINDEX in the XCHART statement to read the parameters from the LIMITS data set. In SAS 6.10 and later releases, these options are not needed.For details about the variables needed in a LIMITS data set, see “LIMITS Data Set” on page 592. Ifyou do not provide a LIMITS data set, you must specify the parameters with options in the XCHARTstatement.LINEPRINTERrequests that legacy line printer charts be produced.BY StatementBY variables ;You can specify a BY statement with PROC CUSUM to obtain separate analyses of observations in groupsthat are defined by the BY variables. When a BY statement appears, the procedure expects the input dataset to be sorted in order of the BY variables. If you specify more than one BY statement, only the last onespecified is used.If your input data set is not sorted in ascending order, use one of the following alternatives: Sort the data by using the SORT procedure with a similar BY statement. Specify the NOTSORTED or DESCENDING option in the BY statement for the CUSUM procedure.The NOTSORTED option does not mean that the data are unsorted but rather that the data are arrangedin groups (according to values of the BY variables) and that these groups are not necessarily inalphabetical or increasing numeric order. Create an index on the BY variables by using the DATASETS procedure (in Base SAS software).For more information about BY-group processing, see the discussion in SAS Language Reference: Concepts.For more information about the DATASETS procedure, see the discussion in the Base SAS Procedures Guide.
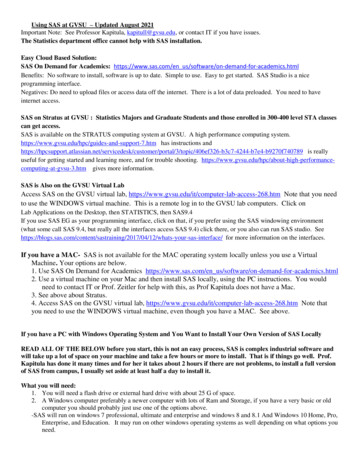
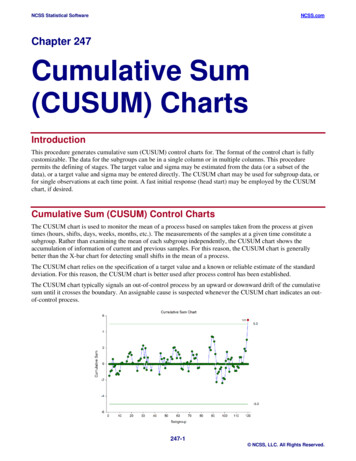
Input and Output Data Sets: CUSUM Procedure F 545Input and Output Data Sets: CUSUM ProcedureFigure 6.1 summarizes the data sets used with the CUSUM procedure.Figure 6.1 Input and Output Data Sets in the CUSUM Procedure
546 F Chapter 6: The CUSUM ProcedureXCHART Statement: CUSUM ProcedureOverview: XCHART StatementThe XCHART statement creates cumulative sum control charts from subgroup means or individual measurements. You can create these charts for one-sided cusum (decision interval) schemes or for two-sided(V-mask) schemes. A one-sided scheme is designed to detect either a positive or a negative shift from thetarget mean, and a two-sided scheme is designed to detect positive and negative shifts from the target mean.You can use options in the XCHART statement to specify parameters for a decision interval or V-mask specify the shift ı to be detected specify the target mean 0 specify a known (standard) value 0 for the process standard deviation or estimate the standarddeviation from the data using various methods tabulate the information displayed on the chart save the information displayed on the chart in an output data set read parameters for the cusum scheme from a data set display a secondary chart that plots a time trend that has been removed from the data add block legends and special symbol markers to reveal stratification in process data superimpose stars at each point to represent related multivariate factors display vertical and horizontal reference lines modify the axis values and labels modify the chart layout and appearanceYou have three alternatives for producing cumulative sum control charts with the XCHART statement: ODS Graphics output is produced if ODS Graphics is enabled, for example by specifying the ODSGRAPHICS ON statement prior to the PROC statement. Otherwise, traditional graphics are produced by default if SAS/GRAPH is licensed. Legacy line printer charts are produced when you specify the LINEPRINTER option in the PROCstatement.See Chapter 3, “SAS/QC Graphics,” for more information about producing these different kinds of graphs.
Getting Started: XCHART Statement F 547Getting Started: XCHART StatementThis section introduces the XCHART statement with simple examples that illustrate the most commonlyused options. Complete syntax for the XCHART statement is presented in the section “Syntax: XCHARTStatement” on page 561, and advanced examples are given in the section “Examples: XCHART Statement”on page 594.Creating a V-Mask Cusum Chart from Raw DataN OTE : See Two-sided Cusum Chart with V-Mask in the SAS/QC Sample Library.A machine fills eight-ounce cans of two-cycle engine oil additive. The filling process is believed to be instatistical control, and the process is set so that the average weight of a filled can is 0 D 8:100 ounces.Previous analysis shows that the standard deviation of fill weights is 0 D 0:050 ounces. A two-sided cusumchart is used to detect shifts of at least one standard deviation in either the positive or negative direction fromthe target mean of 8.100 ounces.Subgroup samples of four cans are selected every hour for twelve hours. The cans are weighed, and theirweights are saved in a SAS data set named Oil.data Oil;label Hour 'Hour';input Hour @;do i 1 to 4;input Weight @;output;end;drop i;datalines;1 8.024 8.135 8.1512 7.971 8.165 8.0773 8.125 8.031 8.1984 8.123 8.107 8.1545 8.068 8.093 8.1166 8.177 8.011 8.1027 8.129 8.060 8.1258 8.072 8.010 8.0979 8.066 8.067 8.05510 8.089 8.064 8.17011 8.058 8.098 8.11412 8.147 8.116 98.0868.1568.018The data set Oil is partially listed in Figure 6.2.
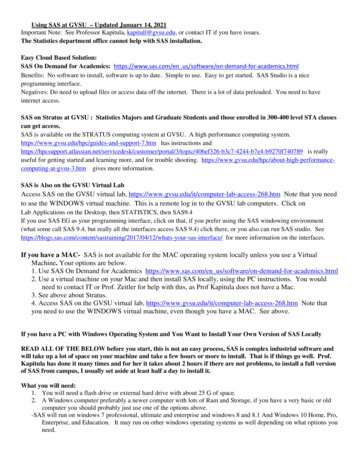
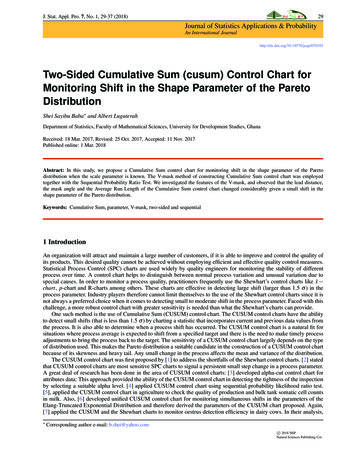
548 F Chapter 6: The CUSUM ProcedureFigure 6.2 Partial Listing of the Data Set OilHour .15738.12538.03138.19838.05048.12348.107Each observation contains one value of Weight along with its associated value of Hour, and the values ofHour are in increasing order. The CUSUM procedure assumes that DATA input data sets are sorted in this“strung-out” form.The following statements request a two-sided cusum chart with a V-mask for the average weights:ods graphics off;title 'Cusum Chart for Average Weights of Cans';proc cusum data Oil;xchart Weight*Hour /mu0 8.100/* Target mean for processsigma0 0.050/* Known standard deviationdelta 1/* Shift to be detectedalpha 0.10/* Type I error probabilityvaxis -5 to 3 ;label Weight 'Cumulative Sum';run;*/*/*/*/The CUSUM procedure is invoked with the PROC CUSUM statement. The DATA option in the PROCCUSUM statement specifies that the SAS data set Oil is to be read. The variables to be analyzed are specifiedin the XCHART statement. The process measurement variable (Weight) is specified before the asterisk(this variable is referred to more generally as a process). The time variable (Hour) is specified after theasterisk (this variable is referred to more generally as a subgroup-variable because it determines how themeasurements are classified into rational subgroups).The option ALPHA 0.10 specifies the probability of a Type 1 error for the cusum scheme (the probability ofdetecting a shift when none occurs).The cusum chart is shown in Figure 6.3.
Getting Started: XCHART Statement F 549Figure 6.3 Two-Sided Cusum Chart with V-MaskThe cusum S1 plotted at Hour 1 is simply the standardized deviation of the first subgroup mean from thetarget mean.S1 D8:093758:100Dp0:050 40:250The cusum S2 plotted at Hour 2 is S1 plus the standardized deviation of the second subgroup mean from thetarget mean.S2 D S1 C8:09258:100Dp0:050 40:550In general, the cusum plotted at Hour t is Stfrom the target mean.St D St1C1plus the standardized deviation of the tth subgroup meanXN t 0p 0 nFor further details, see “Two-Sided Cusum Schemes” on page 578.You can interpret the chart by comparing the points with the V-mask whose right edge is centered at themost recent point (Hour 12). Since none of the points cross the arms of the V-mask, there is no evidence
550 F Chapter 6: The CUSUM Procedurethat a shift has occurred, and the fluctuations in the cusums can be attributed to chance variation. In general,crossing the lower arm is evidence of an increase in the process mean, whereas crossing the upper arm isevidence of a decrease in the mean.Creating a V-Mask Cusum Chart from Subgroup Summary DataN OTE : See Two-sided Cusum Chart with V-Mask in the SAS/QC Sample Library.The previous example illustrates how you can create a cusum chart using raw process measurements readfrom a DATA data set. In many applications, however, the data are provided in summarized form as subgroupmeans. This example illustrates the use of the XCHART statement when the input data set is a HISTORY data set.The following data set provides the subgroup means, standard deviations, and sample sizes corresponding tothe variable Weight in the data set Oil (see the section “Creating a V-Mask Cusum Chart from Raw Data” onpage 547:data Oilstat;label Hour 'Hour';input Hour WeightX WeightS WeightN;datalines;1 8.0938 0.0596 42 8.0925 0.0902 43 8.1010 0.0763 44 8.1198 0.0256 45 8.1013 0.0265 46 8.0800 0.0756 47 8.1145 0.0372 48 8.0830 0.0593 49 8.0618 0.0057 410 8.1023 0.0465 411 8.1065 0.0405 412 8.0993 0.0561 4;The data set Oilstat is listed in Figure 6.4.Figure 6.4 Listing of the Data Set OilstatObs Hour WeightX WeightS 230.0465411118.10650.0405412128.09930.05614
Getting Started: XCHART Statement F 551Since the data set contains a subgroup variable, a mean variable, a standard deviation variable, and a samplesize variable, it can be read as a HISTORY data set. Note that the names WeightX, WeightS, and WeightNsatisfy the naming conventions for summary variables since they begin with a common prefix (Weight) andend with the suffix letters X, S, and N.The following statements create the cusum chart:title 'Cusum Chart for Averageproc cusum history Oilstat;xchart Weight*Hour /mu0 8.100sigma0 0.050delta 1alpha 0.10vaxis -5 to 3 ;label WeightX 'Cumulativerun;Weights of Cans';/*/*/*/*target meanknown standard deviationshift to be detectedType 1 error probability*/*/*/*/Sum';Note that the process Weight specified in the XCHART statement is the prefix of the summary variable namesin Oilstat. Also note that the vertical axis label is specified by associating a variable label with the subgroupmean variable (WeightX). The chart (not shown here) is identical to the one in Figure 6.2.In general, a HISTORY input data set used with the XRCHART statement must contain the following fourvariables: subgroup variable subgroup mean variable subgroup range variable subgroup sample size variableFurthermore, the names of subgroup mean, standard deviation, and sample size variables must begin with theprefix process specified in the XRCHART statement and end with the special suffix characters X, S, and N,respectively.Note that the interpretation of process depends on the input data set specified in the PROC CUSUM statement. If raw data are read using the DATA option (as in the previous example), process is the name of theSAS variable containing the process measurements. If summary data are read using the HISTORY option (as in this example), process is the commonprefix for the names containing the summary statistics.For more information, see “DATA Data Set” on page 592 and “HISTORY Data Set” on page 593.
552 F Chapter 6: The CUSUM ProcedureSaving Summary StatisticsN OTE : See Two-sided Cusum Chart with V-Mask in the SAS/QC Sample Library.In this example, the CUSUM procedure is used to save summary statistics and cusums in an output dataset. The summary statistics can subsequently be analyzed by the CUSUM procedure (as in the precedingexample). The following statements read the raw measurements from the data set Oil (see “Creating a V-MaskCusum Chart from Raw Data” on page 547) and create a summary data set named Oilhist:title 'Cusum Chart for Average Weights of Cans';proc cusum data Oil;xchart Weight*Hour /nochartouthistory Oilhistmu0 8.100/* Target mean for processsigma0 0.050/* Known standard deviationdelta 1/* Shift to be detectedalpha 0.10/* Type I error probabilityvaxis -5 to 3 ;label Weight 'Cumulative Sum';run;*/*/*/*/The OUTHISTORY option names the SAS data set containing the summary information, and the NOCHARToption suppresses the display of the charts (since the purpose here is simply to create an output data set).Figure 6.5 lists the data set Oilhist.Figure 6.5 Listing of the Data Set OilhistCusum Chart for Average Weights of CansObs Hour WeightX WeightS WeightC 930.0561-1.7804There are five variables in the data set. Hour contains the subgroup index WeightX contains the subgroup means WeightS contains the subgroup standard deviations WeightC contains the cumulative sums
Getting Started: XCHART Statement F 553 WeightN contains the subgroup sample sizesNote that the variables in the OUTHISTORY data set are named by adding the suffix characters X, S, N, andC to the process Weight specified in the XCHART statement. In other words, the variable naming conventionfor OUTHISTORY data sets is the same as for HISTORY data sets.For more information, see “OUTHISTORY Data Set” on page 589.Creating a One-Sided Cusum Chart with a Decision IntervalN OTE : See One-sided Cusum Chart in the SAS/QC Sample Library.An alternative to the V-mask cusum chart is the one-sided cusum chart with a decision interval, which issometimes referred to as the “computational form of the cusum chart.” This example illustrates how you cancreate a one-sided cusum chart for individual measurements.A can of oil is selected every hour for fifteen hours. The cans are weighed, and their weights are saved in aSAS data set named Cans:1data Cans;length comment 16;label Hour 'Hour';input Hour Weight comment 16. ;datalines;1 8.0242 7.9713 8.1254 8.1235 8.0686 8.177 Pump Adjusted7 8.229
After the PROC CUSUM statement, you provide anXCHARTstatement that specifies the cusum chart you want to create and the variables in the input data set that you want to analyze. For example, the following statements request a one-sided (decision interval) cusum chart: proc cusum data values; xchart weight*lot / scheme onesided mu0 8.100