Transcription
J. Stat. Appl. Pro. 7, No. 1, 29-37 (2018)29Journal of Statistics Applications & ProbabilityAn International ided Cumulative Sum (cusum) Control Chart forMonitoring Shift in the Shape Parameter of the ParetoDistributionShei Sayibu Baba and Albert LuguterahDepartment of Statistics, Faculty of Mathematical Sciences, University for Development Studies, GhanaReceived: 18 Mar. 2017, Revised: 25 Oct. 2017, Accepted: 11 Nov. 2017Published online: 1 Mar. 2018Abstract: In this study, we propose a Cumulative Sum control chart for monitoring shift in the shape parameter of the Paretodistribution when the scale parameter is known. The V-mask method of constructing Cumulative Sum control chart was employedtogether with the Sequential Probability Ratio Test. We investigated the features of the V-mask, and observed that the lead distance,the mask angle and the Average Run Length of the Cumulative Sum control chart changed considerably given a small shift in theshape parameter of the Pareto distribution.Keywords: Cumulative Sum, parameter, V-mask, two-sided and sequential1 IntroductionAn organization will attract and maintain a large number of customers, if it is able to improve and control the quality ofits products. This desired quality cannot be achieved without employing efficient and effective quality control measures.Statistical Process Control (SPC) charts are used widely by quality engineers for monitoring the stability of differentprocess over time. A control chart helps to distinguish between normal process variation and unusual variation due tospecial causes. In order to monitor a process quality, practitioners frequently use the Shewhart’s control charts like x̄ chart, p-chart and R-charts among others. These charts are effective in detecting large shift (larger than 1.5 σ ) in theprocess parameter. Industry players therefore cannot limit themselves to the use of the Shewhart control charts since it isnot always a preferred choice when it comes to detecting small to moderate shift in the process parameter. Faced with thischallenge, a more robust control chart with greater sensitivity is needed than what the Shewhart’s charts can provide.One such method is the use of Cumulative Sum (CUSUM) control chart. The CUSUM control charts have the abilityto detect small shifts (that is less than 1.5 σ ) by charting a statistic that incorporates current and previous data values fromthe process. It is also able to determine when a process shift has occurred. The CUSUM control chart is a natural fit forsituations where process average is expected to shift from a specified target and there is the need to make timely processadjustments to bring the process back to the target. The sensitivity of a CUSUM control chart largely depends on the typeof distribution used. This makes the Pareto distribution a suitable candidate in the construction of a CUSUM control chartbecause of its skewness and heavy tail. Any small change in the process affects the mean and variance of the distribution.The CUSUM control chart was first proposed by [1] to address the shortfalls of the Shewhart control charts. [2] statedthat CUSUM control charts are most sensitive SPC charts to signal a persistent small step change in a process parameter.A great deal of research has been done in the area of CUSUM control charts: [3] developed alpha-cut control chart forattributes data: This approach provided the ability of the CUSUM control chart in detecting the tightness of the inspectionby selecting a suitable alpha level. [4] applied CUSUM control chart using sequential probability likelihood ratio test.[5], applied the CUSUM control chart in agriculture to check the quality of production and bulk tank somatic cell countsin milk. Also, [6] developed unified CUSUM control chart for monitoring simultaneous shifts in the parameters of theElang-Truncated Exponential Distribution and therefore derived the parameters of the CUSUM chart proposed. Again,[7] applied the CUSUM and the Shewhart charts to monitor oestrus detection efficiency in dairy cows. In their analysis, Correspondingauthor e-mail: b.shei@yahoo.comc 2018 NSPNatural Sciences Publishing Cor.
30S. S. Baba, A. Luguterah: Two-sided cumulative sum (cusum) control chart.the SPC charts detected changes in oestrus detection efficiency in time to be potentially useful in diary management. Itwas pointed out that the correct design of the used control chart is important to receive meaningful classification results.Recently, [8] developed a one-sided CUSUM control chart for monitoring the shape parameter of the Pareto distribution.And lately [11], developed a one sided CUSUM control chart for monitoring shift in the scale parameter δ of the newWeibull-Pareto distribution. In this study, we extend the study of [8] and therefore develop a two-sided CUSUM controlchart for monitoring shifts in the shape parameter of the Pareto distribution.2 Pareto DistributionThe Pareto distribution is named after an Italian civil engineer and economist Vilfredo Pareto. It is a skewed distributionwith heavy or slowly decaying tail. It is a powerful probability distribution that is applied in economics, sociology, andstatistics. It was used by Pareto in modelling national income and wealth distribution in any human endeavour. The Paretodistribution is used in modelling many situations which are not evenly distributed. If the random variable has a Paretodistribution, then the density function is given by;γ cγ(1)xγ 1where x c and the parameters γ 0 and c 0 are the shape and scale parameters respectively. The correspondingcumulative distribution function is given by; c γ(2)Fx (x; γ , c) 1 xThe mean and variance of the Pareto distribution are given by;fx (x; γ , c) γc,γ 1γ 1(3)γ c2,γ 2(γ 2)(γ 1)2(4)µ andσ2 3 Sequential Probability Ratio TestThe Sequential Probability Ratio Test (SPRT) plays a major role in the development of an acceptance sampling plan. [9]SPRT is a joint, subject-by-subject, Likelihood Ratio Test (LRT), where each subject constitutes a stage. According to[10],the CUSUM control charts are roughly equivalent to the SPRT. The SPRT has been used extensively in the developmentof an acceptance sampling plan and this acceptance sampling plan has been used in determining the in and out of controllimits in CUSUM procedures. Suppose that we take a sample of m values x1 , x2 , ., xm successively, from a populationf (x, θ ). Consider two hypotheses about θ , H0 : θ θ0 and H1 : θ θ1 . The ratio of the probabilities of the sample is;Lm m f (x , θ )Πi 1i 1m f (x , θ )Πi 1i 0(5)We select two numbers A and B , which are related to the desired α and β errors. The sequential test is set up as follows;1.As long as B Lm A we continue sampling2.At the first i that Lm A we accept H13.At the first i that Lm 6 B we accept H0An equivalent way of computation is to use the logarithm of Lm . Then, the inequality becomes:mmln f (xi , θ1 ) Σi 1ln f (xi , θ0 ) lnAln B Σi 1(6)The family of test is referred to as SPRT. if:Zi lnc 2018 NSPNatural Sciences Publishing Cor.((xi , θ1 )(xi , θ0 ))(7)
J. Stat. Appl. Pro. 7, No. 1, 29-37 (2018) / www.naturalspublishing.com/Journals.aspthen the sampling terminates when31 zi ln Aor(8) zi 6 ln B(9)has a variance mσ 2 . As mThe zi ’s are independent random variables with variance, say σ 2 0: Obviously,increases the dispersion becomes greater and the probability that a value of Zi will remain within the limits ln B and ln A2tends to zero. The mean, Z̄ , tends to a normal distribution with variance σm , and therefore the probability that it will fallbetween lnmB and lnmm tends to zero.If we take a sample for which Lm lies between A and B for the first n 1 trials, then Lm A at the nth trial, so that weaccept H1 (and reject H0 ). Then by definition, the probability of getting such a sample is at least A times as large underH1 as under H0 : The probability of accepting H1 when H0 is true is, α , and that of accepting H1 when H1 is true is 1 β. This is expressed by:1 βA6(10)αsimilarly, if we accept H0βB (11)1 αWald(1947) showed that for all practical purposes10 and 11 hold as equalities. Thus mi 1 ZiA 1 βα(12)B β1 α(13)andIn practice α and β are small and the use of A and B can increase one of the errors by a very small amount.4 CUSUM control chart for monitoring the shape parameterThe SPRT method is used to construct a two-sided CUSUM control chart for monitoring the shape parameter of the Paretodistribution, when the scale parameter is known. The Likelihood Ratio Test for testing the null hypothesis of no shift inthe shape parameter as against the alternative hypothesis of a shift in the shape parameter is given by:m f (x , γ , c)L1 m Πi 1i 1 mL0 m Πi 1 f (xi , γ0 , c)(14)where L1 m is the likelihood of the new value of the shape parameter, γ and L0 m is the likelihood of the original valueof the shape parameter,γ . The continuation region of the SPRT discriminating between the two hypotheses is given by:γ1m γ1 cΠi 11 ββxγ1 1 γ0 cγ0m1 ααΠi 1 xγ0 1(15)where α and β are types I and II errors. taking logarithm of 15, the continuation region becomeslnβ1 α!γ1γ0!γ1 lnm γ1 cΠi 1xγ1 1γ0m γ0 cΠi 1xγ0 1! ln1 βα!(16)simplifying 16 we obtain:lnβ1 α!" m ln#m (γ1 γ0 ) ln c (γ0 γ1 ) ln x lni 11 βα!(17)c 2018 NSPNatural Sciences Publishing Cor.
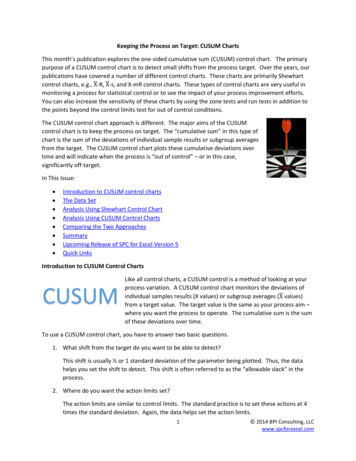
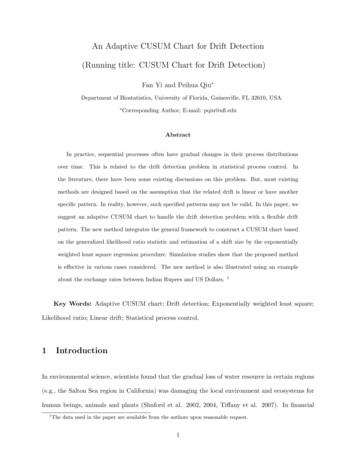
32S. S. Baba, A. Luguterah: Two-sided cumulative sum (cusum) control chart.lnβ1 α!"γ1γ0 m ln!#m (γ1 γ0 ) ln c (γ0 γ1 ) ln x lni 11 βα!(18)A shift in the shape parameter affects the mean and variance of the Pareto distribution. Assuming γ0 is the target value andγ1 (γ1 γ0 ) is the changed values due to a shift in the value of the parameter, the SPRT will be terminated by rejectingor accepting the null hypothesis or by continuing the sampling. The sampling process is stopped by rejecting the nullL1 mhypothesis if ln LL10 mm ln A; which gives a rejection line (γ1 γ0 ) . On the other hand, if ln L0 m 6 ln A is obtained forthe case of (γ1 γ0 ) , then another rejection line is obtained. These two rejection lines give a symmetrical masking:The observations in the sample are used with the mask in a sequential pattern. Consideration (18) and setting β 0 theinequality in (18) reduces to:"m lnγ1γ0!#m (γ1 γ0 ) ln c (γ0 γ1 ) ln x ln α(19)i 1Re-arranging (19) and keeping the term containing x at the left-hand side of the inequality, we obtain:m" m ln ln x 6γ1γ0!# (γ1 γ0 ) ln c ( ln α )(γ0 γ1 )i 1(20)which impliesm" m ln ln x 6γ1γ0!# (γ1 γ0 ) ln c (ln α )(γ1 γ0 )i 1(21)now equation 21 can be wriiten in the form of a straight line as:m ln xi 6 m f g (22)i 1whereln f γ1γ0 (γ1 γ0 ) ln cγ1 γ0(23)andg ln αγ1 γ0(24)Let X1 , X2 , ., Xm be a sample from a Pareto distribution. If the points (m, mi 1 ln xi )are plotted with a suitable scale, thenthe ordinates of the points represent the cumulative sum of the data. Equations 22 and 24 are the effects of a shift in thepopulation parameter,γ . Figure 1 shows a sizeable shift in the parameters if mi 1 ln xi falls outside the lines G1 H1 andG 1 H 1 . The chart is interpreted by placing the mask over the last plotted point as shown in figure 1 If any of the pointslies below G 1 H 1 , then it indicates a decrease in γ and if any of the points falls above, G1 H1 then it shows an increasein γ . If all the points plotted are within the two lines G1 H1 and G 1 H 1 of the V-mask, then the process is in control: Ifthere is a point below G1 H1 then it is concluded that the process is out of control and has a positive shift of the processmean and if there is a point found above G 1 H 1 then the process is out of control and has a negative shift of the processmean.c 2018 NSPNatural Sciences Publishing Cor.
J. Stat. Appl. Pro. 7, No. 1, 29-37 (2018) / www.naturalspublishing.com/Journals.asp33Fig. 1: : v- mask for two-sided cusumThe parameters of the CUSUM chart, known as the angle of the mask and the lead distance, are obtained. From Figure1, tan θ1 slope of the line G1 H1 f and tan θ 1 slope of the line G 1 H 1 f , hence:θ1 tan 1"lnγ1γ0 (γ1 γ0 ) ln c(γ1 γ0 )#(25)where γ1 γ0 andθ 1 tan 1"lnγ1γ0 (γ1 γ0 ) ln c(γ1 γ0 )#(26)where where γ1 γ0Various values of the mask angle, theta , are shown in 1 for various values of the scale parameter, c , and shifts in theshape parameter: The results show that the values of the angle, theta , decreases with an increase in the value of (γ1 γ0 )for any given value of c . Also, as the value of (γ1 γ0 ) increases the value of theta increases with increasing value of c .Again increasing values of γγ10 , decreases the value of thetaTable 1: Values of the angles θ for controlling the parameterscγ0γ11.522.51.5340.94 49.12 54.041.5 3.5 39.66 48.16 53.271.5438.58 47.35 52.611.5 4.5 37.66 46.65 52.061.5536.85 46.05 51.571.5 5.5 36.14 45.51 51.141.5635.51 45.04 50.761.5 6.5 34.94 44.61 50.421.5734.43 44.22 50.111.5 7.5 33.97 43.87 49.83c 2018 NSPNatural Sciences Publishing Cor.
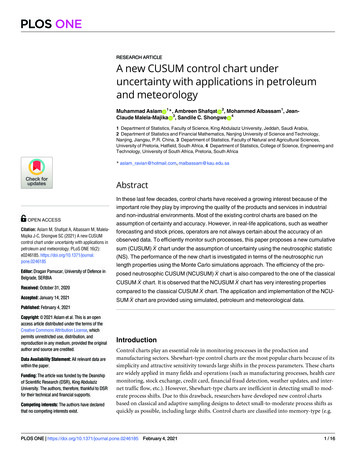
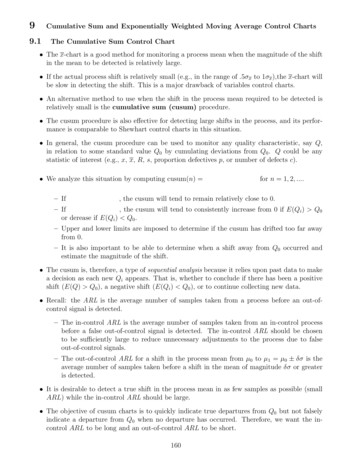
34S. S. Baba, A. Luguterah: Two-sided cumulative sum (cusum) control chart.Table 2: Value of the lead distance for the parameters of the Pareto distribution5 Average Run Length of the two-sided CUSUM control chartThe Average Run Length for the two-sided CUSUM control chart is given by:ARL ln αlnProof by using:ARL whereZ andZ c 2018 NSPNatural Sciences Publishing Cor. ln αE[Z]γ γ1(27)(28)f (x, γ1 , c)f (x, γ0 , c)(29)γ1 cγ1 γ0 cγ0 xγ1 1 xγ0 1(30)Z Then:γ1 γ0 γ1γ0 γ1 γ 1γ0c(γ0 γ1 ) x(γ0 γ1 )(31)
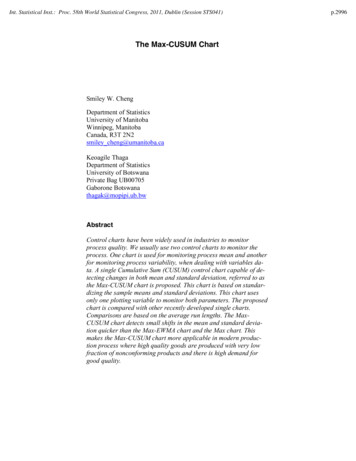
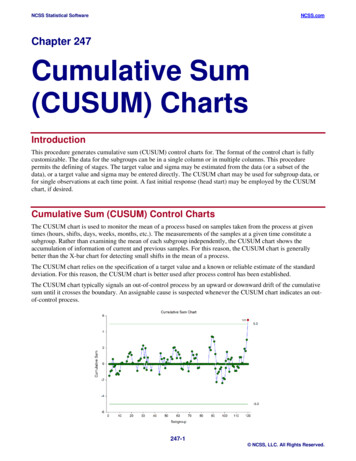
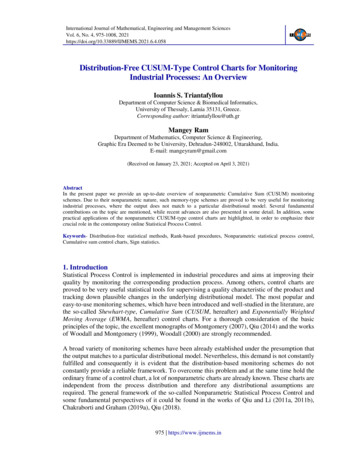
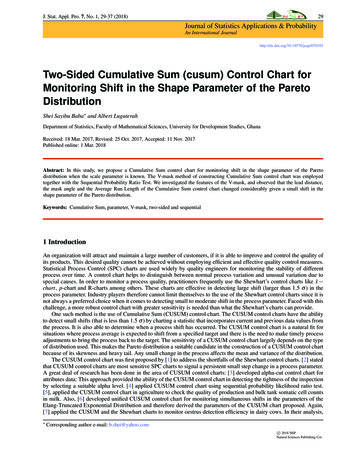
J. Stat. Appl. Pro. 7, No. 1, 29-37 (2018) / www.naturalspublishing.com/Journals.aspTaking natural logarithm of 31:ln Z lnhence:E[ln Z] lnwhereγ1 (γ1 γ0 ) ln c (γ0 γ1 ) ln xγ0(33)ln x f (x, γ1 , c)dx(34)Z candE[ln x] Z γ1 cγ1cxγ1 1ln xdxh c c ln c ie (γ1 1) ln cE[ln x] γ1 cγ1 0 2 γ1γ1and(32)γ1 (γ1 γ0 ) ln c (γ0 γ1 )E[ln x]γ0E[ln x] Then:35E[ln x] substituting 31 into 29 we obtain:E[ln Z] lnand substituting 36 into 26, the ARL is obtained as:ARL (35)(36)h γ γ 2 ln c i11γ12(37) γ (38)1γ0 γ0 γ1γ1 ln αlnγ1 γ0 γ1γ0 γ1(39)Various values of the ARL are given in 3. From the results, for a given value of α , and an increase in the value of (γ1 γ0 ), the value of the ARL decreases. Also, an increase in the ratio, γγ10 , with a given α , decreases the value of the ARL and adecrease in the value of α and a fixed value of γγ10 , increases the ARL.Table 3: Average Run Length (ARL) for controlling the parameter γαγ0γ10.50.050.005 0.0250.10.01 0.0011.5 3.0 3.59 15.51 27.432.831.85 3.695.541.5 3.5 2.51 10.85 19.212.230.91 1.822.731.5 4.0 1.958.4214.891.850.60 1.201.791.5 4.5 1.616.9412.271.590.44 0.881.331.5 5.0 1.385.9410.511.410.35 0.701.051.5 5.5 1.215.239.261.260.29 0.570.861.561.094.718.331.150.24 0.480.731.5 6.5 0.994.307.601.060.21 0.420.631.5 7.0 0.923.977.020.970.18 0.370.551.5 7.5 0.863.706.550.910.16 0.330.496 Practical Demonstration of the use of the Two-sided CUSUM control chartIn this section, the application of the proposed CUSUM control chart is illustrated using hypothetical data simulatedfrom the Pareto distribution. The first ten observations were simulated with γ0 2.5 and c 1.5; the last five observationswere simulated with γ1 5 . Table 4 displays the simulated data and their cumulative sum. The parameters of the V-maskwere calculated using γ0 2.5 c 1.5; γ1 5 and α 0.01. The lead distance and the angle of the mask were 2.7 and 530respectively. The sample number(m) was plotted against the cumulative sum of the data. The V-mask was then placedat the last plotted point to monitor whether the process is in control or out of control as shown in figure 2. It can bec 2018 NSPNatural Sciences Publishing Cor.
36S. S. Baba, A. Luguterah: Two-sided cumulative sum (cusum) control chart.Fig. 2: two-sided cusum plot for the simulated hypothetical dataestablished from figure 2 that the process was out of control as observations 1 to 5 fell above line G1 H1 indicating anincrease in γ . This means an action must be taken in order to bring the process back to control.sampleData(x)ln xCUSUM12.10.70.7210.72.43.1Table 4: Simulated data for the two-sided CUSUM control chart34567891011121.3 1.1 33.2 3.1 2.45.65.21.11.81.20.3 0.13.51.1 0.91.71.60.10.60.23.4 3.57.08.1 9.0 10.7 12.3 12.4 13.0 13.2133.71.314.5141.50.414.9151.10.115.07 ConclusionControl charts play a key role as long as the quality of a product is concerned in the industrial establishment. Thereforeproposing control charts for monitoring the quality of products is not trivial. This CUSUM will particularly be helpfulin determining when the assignable cause has occurred and in situations in which two directions of a system are to bemonitored. It also offers considerable performance improvement relative to the Shewhart charts. It can be applied in thechemical and process industries. The limitation of this CUSUM is that when the mask angle and the lead distance are notwell determined, can lead to inappropriate system adjustments. Further studies can be done on this distribution by lookingat simultaneous shift in both the shape and scale parameters of the distribution.The results of the study showed that the size of the mask angle Θ decreases as the value of (γ1 γ0 ) increases with anygiven value of the scale parameter c . However, given any fixed value of (γ1 γ0 ) , the angle Θ increases for an increasein the value of c. With regards to the lead distance, it can be observed that an increase in the value of (γ1 γ0 ) and giventhe values of α and c , the value of d decreases. Again the value of d increases with fixed value of c and α . However,d decreases as c increases in value, if α and (γ1 γ0 ) values are maintained. On the ARL, it can be established that asthe value of increases, the ARL tends to decrease with any given value of . Also, as the value of decreases, the ARL alsoincreases for fixed values of (γ1 γ0 ) .c 2018 NSPNatural Sciences Publishing Cor.
J. Stat. Appl. Pro. 7, No. 1, 29-37 (2018) / gementThe authors wish to thank the Editor and the reviewers for their suggestions and comments which helped in improving thefinal version of the paper.The authors also wish to thank Mr Sulemana Abdul-Salam for his support on the Latex write-up.References[1] E. S. Page, Continuous Inspection Schemes, Biometrics, 41 (1), 100-115(1954).[2] D. M. Hawkins and D. H. Olwell, Cumulative sum charts and charting for quality improvement, Springer-Verlag, New York ,(1998).[3] , M. Gulbay, C. Kahramam, D. Ruan, and Agir;-Cut., Fuzzy Control Charts for linguistic data, International journal of IntelligentSystems, 19(12), 1173-1195 (2004).[4] G. A. Barnard, Control charts and stochastic processes, J. Royal Stat. Soc. B (Methodological).21, 239-71 (1959)[5] I. Thysen, Monitoring bulk tank somatic cell counts by a multi-process Kalman filter, Acta Agriculturae Scandinavica, Sect. A,Animal Science, 43, 58-64. (1993).[6] A. Luguterah, Unified cumulative sum chart for monitoring shifts in the parameters of the Erlang-Truncated exponential distribution.Far East Journal of Theoretical Statistics50(1), 65-76 (2015).[7] A. De Vries, and B. J. Conlin, Design and performance of statistical process control charts applied to estrous detection efficiency,Journal Dairy Science,86,170-1984 (2003).[8] S. Nasiru, One-sided cumulative sum control chart for monitoring shifts in the shape parameter of Pareto distribution. Int. J.Productivity and Quality Management, 19(2), 160 (2016).[9] A. Wald, Sequential Analysis, (John Wiley, New York, NY 1947)[10] N. L. Johnson, A simple theoretical approach to cumulative sum control charts. Journal of the American Statistics Association,Nature 56(4), 835-40 (1961).[11] S. B. Shei, J. Haruna, and A. Sulemana, One-Sided Cumulative Sum Control Chart for Monitoring Shift in the Scale ParameterDelta (δ ), of the New Weibull-Pareto Distribution: International Journal of Probability and Statistics ,Vol. 6 No. 4 , pp. 76-81 (2017).doi: 10.5923/j.ijps.20170604.02Shei Sayibu Baba received his Higher National Diploma in Statistics from TamalePolytechnic, Bsc in Mathematical Sciences (Statistics option) and an Msc degree in AppliedStatistics both at the University for Development Studies, Navrongo Ghana. His researchinterests are in the areas of control charts and Time Series. He has published in Internationaljournal of Statistics and Applications and International Journal of Probability and Statistics.And also has a vast expericience in teaching at the various levels of education in eanat the Faculty of Mathematical Sciences at the University for aBScStatisticswith Mathematics from the University of Ghana, Msc in Statisticsfrom the University of Cape Coast, and a PhD in Applied Statistics fromthe University for Development Studies (All in Ghana ). Dr Luguterah isa member of several statistical organizations in Ghana and abroad. He iswidely researched and has participated and also presented in several localand International conferences.c 2018 NSPNatural Sciences Publishing Cor.
in milk. Also, [6] developed unified CUSUM control chart for monitoring simul taneous shifts in the parameters of the Elang-Truncated Exponential Distribution and therefore derived the parameters of the CUSUM chart proposed. Again, [7] applied the CUSUM and the Shewhart charts to monitor oestrus detection efficiency in dairy cows. In their .