Transcription
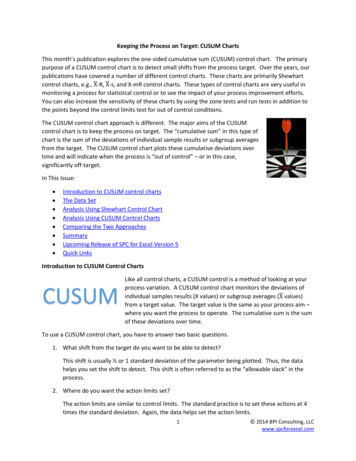
Keeping the Process on Target: CUSUM ChartsThis month’s publication explores the one-sided cumulative sum (CUSUM) control chart. The primarypurpose of a CUSUM control chart is to detect small shifts from the process target. Over the years, ourpublications have covered a number of different control charts. These charts are primarily Shewhartcontrol charts, e.g., ̅X-R, ̅X-s, and X-mR control charts. These types of control charts are very useful inmonitoring a process for statistical control or to see the impact of your process improvement efforts.You can also increase the sensitivity of these charts by using the zone tests and run tests in addition tothe points beyond the control limits test for out of control conditions.The CUSUM control chart approach is different. The major aims of the CUSUMcontrol chart is to keep the process on target. The “cumulative sum” in this type ofchart is the sum of the deviations of individual sample results or subgroup averagesfrom the target. The CUSUM control chart plots these cumulative deviations overtime and will indicate when the process is “out of control” – or in this case,significantly off-target.In This Issue: Introduction to CUSUM control chartsThe Data SetAnalysis Using Shewhart Control ChartAnalysis Using CUSUM Control ChartsComparing the Two ApproachesSummaryUpcoming Release of SPC for Excel Version 5Quick LinksIntroduction to CUSUM Control ChartsLike all control charts, a CUSUM control is a method of looking at yourprocess variation. A CUSUM control chart monitors the deviations of̅ values)individual samples results (X values) or subgroup averages (Xfrom a target value. The target value is the same as your process aim –where you want the process to operate. The cumulative sum is the sumof these deviations over time.To use a CUSUM control chart, you have to answer two basic questions.1. What shift from the target do you want to be able to detect?This shift is usually ½ or 1 standard deviation of the parameter being plotted. Thus, the datahelps you set the shift to detect. This shift is often referred to as the “allowable slack” in theprocess.2. Where do you want the action limits set?The action limits are similar to control limits. The standard practice is to set these actions at 4times the standard deviation. Again, the data helps set the action limits.1 2014 BPI Consulting, LLCwww.spcforexcel.com
It is clear you will need a method of estimating the standard deviation of the process. This is coveredbelow.A CUSUM control chart then tracks the deviations from the target. If a sample result iswithin the allowable slack, the process is considered to be operating on target. Thisresults in a subtraction from the cumulative sum unless it is already zero. If a sampleresult is beyond the allowable slack, the process is considered to be operating off target.This results in an addition to the cumulative sum. If the cumulative sum exceeds theaction limits, the process is assume to be off target.There are two “one-side” cumulative sums. One for deviations that are positive (above the target) andone for deviations that are negative (below the target). Let’s take a look at an example to see how thisworks. We will compare the results when using an individuals control chart to using the CUSUM controlchart.The Data SetYou are producing a chemical that contains a small amount of component Y that isimportant in the use of the chemical. In addition, you know that the optimumconcentration for that component is 0.16 wt. %. You want to control the manufacturingprocess as close to that as possible. You take a sample every batch. The results for thelast 25 batches are shown below.Table 1: The Data SetSampleY wt.%SampleY wt. 183250.201130.166Analysis Using Shewhart Control ChartSince our batch data represents one data point at a time, an individuals control chart (X-mR) can be usedto monitor the results. This is the most common way the data would be analyzed. But remember, thepurpose of a Shewhart control chart is primarily to keep the process in control and to see the impact of2 2014 BPI Consulting, LLCwww.spcforexcel.com
process improvement efforts. With a CUSUM control chart, you are trying to detect small shifts awayfrom the process target.The data in Table 1 were analyzed using the X-mR chart. Please see our October2006 publication for more information on X-mR charts. Figure 1 shows the X chart.This chart monitors the variation in the individual results over time. Figure 2shows the moving range (mR) chart. This chart monitors the variation in the rangebetween consecutive samples. The X chart is in statistical control. There are nopoints beyond the limits and there are no issues with the zone tests or run tests.The process average is 0.172. This is different from the process target of 0.166.But not by much. Is it significantly different? The individual results can varybetween the lower control (LCL) of 0.088 and the upper control limit (0.256). Theprocess is consistent and predictable.Note that 5 out of the last 6 points are above average. Is this a problem? Under the classical controlchart approach, it is not a problem. There is not enough evidence of you to assume that a special causeof variation exists and spend time looking for that special cause. For more information on interpretingcontrol charts, please see our April 2004 publication.The mR chart is in statistical control as well. The average moving range betweenconsecutive samples is 0.032. It can be as great as the UCL of 0.103. Since the rangechart is in control, you can estimate the process standard deviation from the range chart.Remember above where we said you needed a standard deviation ( ). This is where youget it. For the X-mR chart, the standard deviation is given by the following:̅ /1.128 0.0279 RAnalysis Using CUSUM Control ChartsLet’s take a look at the data using a CUSUM control chart. The firststep is to determine the standard deviation of the data. This is usedto set the allowable slack and the action limits. The best way toestimate the standard deviation is from a range control chart. Forthe individuals control chart, this is the moving range chart wheresigma is estimated from the average range. As shown above, theestimate of the standard deviation is 0.0279.The next step is to determine the allowable slack (k). It is common to set this value at ½ to 1 standarddeviation. We will use ½. So,k 0.5(0.0279) 0.01395The next step is to determine the action limits (H). These are usually set as /- 4 sigma. So,H /- 4(0.0279) /- 0.11163 2014 BPI Consulting, LLCwww.spcforexcel.com
Figure 1: X Chart for Y Wt. %Figure 2: mR Chart for Y Wt. %4 2014 BPI Consulting, LLCwww.spcforexcel.com
The next step is to calculate the cumulative sums on the high side (SH, above the target) and on the lowside (SL, below the target). We know that our target is 0.16. The following are the definitions for SHand SL.SH(i) Max[0, SH(i-1) Xi – Target – k]SL(i) Min(0, SL(i-1) Xi – Target k]where i ith sampleSH(i) is the high side cumulative sum for the ith pointSH(i-1) is the high side cumulative sum for the ith – 1 pointXi is the result for the ith pointTarget target valueK allowable slackSL(i) is the low side cumulative sum for the ith pointSL(i-1) is the low side cumulative sum for the ith – 1 pointTake a look at the equation for SH(i). It contains:Xi – Target – k X I – (Target k)So, if Xi (Target k), then the ith sample result is outside the allowable slack range on the high side.Similarly, for SL(i):Xi – Target k Xi – (Target – k)So, if Xi (Target – k), then the ith sample result is outside the allowable slack range on the low side.Figure 3 shows this.Figure 3: On or Off TargetOff targetSample ResultTarget kOn targetTargetOn targetTarget - kOff target5 2014 BPI Consulting, LLCwww.spcforexcel.com
Let’s see how the calculations unfold. Note that the equations for SH and SLinclude the ith and ith -1 results for SH and SL. What about the first sample?There is no sample before the first sample. For the first sample, SH(0) 0 andSL(0) 0.The first sample result is 0.175. Note that this result is above our aim of 0.16. Ifit is far enough away, then it should add to the high side value of SH.SH(1) Max[0, SH(0) 0.175 – 0.16 – 0.01395] Max[0, 0.001] 0.001SL(1) Min(0, SL(0) 0.175 – 0.16 0.01395] Min[0, 0.029] 0The second sample result is 0.152. Note that this result is below our aim. It if is far enough away, then itshould add to the low side value of SL.SH(2) Max[0, 0.001 0.175 – 0.16 – 0.01395] Max[0, -0.021] 0SL(2) Min(0, 0 0.175 – 0.16 0.01395] Min[0, 0.035] 0Table 2 shows the results of the calculations for all 25 samples. Note that both SH and SL return to zeroseveral times.Table 2: CUSUM Calculation 9-0.016-0.0070.0000.000 2014 BPI Consulting, LLCwww.spcforexcel.com
970.124SL0.0000.0000.0000.000Remember that our action limits are /- 0.1116. This value is exceeded by SH(23), our 23rd sample. Thistells us that the process has moved significantly off target and needs to be adjusted to return theprocess to the target value.You could simply use this tabular form for the cumulative sum. However, it is better to chart the results.Figure 4 is a plot of the CUSUM chart.Figure 4: CUSUM ChartThe center line on the CUSUM chart is zero. Both the SH and SL valuesare plotted. You can see how the cumulative sums on the high side beginto pile up around sample 20 and continue until the action limit isexceeded.Once the process has been adjusted back to target, the values of SH andSL are set back to zero. However, there is technique called Fast InitialResponse (FIR) in which the values are not set back to zero, but are set tocertain value, usually 2 standard deviations. This provides a method of7 2014 BPI Consulting, LLCwww.spcforexcel.com
responding faster to off-target operations. You can also start a CUSUM chart with a FIR. Figure 5 showsthat results where the FIR method is used to initialize the chart.Figure 5: CUSUM Chart with FIR InitializationYou can see from this chart that both SH and SL are further away from 0 than in Figure 4. If the processis off target, then the CUSUM control chart will pick it up faster. If it is on target, the CUSUM values willtrend back to zero as shown in the middle of the chart.You can estimate the current process average when a point exceeds the actionlimits. In this example, that occurred at sample 23 and it occurred on the highside. The following can be used to estimate the current process average.Current proces average Target k (SH/NH)where SH value of SH when the action limit was exceeded and NH thenumber of consectuive points above 0 when the action limits were exceeded.You can seen in Figure 4 and Figure 5, that the 23rd result is the fourth point in arow above 0. So, NH 4. With SH(23) 0.113,Current proces average .16 0.01395 (0.113/4) 0.202If the action limit on the low size is exceeded, you find the current process average using:Current proces average Target – k – (SL/NL)8 2014 BPI Consulting, LLCwww.spcforexcel.com
where SL is the value of SL when the action limit was exceeded and NL is the number of consecutivepoints below 0 when the action limit was exceeded.Comparing the Two ApproachesWe examined the data using the individuals control chart and the CUSUMcontrol chart. Did the two charts give us the same information? No, theindividuals control chart indicated that the process was in statisticalcontrol. As of yet, there is no indication that anything has changed in theprocess. On the other hand, the CUSUM control chart indicated that theprocess had drifted off target on sample 23. So, it picked up the changequicker than the classical control chart.But remember: the two types of control charts have different purposes. With the individuals controlchart, the primary purposes are to keep the process in statistical control and to see the impact ofprocess improvement efforts. All processes will have drift in the average. If small shifts in the averagearen’t critical to you, the individuals control chart is fine. It serves it purpose. However, if there is littleroom for error and it is more important that the process operate on target, then consider using theCUSUM control chart. Note that if there is a true shift in the process average, the individuals controlchart will pick it up eventually.One of the biggest disadvantages of the CUSUM control chart is that the underlying data is lost. You arenot looking at actual values. The individuals control chart gives you a picture of what is happening in theprocess through the use of actual values. The CUSUM control chart is the sum of deviations – moredifficult to see the underlying process behavior. And for the most part, if you use the additional tests forout of control (zone tests, etc.) with the individuals control chart, the ability of the individuals controlchart to detect small shifts approaches that of the CUSUM control chart.Note that there are other control schemes for the CUSUM controlchart. These schemes are based on the ARL – the average runlength. ARL is the average number of samples required before anout of control situation occurs. To minimize the number of false outof control points, the ARL should be large when the process isoperating on target. It should be small if the process average hasshifted off target. Different values of k and H create different ARL.Using k 0.5 and H 4 provides a CUSUM control chart that hasgood ARL for a shift in process average of one standard deviation.For more information, please see “Introduction to Statistical QualityControl” by Douglas C. Montgomery. You can also search online for“CUSUM ARL” to find more information. The ARL is based on apoint beyond the action or control limits.SummaryThis publication has introduced the one-sided CUSUM control chart. This type of control chart monitorsthe cumulative sum of deviations from the process target. It is designed to detect small shifts in theprocess average from the target value. It is called “one-sided” because there is a cumulative sum on the9 2014 BPI Consulting, LLCwww.spcforexcel.com
high side (above the target) and a cumulative sum on the low side (below the target). You can adjustthe CUSUM ability to detect shifts by changing the values of k (the allowable slack) and H (the actionlimits). This type of chart will detect the process shift much quicker than waiting for a point beyond thecontrol limits for the individuals control chart. However, applying the zones tests to the individualscontrol chart improves its ability to detect those small shifts.Upcoming Release of SPC for Excel Version 5We are preparing to release version 5 of our SPC for Excel software. This new version is packed withnew techniques. These include: 26 different charting options to monitor your processesMultiple histogramsGroup histogramsNon-normal process capabilityBox-Cox and Johnson data transformationDistribution fittingPower and sample size calculationsMaintain customized formatting on charts when updatingPurchase our version 4 at current pricing between now and October 1 and qualify for a free upgrade toversion 5.Our anticipated release data is October 1, 2014. For more details on SPC for Excel Version 5, please clickhere.Quick LinksVisit our home pageSPC for Excel SoftwarePreview of Version 5SPC TrainingSPC ConsultingSPC Knowledge BaseOrdering InformationThanks so much for reading our publication. We hope you find it informative and useful. Happy chartingand may the data always support your position.Sincerely,Dr. Bill McNeeseBPI Consulting, LLC10 2014 BPI Consulting, LLCwww.spcforexcel.com
The CUSUM control chart approach is different. The major aims of the CUSUM control chart is to keep the process on target. The "cumulative sum" in this type of chart is the sum of the deviations of individual sample results or subgroup averages from the target. The CUSUM control chart plots these cumulative deviations over


