Transcription
JReport Designer Tutorial
Table of ContentsTutorial: Organization of This Part.1Lesson 1: Installing and Starting JReport.3Introduction.3Installing JReport.3Running JReport.3Viewing the Demo Reports.3Setting up JDBC Driver if Necessary.4Example 1: Installing a Sybase JDBC Driver.4Example 2: Installing an Oracle JDBC Driver.5Example 3: Installing an Interbase JDBC Driver.6Lesson 2: Creating a Report From Report Wizard.7Introduction.7Creating a Simple Report Using Report Wizard.8Placing Parameters in Your Report.17Lesson 3: Creating and Printing Reports From Multiple Tables.21Introduction.21A Sample Standard Report with Multiple Tables.21Creating a Report With Multiple Tables.22Using Report Wizard.22Formatting and Editing Your Rough Report.23Adding Color to Your Report.25Adding Images to Your Report.26Adding and Editing Formulas and Summaries.26Formatting Fields.30Final Formats and Edits.30Printing and Exporting to HTML.32Lesson 4: Creating Form Letters, Charts, Cross Tabs and Sub reports.38Introduction.38Form Letters.38Charts and Graphs.41Cross Tab Reports.46Sub reports.50Lesson 5: Developing Columnar Report.54Introduction.54Developing a Columnar Report.54Limits.57Lesson 6: Creating a Report with UDS.58Introduction.58Address Data Source Example.59Compiling and Running Address UDS.59Adding Address UDS into JReport Catalog.59Making a Report with Address UDS.61I
Tutorial: Organization of This PartThe Tutorial book contains basic report building instructions and includes the reporting features that you will find useful.The idea is that after you have walked through this Tutorial, you can easily follow the examples and build your ownreports. For in depth feature coverage such as building reports on XML, EJB, stored procedure, SQL file, please refer tothe JReport Designer User's Guide. This tutorial contains six lessons: Lesson One: Installing and starting JReport Designer, including basic data source and connection setup. Lesson Two: Creating a simple report with only a table. Also include the most actions for designing report. Lesson Three: Creating reports with multiple tables, learn simple report edit work using the designer. Get to knowJReport Query Editor and exporting feature. Lesson Four: Creating several typical reports form letters, charts, cross tabs and Subreport. Lesson Five: Learning to develop a horizontal page break report. Lesson Six: Here is a very simple example showing how to use user data source to develop a report.JReport Manual RoadmapThe following picture lists the other books in the JReport Designer manual, JReport Enterprise Server manual andJREntViewer manual, and the relationship between them. You are advised to start with the JReport Designer manual.With some report designing knowledge, it is easy to learn JReport Enterprise Server in the Client/Server architecture.JReport Designer manual includes four books: Getting Started, Tutorial, User's Guide, User Reference.JReport Enterprise Server (abbreviated as JREntServer) manual contains three books: Getting Started, Tutorial, User'sGuide. In addition, the JREntViewer manual is for using JREntViewer with JREntServer.For a complete coverage of the features, operations and other information, please refer to the specific book:JReport Designer Getting StartedAn introduction to JReport. It covers issues associated with installation, setup and configuration of JReport. It is acombination of informational topics and strategic references to various topics in JReport Designer User's Guide andJReport Designer User Reference books.JReport Designer User's GuideIn depth coverage of JReport Designer's features and generally explains how to use the product. Browse to locate the1
Tutorial: Organization of This Partchapters that are of interest to you for step by step instructions.JReport Designer User ReferenceSpecifications, providing technical, system and other reference information related to JReport built in objects, built informula functions and APIs.JREntServer Getting StartedAn introduction to JReport. It covers issues associated with installation, setup, and configuration of JReport EnterpriseServer. It describes most informational topics and references in the JREntServer User's Guide.JREntServer TutorialBasic Server configuration, administration and accessing instructions. After walking though the tutorial, you will be able touse the server for managing the interaction between Client and Server that enables activities such as scheduling andrunning reports.JREntServer User's GuideProcedures that will allow you to gain a more in depth understanding of JREntServer. We have detailed the stepsinvolved in advanced Server features such as JSP, national language support, server API, application server integration,JReport (Client) Viewer Bean.JREntViewer ManualComplete coverage of features and instruction for using JREntViewer with JREntServer. Client API usage is alsointroduced in this book.Index2
Lesson 1: Installing and Starting JReportIntroductionIn this lesson, we assume that JReport Designer to C:\JReport of a Window 2000 system.Installing JReportTo install JReport software, take the following steps.1. Download the JReport install program jrpsetup.exe from the Jinfonet web site: http://www.jinfonet.com.2. Run jrpsetp.exe and follow the prompts to install.Running JReportYou can run JReport using either the shortcut or the batch file created by the setup program.To run the batch file, From the desktop, double click My Computer, go to C:\JReport\bin\JReport.bat, run Jreport.bat. Or, from an MS DOS command prompt, issue the following commands:C:\ cd\jreport\binC:\jreport\bin\ jreport.Viewing the Demo ReportsJReport Designer organizes report files and related objects into catalogs. You must open a catalog before you can view,change, or create reports. A set of example reports are provided in the catalog called Tutorial.cat during the setupprocess.To open this catalog,1. Start up JReport Designer using one of the methods above.2. On the initial Open Report dialog, make sure that catalog in use is C:\JReport\Demo\Reports\Tutorial.cat.3. If the catalog has not been properly set, press the Browse button to select the corresponding catalog from theopen dialog.To view one of the example reports, click the Existing tab and select one of the reports in the list. You can choose one ofthree browsers to inspect the design and various elements of a report. Resource ViewerOrganized into three tabs: Data, Reports and Styles. The Data tab diplays the query used by the current reportas well as DBFields, summaries, formulas and parameters available for the current report. Catalog BrowserContaining all resources that you can use to build a report. By default, the base query for this report is expandedin the Catalog Browser. Data fields that are currently used in the report are shown with a red mark. Report InspectorAll the objects in the current report are organized into a tree structure on the top part of the Report Inspectorwindow, with the currently selected object highlighted. The properties and values of the current report objects areshown on the bottom part. For most values, clicking the value will let you change it or select a new value from adialog.3
Lesson 1: Installing and Starting JReportYou can now go to Lesson 2 to learn how to design a simple report using Report Wizard. However, if you are using adatabase system that requires a native JDBC driver, you should follow the instructions below to correctly install the JDBCdriver.Setting up JDBC Driver if NecessaryTo show you how to connect to a database via a JDBC driver, we first provide a summary of the steps required, which isfollowed by three examples. Here are the steps:1. Install the JDBC driver according to the instructions of the JDBC driver provider.2. For JReport Designer, edit %installroot%\bin\JReport.bat to append the classpath for the JDBC driver.%installroot% is the path where you installed JReport Designer.3. Connect to a database via the JDBC driver in JReport Designer by the following steps:a). Start up JReport Designer. On the Open Report dialog, click Browse to open an existing catalog if nocatalog is selected. Click the Cancel button on the Open Report dialog.b). Click Catalog Browser on the View menu to bring out Catalog browser. If you do not want to connect tomultiple database in one catalog, you can create a new catalog first by clicking New Catalog on the File menu.c). Select the Default node in Catalog browser, and then click the New Datasource buttonon the toolbar.Provide a name for the new data source (the first data source you connect to is set as Default by JReportDesigner, and cannot be modified or deleted) on the Input Database Name dialog to bring out the Get JDBCConnection Information dialog.d). Uncheck Use ODBC Data Source, which is checked by default.e). Enter the URL of the database in the JDBC URL field on the Get JDBC Connection Information dialog. Forthe format of the URL please refer to the instructions of your JDBC driver (An example has been provided in thefollowing: Installing a Sybase JDBC Driver section).f). Enter your User Name and Password for the connection.g). Check JDBC Driver, enter the JDBC driver class name in the JDBC Driver text box.h). Click the OK button. The Add Table dialog box will appear to let you add tables into the catalog.Example 1: Installing a Sybase JDBC DriverThe following example illustrates how to connect to a Sybase database server with the name SybServer, port No. 5000,database pubs2, user ID sa, and password 123456:1. Install Sybase JDBC driver Jconnect.class, run the SQL file sql server.sql to create the JDBC metadatatables. (Please refer to Sybase installation user's guide for further details.)2. Edit %installroot% JReport\bin\JReport.bat to append the archive file of the driver to the classpath:Change: . classpath "c:\JReport\lib\report.zip; . lib\i18n.jar" .To : . classpath "c:\JReport\lib\report.zip;c:\jconnect\classes; .lib\i18n.jar" .3. Connect to the database via the JDBC driver in JReport Designer.First, click Catalog Browser on the View menu to bring out Catalog browser.4
Lesson 1: Installing and Starting JReport4. Click the New Datasource button on the toolbar, provide a name for the new data source, and click OK to bringout the Get JDBC Connection Information dialog.5. Uncheck the check box Use ODBC Data Source and enter jdbc:sybase:Tds:SybServer:5000/pubs2 in theJDBC URL field.6. Enter the User ID sa and password 123456. Check the JDBC Driver check box. Enter the JDBC driver classname com.sybase.jdbc.SybDriver in the JDBC Driver text box.7. Another way to specify the JDBC driver name is to edit and add the driver name to the file%InsallRoot%\bin\jdbcdrivers.properties.8. Click the OK button. Then use the Add Table dialog to add tables into the catalog.Example 2: Installing an Oracle JDBC DriverThe following example illustrates how to connect to an Oracle database server with the name p02 wuhb, port No. 1521,database orcl, user ID scott, and password tiger:1. Install Oracle JDBC driver classes12.zip/Classes12.jar (for Oracle 8i or 9i) or ojdbc14.jar (for Oracle 9i).(Please refer to the user's guide of Oracle installation for further detail.)2. Edit %installroot%JReport\bin\JReport.bat to append the archive file of Oracle thin driver to classpath:Change: . classpath "c:\JReport\lib\report.zip; . lib\i18n.jar" .To : . classpath 111.zip; .5
Lesson 1: Installing and Starting JReportlib\i18n.jar" .3. Connect to the database via the JDBC driver in JReport Designer.First, click Catalog Browser on the View menu to bring out Catalog browser.4. Click the New Datasource button on the toolbar, provide a name for the new data source, and click OK to bringout the Get JDBC Connection Information dialog.5. Uncheck the checkbox Use ODBC Data Source and enter jdbc:Oracle:thin:@p02 wuhb:1521:orcl in theJDBC URL field.6. Enter the User ID scott and password tiger. Check the JDBC Driver check box. Enter the JDBC driver classname oracle.jdbc.driver.OracleDriver in the JDBC Driver text box.7. Another way to specify the JDBC driver name is to edit and add the driver name to the file%InstallRoot%\bin\jdbcdrivers.properties.8. Click the OK button, then use the Add Table dialog to add tables into the catalog.Example 3: Installing an Interbase JDBC DriverThe following example illustrates how to connect to an Interbase database server with the name InterbaseServer,database demo.gdb, user ID TUTORIAL, and password TUTORIAL.1. Install Interbase JDBC driver interclient.jar. (Please refer to the user's guide of Interbase client installation forfurther detail.)2. Edit %installroot%JReport\bin\JReport.bat to append the archive file of Interbase thin driver to classpath:Change: . classpath "c:\JReport\lib\report.zip; . lib\i18n.jar" .To : . classpath lient.jar; .lib\i18n.jar" .3. Connect to the database via the JDBC driver in JReport Designer.First, click Catalog Browser on the View menu to bring out Catalog browser.4. Click the New Datasource button on the toolbar, provide a name for the new data source, and click OK to bringout the Get JDBC Connection Information dialog.5. Uncheck the check box Use ODBC Data Source and enter jdbc:interbase://InterbaseServer/c:\demo.gdb inthe JDBC URL field.6. Enter the User ID TUTORIAL and password TUTORIAL. Check the JDBC Driver check box. Enter the JDBCdriver class name interbase.interclient.Driver in the JDBC Driver text box.7. Another way to specify the JDBC driver name is to edit and add the driver name to the file%InstallRoot%\bin\jdbcdrivers.properties.8. Click the OK button, then use the Add Table dialog to add tables into the catalog.Now that your data source is set up, you can go to Lesson 2 where you will learn how to design a simple report usingReport Wizard.6
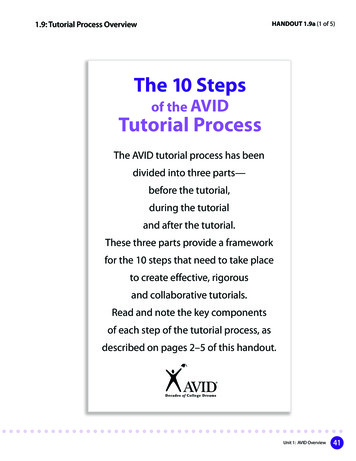
Lesson 2: Creating a Report From Report WizardIntroductionYou can build a report with Report Wizard of JReport Designer, and you can modify an existing report by dragging anddropping operations and changing the values of the object properties.In this lesson, you will learn to create a simple report using Report Wizard.JReport provides you with twelve kinds of report templates which can simplify your editing work. You can choose atemplate to your liking in the initial Open Report dialog. Below is an example report with the title "Customer SalesReport" in left alignment format. Detailed customer records are grouped by Country and within each country by Region.The Sales from last year are totaled for each Region and for each Country.Customer Sales ReportCountry: USARegion: CACityCustomer NamePhone NumberAnnual SalesCupertinoThe Island Coffee(408) 777 0001 98,239.00 IrvineCafe International(714) 243 9548 51,958.00Los GatosInternational Coffee Hut(650) 867 9879 81,349.00Palo AltoAutomatic Java Machines(650) 239 4690 74,986.00San FranciscoCafe San Francisco(415) 288 9090 67,823.00Annual Sales Totals: 374,355.00Region: NYCityCustomer NamePhone NumberAnnual SalesDix HillThe Ultimate Bean(212) 938 4491 54,738.00New YorkStarmug Coffee(212) 834 9082 101,001.00New YorkAbsolute Java(212) 946 3462 50,600.00ScarsdaleThe Java King(914) 657 9823 78,321.00Annual Sales Totals: 284,660.00Annual Sales Total in the USA: 659,015.007
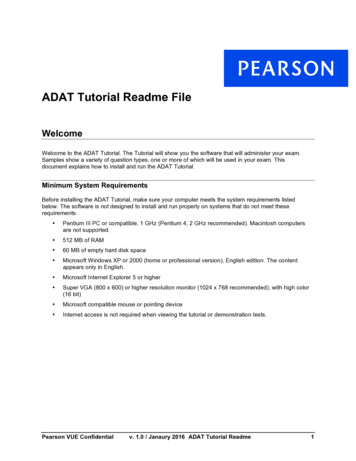
Lesson 2: Creating a Report From Report WizardBuilding a report from a database is time consuming, but with JReport Designer, it only takes a matter of minutes tocompile your data into a professional looking report.Creating a Simple Report Using Report Wizard1. Start JReport Designer according to the instructions from lesson one.2. When the Open Report dialog appears, for this tutorial you should use the following catalog:C:\jreport\Demo\Reports\Tutorial.catwhere c:\jreport is the path where you installed JReport Designer. You can use the Browse button to browse tothe catalog file.3. With the New tab active, click the Left Alignment icon to select it.4. Click the Create button to launch Report Wizard.5. With the first four tabs of Report Wizard, you can specify the source of data and select data to be displayed inthe report.Data Selects the data source from all data objects to form a working set.Joins Joins multiple tables using JReport Designer's default settings or manually.Conditions Specifies the criteria which will retrieve data from the database to form the query of the report.Display Selects which fields to show in the report.Let's first look at the Data tab. Here you should select a data source from the Catalog Data Source drop downlist first, and then choose the objects you are interested in from the list below and place them into the WorkingSet list. For this example, we select the Default data source, and in the list below, expand the Connection item.Next, under the Tables node select the Customers table. Click thebutton to add all of the fields in the tableto the working set, or drag the fields to the Working Set directly. You can also expand the table and addindividual field one by one to the working set.8
Lesson 2: Creating a Report From Report WizardBy placing the objects in the working set, you have implicitly instructed JReport Designer to create a query, whichwill retrieve all of the data you will need for the report.6. Skip the Joins tab, since the report we are creating is a one table report.7. Click on the Conditions tab. You can specify search conditions in this tab.You can type your search criteria both in the format of Filter and QBE.In the Filter format, a search condition expression will appear on the screen, which enables you to type yoursearch criteria. The Expression includes not only the DBField selected, but also formulas and parameters. Youcan also manually type the strings supported by the database.If you select the QBE (Query By Example) format, you will specify the search criteria in a template resemblingthe data record. All the data fields are shown to you, you just enter information that restricts the search to thespecified criteria.Here we want to compare the sales in California and New York. Therefore, in QBE, type the following conditions.Once finished, click the View SQL button to preview the SQL statement about your selection query so far.9
Lesson 2: Creating a Report From Report WizardNotes: With QBE format, column names may not show completely. For example, column name"Customers Country" is cut off and shows only "Customers Cou". To show the full column name, movethe mouse cursor to the line between two columns, till the cursor becomes a double headed arrow, youcan move the line by dragging and dropping. You can adjust the order of the column. Move the mouse cursor on the column name, press the leftbutton, and drag the column to the place you want.8. Click on the Display tab.Usually not all of the fields from a query need to be visible in a report. You should indicate which fields to displayby selecting the objects from the working set and adding them to the list on the right.For this example, select: City, Customer Name, Phone, Fax and Annual Sales to display in the report.10
Lesson 2: Creating a Report From Report WizardNote: You can remove the selected field using buttonor change their order using buttonsoron thetop of the list.9. Click the Group tab.Note: Records in a report are usually organized into groups based on certain criteria. With the Group/Sort tabyou can enter the criteria to define multi level groups. You can also specify the ordering of groups and orderingof records within each group.We will group the data by selecting Country and then by Region. The arrows in the Direction column indicatethe sorting sequence of the groups. You can choose from descending order (c,b,a), ascending order (a,b,c) orspecify a special ordering criteria.11
Lesson 2: Creating a Report From Report Wizard10. Next you can sort records within the groups you created by clicking the Sort tab and selecting the sorting fields.Here choose the City field to sort the records, as shown below.12
Lesson 2: Creating a Report From Report Wizard11. Click the Summary tab to specify summary functions.To generate a total sales amount for each Region group, select Annual Sales, clickto move it to theSummary Fields. The Function drop down list allows you to select a summary function such as sum, count,minimum, maximum. We select Sum for this example to see a total of Annual Sales. The Sum Function iscomputed when Break Field changes value at the end of a group. Clicking the Region field will cause a sum tobe created for each Region group.To generate a total sum of annual sales in the country, move Annual Sales to Source Fields again, select theSum function for it. Leaving Break Fields empty. You can see Grandtotal in the Style column, JReportDesigner calculates the total annual sales.13
Lesson 2: Creating a Report From Report Wizard12. Click the Style tab to specify the page orientation.14
Lesson 2: Creating a Report From Report Wizard13. Click Finish to generate the report. The following is part of the report in Design mode.When the report Design window appears, you can make any adjustment you like to the report layout.15
Lesson 2: Creating a Report From Report WizardReport Inspector can be used to examine and change the objects in the report. Just highlight an object inReport Inspector to change its properties, such as font, size, color.For more information, please refer to User's Guide Refining the Report Layout Report Inspector.Another simple way to edit your report is through dragging, dropping, and clicking the Toolbar and the Menu bar.In Design mode, first highlight the object you want to edit by clicking it. When the cursor becomes a cross, youcan then move the highlighted object by dragging and dropping.For this example, we have to manually move the column names from the PageHeader section to the secondGroupHeader section, and move report title to the PageHeader section.For more information about how to edit the report layout, please refer to User's Guide Refining the ReportLayout.After editing, your report in Design mode may look like this:14. Click on the View tab to run your report and view it. What you are seeing is still a rough copy of your report.16
Lesson 2: Creating a Report From Report Wizard15. Final work on your report.Now you are ready to fine tune your report and give it a professional look. Remember, Report Wizard providesyou with a quick start but JReport Designer provides a wealth of tools for you to adjust the report to yourpreference. Use Report Inspector to change font, size, position, and other variables. Do not forget that you canalso move items anywhere in Design view. Try to insert labels and texts and place objects in headers/footers anddetails.Placing Parameters in Your ReportFrequently you need to specify a parameter when running a report. For example, you may want to input an order date asan input parameter when running a report so that only orders on that date will be displayed. Typically, parameters areused as part of the query conditions (search criteria) so that only records satisfying the specified parameter will beretrieved to become part of the report.1. Select DBField from the Insert menu list, and then on the Insert DBField dialog select the Parameters tab, or onthe Edit toolbar, click the Insert Parameter button directly.17
Lesson 2: Creating a Report From Report Wizard2. Click on the New button to create a new parameter.3. The next window should appear after clicking on the new button. The example parameter we created belowallows the last person who edited the report to place his name on it.18
Lesson 2: Creating a Report From Report WizardIn the Parameter Name text box, type in a name for your parameter. We chose " Editor" for this example. In thePrompting Text area, please enter a message that will appear. Our message was, "Please type in the name ofthe last person who edited."Note: You can only create a one line statement.4. The Value Type should be left as String. This allows the parameter to remain the same as text. There are alsoother Value Types.Reference Notes: User Reference JReport Objects ParameterFinally, place an example in the Default Prompt Value so that you have a format to follow. We chose "JohnSmith" since our parameter deals with name.5. Click OK to finish.6. Select the new parameter and click the Insert button. Place it into your report.7. Click on the View tab to view your report.8. The following window will appear when you view the report.You can type in any text field in the area. The default butt
JReport Designer organizes report files and related objects into catalogs. You must open a catalog before you can view, change, or create reports. A set of example reports are provided in the catalog called Tutorial.cat during the setup process. To open this catalog, 1. Start up JReport Designer using one of the methods above. 2.