Transcription
Next PageWelcome to the JReport TutorialThank you for your interest in JReport, the leading Embedded Reporting Solution for JavaApplications. With JReport, intuitive and sophisticated reporting can be customized andintegrated as a natural extension of any application.This guide is intended to provide an overview of the JReport solution, embedded reportingconcepts, and detailed step-by-step lessons on using JReport. To allow for lessons to becompleted in a reasonable time frame, not all of the features of JReport are covered.This guide contains three parts: Part I: JReport Overview and SetupThis part briefly introduces reports and JReport. Part II: Quick StartThis part introduces the most powerful yet easy-to-use web tools of JReport:JDashboard, Visual Analysis, Web Report Studio and Page Report Studio. Part III: Advanced ReportingThis part talks about some advanced reporting features of JReport: how to use JReportDesigner to create data resources and use the resources to build reports; how theresources are published to JReport Server and managed on the server, and so on.
This version of the JReport Tutorial is developed and written for Windows. File names andpaths, sample JSP code, and screen shots in this guide are based on the Windows operatingsystem. However, you can get a Unix version of the JReport Tutorial by changing the paths tothe Unix format.If you encounter any technical issues that prevent completion of the tasks outlined in thisguide, please do one of the following: Contact our technical support department at http://www.jinfonet.com/contactsupport/, available 24 hours a day, seven days a week. This service is available free ofcharge to registered evaluators for up to 30 days after you receive the JReportEvaluation package. Search the JReport Knowledge Base for issue resolution.Click the right arrow () below to begin reading the first track.Next Page
Previous Page Next PagePart I: JReport Overview and SetupThis chapter provides an overview of JReport. It contains the following sections:Who Uses JReport?What Is a Report?Lifecycle of a ReportJReport Product OverviewJReport Sample ReportsSetting Up JReport on Your SystemClick the right arrow () below to begin reading the chapter.Previous Page Next Page
Previous Page Next PageWho Uses JReport?JReport delivers an enterprise-wide solution. Therefore different types of users throughoutyour organization will use JReport. Each type of user will be able to understand the featuresand find value in JReport as it relates to their job function or reporting requirements.There are five general types of JReport users. Each type of user can focus on specific areas ofthis tutorial as described below: Business AnalystIf you are a business analyst, you should understand how JReport Page Report Studio andWeb Report Studio allow you to create a special category of reports called ad hocreports. Unlike the predefined reports in JReport Designer, you build these reports in theruntime environment based on a data model built and published by a report developer.You can also create a dashboard rather than a web report or page report, usingpredefined data components with JDashboard, or use the WYSIWYG product JReportVisual Analysis to visualize the result of every step of your work.Focus on tracks in Part II: Quick Start. Report Developer
If you are a report developer, you will use JReport Designer, JReport's visual designenvironment. This intuitive desktop design tool uses familiar conventions such asproperty panels, toolbars, style sheets, and drag and drop placement to support everyaspect of the report design process. You will quickly become proficient in using thedesign environment and be able to create professional reports.Focus on Creating Page reports, Creating Business Views and Creating Web Reports andCreating Library Components in Part III. Systems Analyst or Application Server AdministratorIf you are a systems analyst or application server administrator, you should know thatthe JReport solution is managed from a single access point, a web-based console. TheJReport solution offers many different deployment options, enabling existingarchitecture to be leveraged. It can be embedded in a web application via a selfcontained WAR/EAR file to provide a reporting service or it can operate as a standaloneserver.See Publishing, Running and Administering Resources. End UserIf you are an end user of reports, you should understand the many different presentationstrategies that are available. You can decide which format best delivers the informationthat you need to make timely and critical business decisions. With JReport, reports can
be viewed and exported to a variety of formats including Applet, HTML, PDF, Excel, XML,RTF, CSV, PostScript, Page Report Result and Web Report Result. JReport's Page ReportResult and Web Report Result outputs enable you to interact with and customize reportviews to obtain exactly the information needed.See JReport Sample Reports and Creating and Analyzing Ad Hoc Reports. Application DeveloperIf you are a Java application developer, you should understand that both JReportDesigner and JReport Server are 100% Java-based tools that run on almost any platform.By offering a robust set of Java APIs, JReport can be seamlessly embedded as a naturalextension of your application. In addition to being directly accessed from any Javaprogram via APIs, all reports and functionality can be accessed through HTTP.Focus on Integrating Reports and Dashboards in Part III.Previous Page Next Page
Previous Page Next PageWhat Is a Report?A report is comprised of a report template and a dataset. Reports in JReport can be classified into two categories: Dynamic - The layout and data to be included is defined at report design time but can also be modified atruntime. Ad Hoc - Reports that are built on business views at runtime by end users.Report templateA report template contains static text and graphics as well as placeholders for data.When a report is in the runtime environment, it connects to the data source associated with the report, executes thequery, and applies the fetched data to the template thereby creating a report result file:Therefore, each report result represents a unique data set; the one that exists at the time the query is run.Data sources and datasetsReports pull data from data sources via queries or business views, and then expose the results to the report designer.JReport supports the following types of data sources: Relational databases through JDBC connections
Data warehouses Java objects XML data Metadata layers User-defined data sources Hierarchical data sources Web service data sources MongoDB data sourcesA dataset is the data that the JReport Server returns at runtime from a JReport query or business view.Previous Page Next Page
Previous Page Next PageLifecycle of a ReportJust like an application, a report has a distinct life cycle. The life cycle contains the following phases:Phase 1: Determine requirements (report developer)The first fundamental requirement comes from the intended end users of the report. First, determine who willbe the end user of the report and then identify the general purpose of the report. Ask what decisions thoseusers need to make and how often they need to make them (daily, monthly, or other).Second, you should determine the specific pieces of data that need to be presented in the report and how thepieces map to the data source. Look for common data elements that span multiple reports.Third, you need to determine the security implications associated with the report. Are there pieces of datathat need restricted access? Are there regulatory drivers of the report?Fourth, determine the expected demand of the report result. Will on-demand report results be necessary orcan the report be scheduled? Will report results need to be saved, and for how long?Fifth, determine the desired report output format. For most Java applications delivery via the Web is thepreferred method to present information. However, there may be other end users who don't need or wantWeb-based information. Perhaps they require the report be delivered in a standard business format (such asExcel or PDF) or printed.
Phase 2: Develop report template (report developer)A template can be thought of as a report blueprint that contains static text and graphical objects as well asplaceholders to display the data pieces needed on the report. The template definition includes the query thatneeds to execute to provide the data, as well as the database connection on which to execute it.Share a report prototype that includes sample data with the end users to see if it meets their requirementsand also to obtain feedback on the scope and layout of the report.Phase 3: Publish report results (system administrator)Publishing a report template executes the query and merges the resulting data set with the template. Theresult is a report instance that is available in the context of JReport Server. Report results can be saved toother locations, and in various formats such as HTML, PDF, RTF, and others.Communicate with the end users regarding how they can access the report and then provide training, asneeded. Include a way for the end users to provide feedback; acknowledge feedback and build releaseschedule.As report production scales up, the system administrator should monitor performance and apply theappropriate load balancing and security measures.Phase 4: Access report results (end user and business analyst) and administer (system administrator)After a report is generated, end users can access it in a variety of ways. A report can be viewed through theJReport Server user console, through a Java application, or routed to a delivery target such as an e-mailaddress or printer. The business analyst can also build ad hoc reports as needed.The system administer monitors the report access environment through the JReport Server administrationconsole.
Phase 5: Update report template (report developer)Collect feedback from the end users to determine any needed improvements to the layout or behavior of thereport. Also, modify security as needed (add/drop users) and update data source connections.Previous Page Next Page
Previous Page Next PageJReport Product OverviewJReport delivers operational business intelligence to enterprise applications through powerful embedded reporting.JReport is a complete Java reporting solution that provides sophisticated enterprise reporting, ad hoc reporting, and data analysis. A 100%Java EE architecture and a rich set of APIs allow JReport to be seamlessly embedded into any application, providing end users with atransparent interface to easily generate reports, share information, and analyze data. With JReport, any report can be made interactive,extending the "life" of a report by allowing users to easily sort, group, navigate, and filter via the Web. This wide range of functionality,including the ability to drill down on data, enables users to quickly derive value from their business intelligence.JReport's architecture takes advantage of the portability, scalability, and ease of integration associated with Java EE technology to providea powerful, flexible reporting solution that fits perfectly within any application architecture.
JReport Designer is a Swing-based Integrated Development Environment (IDE) that enables sophisticated report design and presentation ofcritical business data. It provides an intuitive interface, reusable report components, flexible layout, and a toolset for designing and testingreports. With JReport Designer, you can build reports using simple drag and drop techniques or by using the Report Wizard. Data can beaccessed from any data source to design and preview reports in order to deliver information to end users in the most relevant and intuitive
manner. Rapid creation and modification of reports is accomplished by toggling between design mode and view mode where the report willbe displayed with the actual dataset. Once report design is complete, the report is published to JReport Server for generation, delivery, andmanagement.JReport Server is a 100% Java report generation and management tool. It enables efficient management, sharing, scheduling, versioning,and delivery of reports and enables reporting to be integrated into the workflow of any Java application. The high-performance engine canscale to any workload. Report results can be saved to a versioning system, sent to enterprise/workgroup printers, or e-mailed. WithJReport, reports can be viewed in any modern enterprise format including Page Report and Web Report using any standard browser, HTML,TEXT and standard business documents, such as PDF, Excel, and RTF. JReport Server also supports on-demand, live report creation andmodification, providing JReport’s powerful ad hoc solution.JDashboard delivers interactive data visualization and analysis to users. Users can freely choose the objects they want to display in thedashboard, without having to know how these objects were created, what data sources to use, what styles to set, and so on. A dashboardcan hold multiple data components so that when browsing the dashboard users are able to see multiple data aspects. Within a dashboard,data components are able to communicate with each other via the message mechanism. This allows actions such as common filters to beapplied to all the components of a dashboard even when coming from different data sources.Page Report Studio and Web Report Studio enable reports to be accessed through a web browser via Dynamic HTML, or AJAX. With PageReport Studio and Web Report Studio, end users can create their own richly visual and interactive reports for powerful and secure dataexploration in a completely self-service manner. Using Page Report Studio and Web Report Studio's advanced capabilities, users can modifyreports using dynamic filter and sort, drag and drop columns to and from an existing report, dynamically change chart types, pivot
crosstabs, drill report data to specific groups, and convert report components or create an entirely new report.Visual Analysis is a WYSIWYG product to visualize the result of every work step. Simply by dragging and dropping data fields onto a layoutmodule, users are able to visually create crosstabs and charts step by step. The use of colors, sizes, shapes, and pie slices demonstrates thedata in rich aspects.Previous Page Next Page
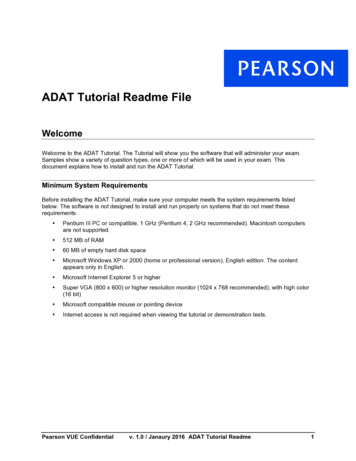
Previous Page Next PageJReport Sample ReportsJReport comes with many pre-built sample reports. This document describes a few of the sample reports, so that you cansee how your own reports may look. The reports that you will be building in this tutorial are simpler than the samplereports.Report sample 1: Invoice reportThis is a typical invoice report, on which end users can perform the filtering, sorting and going functions on key columnsby right-click functionality:
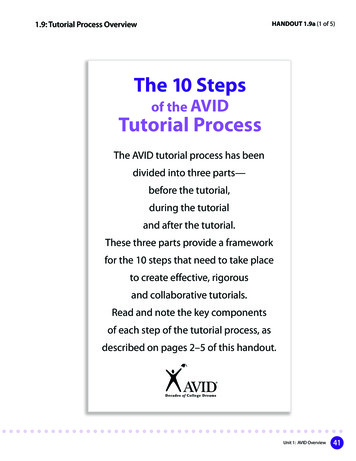
Report sample 2: Stock chartEnd users can use this report to track performance indices over time. By using the mouse over, end users can instantlyview specific metrics for a designated point in time:Report sample 3: Shipment details reportBy using web controls in the report, end users can dynamically change the results of the report.
To see more sample reports, visit evious Page Next Page
Previous Page Next PageSetting Up JReport on Your SystemThe JReport Tutorial assumes that you have downloaded and installed both JReport Designerand JReport Server on a Windows 10 machine.The JReport Tutorial also assumes that you are performing the lessons on a Windows 10machine and therefore operating system specific commands and screen shots reflect this.However JReport can run on multiple platforms.JReport Designer has the following system requirements:JReport Designer System RequirementsRecommendedMinimum RequirementsRequirementsOS:Windows x64, Unix x64,Windows, Unix, Linux, z/Linux x64, z/Linux64, OS Linux, MacOS SierraX EI CapitanCPU:Intel Core 2Intel P4 Xeon 3.0GHzFree4 GB2 GBFree Disk: 2 GB1 GBMemory:
JDK:7 or above7 or aboveBrowser:Latest releases ofChrome 23, Firefox 20,Chrome, Firefox, IE,IE 9, Edge, Safari 10Edge, SafariJReport Server has the following system requirements:JReport Server System RequirementsRecommendedMinimum RequirementsRequirementsOS:Windows x64, Unix x64,Windows, Unix, Linux, z/Linux x64, z/Linux64, OS Linux, MacOS SierraX EI CapitanCPU:Intel Core 2Intel P4 Xeon 3.0GHzFree8 GB4 GBMemory:Free Disk: 10 GB1 GBJDK:7 or above7 or aboveBrowser:Latest releases ofChrome 23, Firefox 20,Chrome, Firefox, IE,IE 9, Edge, Safari 10Edge, SafariYou can download a JDK version at loads/index.html.
Notes: JReport supports Java VMs from Sun and IBM. You can try using other Java VMs, but theircompatibility cannot be guaranteed. Jinfonet technical support welcomes any feedbackon the use of other Java VMs. If you want to use JReport Server on a z/Linux system, you must download the JDKspecially used for IBM from ware/java/ and the version should be at least V7. You are not recommended to run JReport in the Internet Explorer Compatibility Viewmode.Previous Page Next Page
Previous Page Next PagePart II: Quick StartIn this part, we will introduce the most powerful yet easy-to-use web tools of JReport.JDashboard enables displaying multiple predefined library components created from differentdata sources in one dashboard freely and conveniently. Report components and Visual Analysistemplates can also be inserted in dashboards.Visual Analysis is simply used for analyzing data step by step visually by combining text orgraphics display type and color/size/pie slice/shape customization.Web Report Studio aims at faster and simpler design and creation of multi-component reportsor table reports, easier customization, and better presentation style.Jump to the corresponding tracks to view detailed lessons:Track 1: Self-service Dashboard with JReportTrack 2: Performing Visual AnalysisTrack 3: Creating and Analyzing Ad Hoc ReportsBefore starting this part, make sure your JReport Server is started and the JReport Start Page isopened (for details, refer to Starting JReport Server).Click the right arrow () below to begin reading the part.
Previous Page Next Page
Previous Page Next PageTrack 1: Self-service Dashboard with JReportDashboard is a new way of information delivery. Users can create, edit and browse dashboards from the JReport Server user console using JDashboard. With pre-builtlibrary components, users can freely choose the objects they want to display in a dashboard, without having to know how these objects were created, what datasources to use, what styles to set, etc. Report data components and Visual Analysis templates can also be inserted in dashboards directly. A dashboard can holdmultiple library components so that when browsing the dashboard users are able to see multiple data aspects. Within a dashboard, library components are able tocommunicate with each other via the message mechanism. This allows actions such as common filters to be applied to all the components of a dashboard even whencoming from different data sources so as to achieve data synchronization.Task 1: Create a dashboard and insert library componentsTask 2: Insert a report component into dashboardTask 3: Synchronize the componentsTask 4: Use a slider to filter on QuantityTask 5: Insert a third party gadget (stock widget)Task 6: Export the library componentsTask 7: Use the configuration panel to change parametersTask 8: Share parameters among componentsTask 9: Insert an analysis template into dashboard
Task 10: Run a report in JDashboardTask 11: Set a dashboard as the server home pageNote: A JDashboard license for JReport Server is required in order to perform this track. If you do not have the license, please contact your Jinfonet Softwareaccount manager to obtain it first.Task 1: Create a dashboard and insert library components1. On the JReport Server Start Page, click Dashboards in the Create category.The JDashboard window is displayed with a blank dashboard created.
2. Click the Resources buttonon the toolbar to display the Resources panel, which lists all the data resources and components that can be inserted indashboards.3. Expand the Component Library Public Components SampleReports folder and drag Sales by Category.lc to the dashboard body.4. Drag Crosstab.lc in the same folder to the right of the first component.5. Clickon the top right of the Resources panel to hide the panel.6. Click the Arrange button7. Click the Save buttonon the toolbar to align the two library components.on the toolbar.8. In the Save As dialog, replace Dashboard 1 with Products in the File Name text box, then click OK to save the dashboard into the My Reports folder in theserver resource tree.Task 2: Insert a report component into dashboardReport components created from business views can be inserted in dashboards directly.
1. Clickon the toolbar to display the Resources panel.2. Go to the Reports Public Reports SampleReports folder, expand ShipmentStatus.wls and drag TableComp to the dashboard body below the existingcomponents. Hide the Resources panel.3. Clickon the toolbar to align the three library components.
4. Save the dashboard.Task 3: Synchronize the componentsIn this task, we want to click any value of the Category field in the crosstab to automatically update the chart. This is achieved by delivering a filter synchronizationmessage between the two library components.1. Right-click on any Category value in the crosstab column header, Blends for example, and select Send Sync Filter from the shortcut menu.2. The chart automatically receives the synchronization message because it is created based on the same business view as the crosstab and contains the fieldCategory too. To view details of the message, right-click the chart and select Receive Sync. The filter message is shown in the Receive Sync dialog. Close thedialog.
3. Click any value in the crosstab column header, for example Bold. The chart is filtered to show data of the Bold category only after it receives thesynchronization message.You may find that the crosstab is also filtered. This is because at report design time, the library component designer has predefined to make it receive a filtermessage too. You can right-click on the crosstab and select Receive Sync to view the details if you want.
4. We will remove the filters from the components. Click the Clear Filters button5. Clickon the toolbar.on the toolbar to save the dashboard.Task 4: Use a slider to filter on Quantity1. Clickon the toolbar to display the Resources panel, then from the Toolbox node, drag Filter Control to the dashboard body below the table.2. In the Insert Filter Control dialog, input Sales Quantity in the Title text box and select Range Slider as the control type.3. Expand the Select Fields drop-down list. The two business views used by the three data components in the dashboard are listed. You can select a common fieldin both business views to filter the three data component at the same time via the slider. Here we only want to filter data components that useWorldWideSalesBV.
4. Check Quantity in WorldWideSalesBV, then click outside of the drop-down list to close it. Click OK to insert the slider.
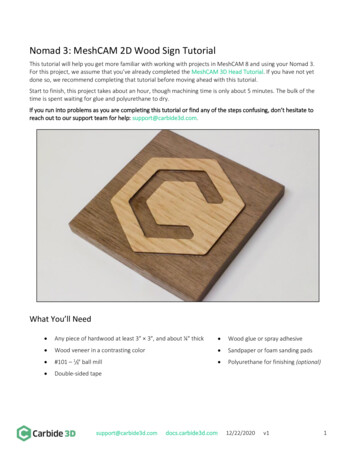
5. Hide the Resources panel.Next, we will use the slider to show the data for Quantity between 5000 and 8000 only.6. Uncheck the All checkbox on the slider. Drag the left arrow to set a minimum range 4983 and the right arrow to set a maximum range 8031. The chart andcrosstab are filtered. The table uses the other business view so it is not changed.
7. Save the dashboard.Task 5: Insert a third party gadget (stock widget)1. Clickon the toolbar to display the Resources panel, then drag URL Frame from the Toolbox node to the dashboard body on the right of the slider. TheInsert URL Frame dialog is displayed.2. In the Title text field, input My Stocks, and in the URL text box, type in http://edulifeline.com/includes/stocks widget/.3. Click OK. The specified web page is then inserted into the dashboard.
4. Hide the Resources panel and save the dashboard.Task 6: Export the library components1. Click the Export buttonon the toolbar. The Export dialog appears.2. Select Customize Layout from the Layout drop-down list.By default, all the exportable library components are arranged using a tabular style according to their positions in the dashboard in the Design tab on the right. Eachtabular cell can hold no more than one component. Sliders and gadgets cannot be exported so they are not available here. Next, we will change the layout of thecomponents a little bit by removing the crosstab on the right of the chart and adding it below the table.3. Right-click anywhere in the cell containing the crosstab, select Remove from the shortcut menu.
4. Scroll down to the blank cell below the table. Drag Crosstab from the Resources box to the cell.
When exporting tables and crosstabs, by default only the data currently displayed in the dashboard will be exported. In our dashboard the table contains severalpages and we can view only one page at a time, that is to say only the currently displayed page will be exported. We want to get the full data of the table in theexported result so we need a further setting.5. Right-click in the cell holding the table, select Filter from the shortcut menu, then choose the All option and click OK.
6. Click the Export buttonon the toolbar. In the Export dialog, keep the default settings to export the dashboard to a PDF file.7. Click OK. The exporting process begins. When finished, you can open the PDF file to view the result.8. Close the Export dialog and save the dashboard.Task 7: Use the configuration panel to change parametersWhen a library component uses parameters and its configuration panel is enabled, you can make use of the configuration panel to change its parameter values.1. On the table, place the mouse anywhere on the title bar, then click the Options buttondown list to display the configuration panel.that appears on the title bar and select Edit Setting from the drop-
2. Clickin the value box for the Shipper parameter. The Enter Values dialog appears.3. Check the Custom radio button, select UBS Uniform Logistics and clickto add it to the right box, then click OK.
4. Click OK in the configuration panel. The table result is then changed based on the parameter value.5. Save the dashboard.Task 8: Share parameters among components
When two or more library components in a dashboard contain parameters that meet the following cases, the parameters can be shared among them. After sharingparameters, you just need to provide values to one group of the parameters and all related components will be able to receive them. The numbers of the parameters in each library component are the same. According to the parameter order in each library component, the orders of the parameter data types are the same. For example, the parameter data types in acomponent are String, Number, and Boolean. If there is another component in which the parameter data types are also String, Number, and Boolean, the twocomponents fulfill the condition of the same parameter data types. It is up to users to make sure the to-be-shared parameters contain some common values.In this task, we will insert two library components having similar parameters and see the difference between before and after the parameters are shared.1. Clickon the dashboard title bar to add a new dashboard. A new tab is created, labeled Dashboard 2.2. Clickon the toolbar to display the Resources panel.3. Expand Component Library Public Components SampleReports and drag Count Shipment by Ship Type.lc and Count Shipment by Territory.lc one byone to the dashboard body. Hide the Resources panel.4. Click the Options buttonClose the dialog.on the toolbar and select Share Parameter. The displayed dialog shows that the two library components have shared parameters.
5. Click the Enter Parameter Values buttonon the toolbar. The Enter Parameter Values dialog lists the following parameters. Close the dialog.
Next we will remove the parameter share between the two components to see how many parameters we need to specify.6. Clickon the toolbar and select Share Parameter. In the displayed dialog, select either component and click the Cancel Share button on the top right,then click OK.7. Clickon the toolbar to access the Enter Parameter Values dialog again. Now it lists separate pairs of the Start Date, End Date, and Territory/Shipperparameters used by the two library components. Close the dialog.
8. Clickon the toolbar to save the dashboard as Shipment.Task 9: Insert an analysis template into dashboard1. Keep the Shipment dashboard active.2. Clickon the toolbar to display the Resources panel.3. Go to the Reports Public Reports SampleReports folder, expand VA Analysis.va and you can find a VCTObject under it. Drag VCTObject into thedashboard body.
4. Save the dashboard.Task 10: Run a report in JDashboard1. Keep the Shipment dashboard active.2. From the Resources panel, drag Coffee Sales.wls in the Reports Public Reports SampleReports folder to the dashboard body, then hide the panel.3. The report is loaded into a separate tab via Web Report Studio.
Task 11: Set a dashboard as the server home page
1. In the web browser, change from the JDashboard tab to the JReport Server Start Page tab.2. Click Profile in the Manage category.3. In the General tab of the Profile page, check the Use a Dashboard checkbox for the Home Page option, then click OK. Click OK in the prompt message.4. Click Resources o
This version of the JReport Tutorial is developed and written for Windows. File names and paths, sample JSP code, and screen shots in this guide are based on the Windows operating