Transcription
Table of ContentsExecutive Summary . 1Mission Changes. 3Energy Management . 4Scope 1 & 2 Greenhouse Gas Reduction. 6Scope 3 Greenhouse Gas Reduction. 6Energy Intensity Reduction . 7EISA Evaluations . 7Metering . 7Water Management . 9Water Use and Management - Potable . 9Water Use and Management - Industrial, Landscape and Agriculture . 10Waste Management . 12Municipal Solid Waste . 12Construction & Demolition Waste Diversion . 13Fleet Management . 14Clean & Renewable Energy . 15Sustainable Buildings. 17Guiding Principles . 17Integrated Engineering Research Center. 18PIP-II Cryogenics Building . 18Acquisition & Procurement . 19Measurements, Funding & Training . 20Travel & Commute . 21Fugitives & Refrigerants . 22Electronic Stewardship . 23Data Center Power Usage Effectiveness . 24HEPCloud Project. 24Resilience . 26Executive Summary Table . 28
Executive SummaryFermi National Accelerator Laboratory is an international hub for particle physics. Fermilab’s employees andusers drive discovery in particle physics by building and operating world-leading accelerator and detectorfacilities, performing pioneering research with national and global partners, and developing new technologiesfor science that support U.S. industrial competitiveness. Fermilab’s science strategy for the future delivers onthe U.S. particle physics community’s goals as outlined in the Particle Physics Project Prioritization Panel’s2014 report. The strategy’s primary ten-year focus is a world-leading neutrino science program anchored by theLong Baseline Neutrino Facility (LBNF) and Deep Underground Neutrino Experiment (DUNE).Fermilab’s 6,800-acre site and extensive infrastructure supports the laboratory’s particle physics researchprogram, including the experiments at the Fermilab Accelerator Complex user facility and others located aroundthe world. The laboratory’s infrastructure is being primed for significant change to support the requirements ofthe international LBNF/DUNE and PIP-II projects. LBNF and DUNE will be powered by megawatt beamsfrom an upgraded and modernized accelerator complex made possible by the Proton Improvement Plan II (PIPII). The flagship facility comprised of LBNF, DUNE, and PIP-II will be the first international mega-scienceproject based at a Department of Energy national laboratory.The operation of Fermilab was different in 2020 than from any other in its 53-year history as a result of thenovel COVID-19 pandemic crisis. Beginning in early March, measures were taken to help control the spread ofthe virus by drastically reducing staff on site for work. Most of the laboratory’s workforce was quicklytransitioned to remote work by maximizing telecommuting opportunities, with only essential staff initiallypermitted on site to maintain the operation of key accelerator systems and to ensure security of the facility. Asrestrictions eased in subsequent months, a phased return to onsite work plan was implemented balancing bothrisk and mission need. The impacts to site operations were significant and these are reflected in Fermilab’sFY2020 sustainability metrics.The laboratory consumed just 66% of anticipated electricity in FY2020. The near complete closure of thefacility in late winter forced a suspension of experimental physics as the pandemic unfolded. Fermilab adjustedby using the opportunity to begin on site preparation work for LBNF earlier than planned, providing the projectan early springtime start to civil construction ahead of schedule.Fermilab’s vehicle fleet consumed 15,000 gallons less fuel than the previous year due to dramatically reducedtransportation needs across the site. Similarly, as working remotely became the new norm for virtually all staff,telework employees drove 5.28 million fewer miles commuting to and from work. This is the lowest recordedcommuter mileage since Fermilab has tracked this metric. The reduction in travel produced an associateddecrease in greenhouse gas tailpipe emissions of 35 %. Emissions associated with business airline travelsimilarly decreased due to pandemic restrictions, with laboratory staff flying 8.2 million fewer miles in 2020.Greatly reduced staff on site produced significantly less waste, generating 40% less municipal waste from theprevious year.Greenhouse gas emissions associated with operations in FY2020 were correspondingly at very low levels, withScope 1 and 2 emissions showing a 72 % reduction from the recorded 2008 baseline, and Scope 3 emissions78% below baseline.Overall potable (drinking) water use was higher than Fermilab’s 5-year consumption average and likely due tothree large and persistent below ground leaks in the water distribution system. The leaks were repaired,however dramatically reduced on site staff added to the challenge of leak discovery.1
Fermilab expects that as the novel Coronavirus pandemic is mitigated in 2021 and with emerging vaccines, thelaboratory will resume some level of previous onsite staffing presence. It is expected that Fermilab would seetherefore a related bounce in the previously mentioned metrics. However, the laboratory is engaging in a“Future of Work” planning process to identify a new level of regular, sustained telecommuting practice andother post-pandemic working conditions. Some of those lasting changes may yield longer term, sustainedreductions in commuting emissions, water consumption, waste production, and other sustainability metrics.2
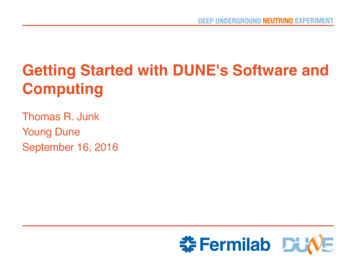
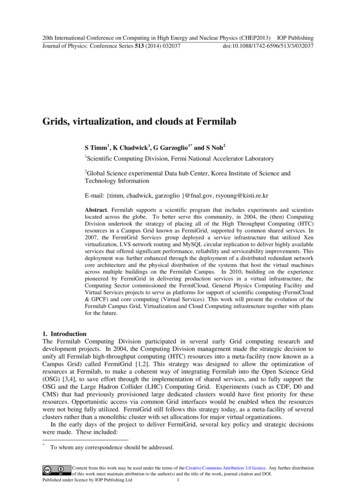
Mission ChangesFermilab’s organization and infrastructure continue to evolve primarily in support of hosting the internationalLong Baseline Neutrino Facility (LBNF) and the Deep Underground Neutrino Experiment (DUNE). Byextension, the ongoing build-out of the Proton Improvement Plan-II (PIP-II) accelerator at Fermilab is a toppriority for the laboratory. The multi-year pivot towards this new experiment requires modernized, state-of-theart onsite infrastructure to support anticipated scientific opportunities for discovery. Upgrades to the acceleratorcomplex enabled by the PIP-II project will provide megawatts of beam power to LBNF/DUNE. These upgradeswill yield a significant increase in the amount of energy consumed by the laboratory.In addition to modernized facilities and infrastructure at Fermilab in support of LBNF/DUNE/PIP-II, theDepartment of Energy has a real-property lease with the South Dakota Science and Technology Authority(SDSTA) at the Sanford Underground Research Facility (SURF) in Lead, South Dakota. Significant realproperty improvements have commenced at SURF in both leased space and non-leased space in support of theDOE science mission.Fermilab has recently been selected to lead a national center for advancing quantum science and technology.The planned new Superconducting Quantum Materials and Systems Center (SQMS) at Fermilab will worktowards the development and deployment of a beyond-state-of-the-art quantum computer based onsuperconducting technologies. The center also will develop new quantum sensors, which could lead to thediscovery of the nature of dark matter and other elusive subatomic particles. The revolutionary leaps in quantumcomputing and sensing that the center aims for will be enabled by a unique multidisciplinary collaboration thatincludes 20 partner organizations consisting of other national laboratories, academic institutions and industry.Groundbreaking ceremony this past summer for the PIP-II cryogenic plant3
Energy ManagementPerformance StatusFermilab’s electrical energy consumption was 66.6% of anticipated use in FY2020. Most of the reduction wasdue to powering down the accelerator as the laboratory drastically reduced operations in mid-March in responseto the COVID-19 pandemic. An accelerator maintenance shutdown originally planned to begin early June wasbegun 2 months early. The laboratory used this opportunity to begin site preparation work sooner thanoriginally planned for civil construction work associated with the LBNF project. In addition, many HVACsystems in buildings used to support employees were placed in the unoccupied mode to conserve resourcesduring curtailed operations.The reduction in electrical energy demand resulted in a decreased real-time electricity cost of 82.7% frompreviously forecasted use. Fermilab uses a strategy to procure and secure electricity in megawatt blocks usingdollar cost averaging over a one to three-year period. Because of the drastic change to operations and earlyshutdown of the accelerator, the extra blocks could not be sold in advance. A vastly depressed regional energymarket in April and May resulted in Fermilab selling power blocks purchased at pre-pandemic rates on the spotmarket at a net loss.Participating in electrical power curtailment exercises that are encouraged by Fermilab’s regional transmissionorganization, PMJ, provide several benefits to the laboratory. In 2020, the laboratory participated in a summerenergy curtailment program as negotiated with the laboratory’s curtailment service provider. The demandreduction exercise yielded compensation of 180K as Fermilab met the target demand reduction goal of 2.9MW. In addition to the financial advantage, participating in demand curtailment programs provide advancedwarning to Fermilab in the event of electrical distribution disruptions from the electrical grid. This permitsdecisions to be made to protect equipment sensitive to electrical disruptions prior an occurrence. PJM hasdeveloped a new winter curtailment program that Fermilab will participate in for first time. The wintercurtailment exercise has the potential for an additional 20K in compensation if demand reduction goals aremet. Future participation in this program will be determined after evaluating the results of this winter’scurtailment.Plans and Projected PerformanceElectricity Use ProjectionsSignificant changes to Fermilab’s projected energy consumption are anticipated beginning 2024, when aplanned 2-year accelerator shutdown begins to bring the new PIP-II accelerator complex online. During the4
shutdown, Long Baseline Neutrino Facility infrastructure will tie into the existing accelerator complex. Theaddition of the PIP-II accelerator and beam requirements for LBNF are expected to increase Fermilab’s overallenergy consumption by 30% over historic peak levels.5
Scope 1 & 2 Greenhouse Gas ReductionPerformance StatusScope 1 & 2 greenhouse gas emissions are athistoric lows for reasons stated above andelsewhere in this plan. The primary reason forcurrent GHG reductions is attributable to lesselectrical power consumption at the laboratory.Electrical power needs are expected to increaseas upgraded accelerator facilities are broughtonline and beam power requirements forFermilab’s flagship experiment at LBNFcommence.Plans and Projected PerformanceElectrical load forecasts vary over the comingdecade as experimental apparatus is broughtonline and old apparatus is decommissioned.Beginning in FY2022, the new PIP-II linear accelerator is projected to add approximately 7 MW of electricalload. Additional load increases are anticipated in 2022 and 2024, and ultimately increasing by 47 % overFermilab’s current load maximum. The LBNF project is projected to initially add 7.8 MW of electrical load in2029 and increase to 8.3 MW in the following five years. These two large-scale projects combined willincrease Fermilab’s electrical load 62% over current levels. The laboratory anticipates using additionalrenewable energy certificates (RECs) to offset associated greenhouse gas emissions resulting from increasedelectric use.Scope 3 Greenhouse Gas ReductionPerformance StatusFermilab’s Scope 3 emissions are dominated byelectrical transmission and distribution (T&D)losses. Reduced electrical power consumptionequates to reduced T&D losses, and byassociation reduced GHG emissions. InFY2020, GHG emissions attributed to T&Dlosses were reduced by 52.9 % from 2019 levelsand 77.9 % from the 2008 baseline.Significant GHG emission reductions were alsoapparent related to employee commuting andbusiness travel, resulting primarily from thelaboratory’s response to the pandemic. In 2020expanded telecommuting became the norm fornearly all Fermilab employees. Business travelwas similarly reduced producing historically lowGHG emissions. See the Travel & Commutesection for additional information.6
Plans and Projected PerformanceFermilab has initiated a large pilot program to assess thepossibility of expanding telework opportunities acrossmost sectors of the laboratory. This long-term pilot isaimed at identifying options for transitioning to a moreflexible work environment for employees andresearchers. Similarly, a shift has occurred in howFermilab staff and researchers interact with peers andcolleagues from other institutions. The dramatic shifttowards using platforms such as Zoom, Google Meet andWebex for group meetings has fundamentally altered ourperception of the need to travel for business purposes.This presents an opportunity to further explore theseoptions post-pandemic, as both a means to reduce GHGemissions and business-related expense.Energy Intensity ReductionPerformance StatusIn FY2020, Fermilab had no non-excluded facilities greater than 5,000 gsf with an energy use index (EUI)greater than 150 kBtu/gsf.Plans and Projected PerformanceFermilab will continue to work towards reducing the energy intensity of goal-subject buildings.EISA EvaluationsPerformance StatusIn the final year of the four-year Energy Independence and Security Act (EISA) Section 432 schedule, Fermilabhas completed energy evaluations on 100 % of goal subject building consuming 87% of total energy use.(3,523,502 gsf complete) Additionally, during the summer of FY2020, a Fermi GEM fellowship graduatestudent studying mechanical engineering performed an energy audit of the MC-1 facility. The energy auditreport documented the energy profile of the facility and was well received.Plans and Projected PerformanceFermilab will continue to perform energy and water evaluations of goal-subject facilities, completingevaluations of all facilities every four years. In FY2021FY2021, Fermilab plans to retro-commission 2buildings, the D-0 Assembly Building and the Office, Technical and Education building. Additionally, thelaboratory plans, energy audits in the following 5 buildings, Warehouse 1, Warehouse 2, HAB, Meson DetectorBuilding, and MI-60.MeteringPerformance StatusFermilab’s new buildings utilize the most current smart meters designed to monitor, track, and assess facilityperformance and energy consumption. Existing facilities are variably metered either at the building level or atthe branch level, giving facilities management staff the ability to monitor energy consumption and identify andmitigate energy consumption issues.7
The industrial cooling water (ICW) utility is comprehensively metered enabling the laboratory to manage ICWto sustain programmatic needs. Electric, natural gas, and domestic water meters are deployed less frequently onexisting buildings, but issues are identified as they arise, and consumption is monitored by using branchmetering.A project to replace aged natural gas meters began in FY 2019 with the installation of new smart meters at theCentral Utilities Building and Warehouse 1. The project to install 26 replacement natural gas meters wascompleted in FY2020 and the final power and network connections will be completed in FY2021FY2021. TheFY2021FY2021 plan is to install 7 additional natural gas meters at new locations, which will complete therecommended metering for all-natural gas users on the site.Plans and Projected PerformanceFermilab is planning to replace 28 aging & failing electric meters. The goal is to complete the installation ofthese new meters in FY2021FY2021.One of Fermilab’s PEMP goals for FY2021FY2021 is to assess options for a sitewide Energy ManagementInformation System (EMIS). Fermilab will determine the optimal tool that is compatible with the currentsupervisory control and data acquisition (SCADA), metering & Building Automation (BAS) infrastructureswhile minimizing costs.As part of Fermilab’s campus modernization efforts, aging and failing utility meters will be replaced with smartmeters. In FY2020, the laboratory’s metering infrastructure was evaluated as part of a Strategic UtilitiesAssessment. As a result, Fermilab will be able to better plan for metering needs and funding. Fermilab will alsoconduct an evaluation of meters that will properly interface with the laboratory’s supervisory control and dataacquisition (SCADA) system. Previously Fermilab counted facilities metered by group feeder lines as‘individually metered.’ Current data reflects only those metered at the unique facility location. The laboratory’songoing metering plan to is implement meters at individual existing buildings as resources allow.8
Water ManagementWater Use and Management - PotablePerformance StatusPotable water use at Fermilab remainedelevated in FY2020. Water useintensity showed a 16.4% increaseagainst the 2007 baseline. To trackwater use, Fermilab uses a continuousdomestic water monitoring system toidentify consumption anomalies andexcursions. Increased water intensityremained elevated due primarily toseveral significant below ground leaksthat were detected in Fermilab’s agedwater distribution infrastructure. Thelargest of these leaks persisted for sixweeks and eluded discovery before itwas found and repaired. It’s estimatedthat 5.4 million gallons of water was lost due to the rupture. The leaks were large enough to overwhelm anyreduction in overall use due to reduced staffing related to the pandemic.The table below shows the top five facilities water use comparison between 2019 and 2020. Overall water usedecreased in these facilities due primarily to reduced occupancy as site activity was curtailed due to thepandemic.FacilityWilson HallFY 2019KgalFY2020KgalWater Used DifferenceKgal37193199-520MC -1564558-6MC-2 / Mu2e136378242CMTF201195-6HAB8047-33Total ReductionFacility water use comparison-323Plans and Projected PerformanceFermilab’s five-year average potable water use is 35 million gallons per year. No significant increase inoperational demand to potable water is anticipated for the next five years.Fermilab anticipates the establishment of a large capital improvements Utilities Infrastructure Project (UIP).This project will include significant investment in potable water infrastructure upgrades that should9
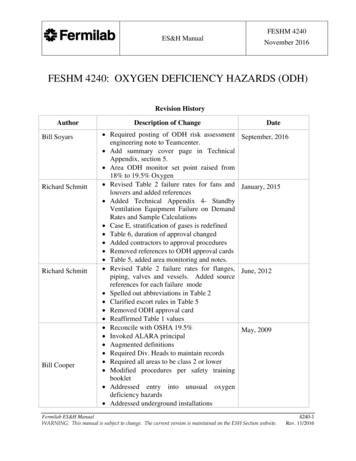
significantly reduce the frequency and volumes lost due to leaks. While funding has not been finalized, theintent is to replace a significant portion of the potable water system identified as inadequate or substandard.Water Use and Management - Industrial, Landscape and AgriculturePerformance StatusVirtually all ILA water used at Fermilabis contained in a semi closed loopsurface and piped Industrial CoolingWater system (ICW). The system’sprimary purpose is to provideevaporative cooling for the acceleratorcomplex and support equipment. Wateris obtained principally fromprecipitation that falls on site which iscaptured and retained in aninterconnected network of ponds, lakesand ditches. Precipitation is consideredan alternative water source and therefore is not subject to efficiency goals.The ICW system is further supplemented by watercollected from three sources: Groundwater collected from the bedrockformation that surrounds the 4,000-foot-long NuMIunderground facility. Water pumped from the Fox River located 3miles to the west and piped to the laboratory. Water pumped from a deep well on-site.Part of the NuMI underground facility from which water is captured anddirected to Fermilab’s ICW system.These supplemental sources are used to make upfor water losses to the ICW system that occur fromnormal operations or during times of insufficientprecipitation. Water in excess of the system’scapacity is discharged off site by way of threecreeks that intersect the site.In FY2020, volumes from these three sources were as follows:SourceTotal M galGroundwater from MINOSFox River44.122.9Deep aquafer well30.1Total Withdrawals FY202097.1Total Withdrawals FY 2010Difference81.315.810
ILA water usage for Fermilab in the DOE Sustainability Dashboard is calculated as the sum of the supplementalsources. Volume totals for 2020 represent an increase of 15.8 M gallons against the 2010 baseline year. Theincrease is attributable to greater withdrawals from both the Fox River and the deep well. The Fox Riverpumping station was used 53 days compared to zero run days in 2019. The deep well was run for a total of 34day compared to 6 days in 2019. The increase in ILA water demand was partially due to work related to civilconstruction site preparation work associated with the Long Baseline Neutrino Facility project. As part of theproject, a large cooling pond was drained and refilled using make up ICW water.Fermilab has adopted a site-wide strategy of natural landscaping and native grassland management that requiresa minimum amount of landscape watering. Minor amounts of non-potable ICW are used during times ofdrought to water ornamental trees. There is no use of potable or non-potable water for routine landscaping orthe irrigation of crops at Fermilab.Plans and Projected PerformanceVirtually all ILA water at Fermilab is used to support the operation of High Energy Mission Specific Facilities(HEMSFs). Precipitationthat falls on site dominatesthe water available forcooling use and as such isnot subject to reductiongoals. Fermilab activelyseeks opportunities toincrease the efficiency ofthe system. Overall watermanagement on site isaccomplished via ourSurface WaterManagement Plan(SWaMP). The planaddresses both coolingwater needs and othersurface waters on site that Fermilab’s Surface Water Management Plan homepageare not part of operations.Additionally, anticipated future demands are factored into large projects such as the Proton Improvement PlanII project and the Long Baseline Neutrino Facility project.11
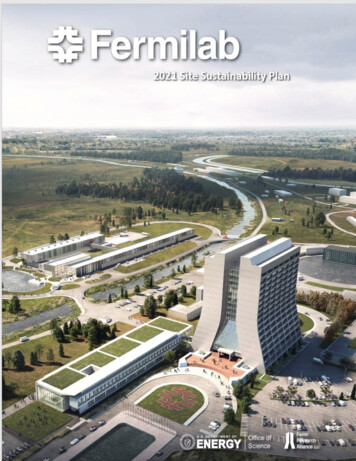
Waste ManagementMunicipal Solid WastePerformance StatusFermilab operates an establishedcomingled recycling program thatincludes the recovery of paper, glass,plastic and metal containers. Thelaboratory also recycles when possiblevarious non-conventional items such aspolystyrene packaging and disposablebatteries. Additionally, a scrap metalprogram is used to divert significantvolumes of salvaged metals generated aspart of normal operations. In FY2020Fermilab diverted 151 metric tons (44%)of the municipal waste generated on site.The diversion rate declined from previousyears. It is believed that this was causedin part due to an increased volume ofsingle-use, consumable items disposed ofin association with managing the effects of the pandemic. Support staff to manage waste, including janitorialstaff, were also less focused on recycling as stepped-up sanitation efforts became the priority. The total volumeof waste diverted was comparatively reduced by 40% due to low occupancy of the site beginning in March,when employee access restrictions were put into place. Smaller amounts of waste diverted towards composting(1.8 tons) and recycled cooking oils (1.25 tons) also occurred.Several more non-conventional recycling andrepurposing programs were impacted to a lessereffect. These include a long-established agreementwith local municipalities whereby neighboring citiesare permitted to transport residential leaf litter theycollect to Fermilab to be used as a soil amendment forlands used for row-crop agriculture on site. Themunicipalities brought to Fermilab approximately7,500 cubic yards of leaves last year. Additionally,as part of grounds maintenance activities, thelaboratory repurposed approximately 1,000 cubicyards of wood chips to be used as natural landscapingmaterial around buildings and structures.Leaves collected by the City of Batavia and transported toFermilab for incorporation as a soil amendment.12
Plans and Projected PerformanceIt is anticipated that waste volumes and associated diversion rates will remain low through most if not all ofFY2021FY2021 due to the pandemic. Once laboratory operations return to normal, the overall impact of anincreased number of employees that may choose to work remotely, or by varied on-site work schedules will bereviewed to determine the operational impact, including any adjustments that may be needed for wastemanagement strategies.Construction & Demolition Waste DiversionPerformance StatusFermilab diverted 163.04metric tons (53%) ofC&D waste in FY2020.There are currently threelarge constructionprojects occurring on siteand each is recyclingwaste material. Activityon these projects wascurtailed in spring due tothe pandemic, howeverwork has resumed for the most part for all three. Additionally, Fermilab has staged C&D recycling dumpstersat strategic locations around the site and these are used for small-scale projects. Overall, the total amount ofC&D materials recycled was reduced by approximately 35% over previous years.Plans and Projected PerformanceFermilab continues to advance best practices for the management of construction and demolition debris. Thelaboratory maintains a clear set of contract specifications and related requirements for all new constructionprojects that require C&D waste generated to be diverted when possible. A waste management trackingdatabase for projects was expected to be online for FY 2120 however, due to disruptions from the pandemic thishas been delayed. Once complete, data collection and management should be simplified and standardized.As part of Fermilab’s Master Campus Plan, various facilities are slated for removal, consolidation orreplacement over the next decade. Wastegenerated with this work will adhere toFermilab’s recycling practices for demolitionwaste. Waste generated from the large-scale,
Fermilab's 6,800-acre site and extensive infrastructure supports the laboratory's particle physics research program, including the experiments at the Fermilab Accelerator Complex user facility and others located around the world. The laboratory's infrastructure is being primed for significant change to support the requirements of