Transcription
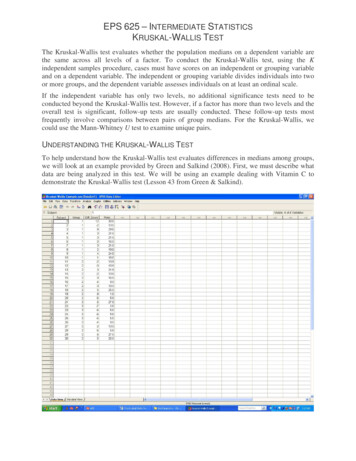
EPS 625 – INTERMEDIATE STATISTICSKRUSKAL-WALLIS TESTThe Kruskal-Wallis test evaluates whether the population medians on a dependent variable arethe same across all levels of a factor. To conduct the Kruskal-Wallis test, using the Kindependent samples procedure, cases must have scores on an independent or grouping variableand on a dependent variable. The independent or grouping variable divides individuals into twoor more groups, and the dependent variable assesses individuals on at least an ordinal scale.If the independent variable has only two levels, no additional significance tests need to beconducted beyond the Kruskal-Wallis test. However, if a factor has more than two levels and theoverall test is significant, follow-up tests are usually conducted. These follow-up tests mostfrequently involve comparisons between pairs of group medians. For the Kruskal-Wallis, wecould use the Mann-Whitney U test to examine unique pairs.UNDERSTANDING THE KRUSKAL-WALLIS TESTTo help understand how the Kruskal-Wallis test evaluates differences in medians among groups,we will look at an example provided by Green and Salkind (2008). First, we must describe whatdata are being analyzed in this test. We will be using an example dealing with Vitamin C todemonstrate the Kruskal-Wallis test (Lesson 43 from Green & Salkind).
The data set includes scores on the dependent variable (difference in number of colds from oneyear to the next) and their rank order, disregarding levels of the factor (Vitamin C group), fromlowest to highest for the Kruskal-Wallis test. With the Kruskal-Wallis test, a chi-square statisticis used to evaluate differences in mean ranks to assess the null hypothesis that the medians areequal across the groups.ASSUMPTIONS UNDERLYING A MANN-WHITNEY U TESTBecause the analysis for the Kruskal-Wallis test is conducted on ranked scores, the populationdistributions for the test variable (the scores that the ranks are based on) do not have to be of anyparticular form (e.g., normal). However, these distributions should be continuous and haveidentical form.Assumption 1: The continuous distributions for the test variable are exactly the same (excepttheir medians) for the different populations.Assumption 2: The cases represent random samples from the populations, and the scores on thetest variable are independent of each other.Assumption 3: The chi-square statistic for the Kruskal-Wallis test is only approximate andbecomes more accurate with larger sample sizes.The p value for the chi-square approximation test is fairly accurate if the number of casesis greater than or equal to 30.EFFECT SIZE STATISTICS FOR THE MANN-WHITNEY U TESTSPSS does not report an effect size index for the Kruskal-Wallis test. However, simple indicescan be computed to communicate the size of the effect.For the Kruskal-Wallis test, the median and the mean rank for each of the groups can bereported. Another possibility for the Kruskal-Wallis test is to compute an index that is usuallyassociated with a one-way ANOVA, such as eta square (η2), except η2 in this case would becomputed on the ranked data. To do so, transform the scores to ranks, conduct an ANOVA, andcompute an eta square on the ranked scores. Eta square can also be computed directly from thereported chi-square value for the Kruskal-Wallis test with the use of the following equation:η2 χ2N 1Where N is the total number of casesTHE DATA SETThe data set that we will look at for this example is from Lesson 43 from Green and Salkind’s(2008) Using SPSS for Windows and Macintosh: Analyzing and Understanding Data (5th ed.).The data set represents data from an example looking at Vitamin C.KRUSKAL-WALLIS TESTPAGE 2
The grouping variable (GROUP) has three levels: 1 Placebo, 2 Low Doses of Vitamin C,and 3 High Doses of Vitamin C. The test variable (DIFF SCORE) is the number of days inyear 2 with cold symptoms minus the number of days in year 1 with cold symptoms.THE RESEARCH QUESTIONSThe research questions used in this example can be asked to reflect differences in mediansbetween groups or a relationship between two variables.1. Differences between the medians: Do the medians for change in the number of days ofcold symptoms differ among those who take a placebo, those who take low doses ofvitamin C, and those who take high doses of vitamin C?2. Relationship between two variables: Is there a relationship between the amount ofvitamin C taken and the change in the number of days that individuals show coldsymptoms?CONDUCTING THE K INDEPENDENT-SAMPLES (KRUSKAL-WALLIS) TEST IN SPSSTo conduct the Kruskal-Walls test and follow-up tests using the Mann-Whitney U test in SPSS,use the following steps: Open the dataset in SPSS to be used for the Kruskal-Wallis Test analysis Click Analyze, click (mouse over) Nonparametric Tests, and then click KIndependent-Sampleso You should now be in the Test for Several Independent Samples dialog boxClick on your (Test Variable), and clickboxto move it to the Test Variable List:Click on your (Grouping Variable), and clickVariable: boxto move it to the GroupingClick Define Range Type 1 as the Minimum value for Group Type 3 (for this example) as the Maximum value for Groupo The maximum value will be based on the specific scenario. For example,with four levels, you would type 4 for the maximum value. Click ContinueClick Options Under Statisticso Select [ ] Descriptive Click ContinueBe sure Kruskal-Wallis H is checked in the Test Type area.KRUSKAL-WALLIS TESTPAGE 3
Click OK You are now ready to analyze the output data SPSS OUTPUTNPar TestsDescriptive StatisticsDiff ScoreVitamin C TreatmentN3030Mean-.202.00Std. Deviation5.182.830NMean lis TestRanksDiff ScoreVitamin C TreatmentPlaceboLow DoseHigh DoseTotal10101030Test Statisticsa,bChi-SquaredfAsymp. Sig.Diff Score6.9232.031a. Kruskal Wallis Testb. Grouping Variable: Vitamin C TreatmentThe results of the analysis indicates that there is a significant difference in the medians, χ2(2, N 30) 6.92, p .03. Because the overall test is significant, pairwise comparisons among the threegroups should be completed.CONDUCTING PAIRWISE COMPARISONS AFTER OBTAINING A SIGNIFICANTKRUSKAL-WALLIS TEST IN SPSSThe pariwise comparisons will be conducted using the Mann-Whitney U test, which yieldsidentical results with the Kruskal-Wallis test for two independent samples. For each pairwisecomparison, the values in the Define Groups dialog box will be changed to match thecomparison of interest (e.g., 1 vs. 2, 1 vs. 3, etc.). Don’t forget to protect for Type I Error, byadjusting the a priori alpha level divided by the number of comparisons (Bonferroni adjustment).KRUSKAL-WALLIS TESTPAGE 4
To conduct the Mann-Whitney U test in SPSS, use the following steps: Click Analyze, click (mouse over) Nonparametric Tests, and then click 2Independent-Sampleso You should now be in the Two-Independent Samples Tests dialog boxClick on your (Test Variable), and clickboxto move it to the Test Variable List:Click on your (Grouping Variable), and clickVariable: boxto move it to the GroupingClick Define Groups Type 1 in the Group 1 box to indicate that Group 1 is the first level of yourgrouping variable. Type 2 in the Group 2 box indicating that Group 2 is the second level of yourgrouping variable. Click ContinueClick Options Under Statisticso Select [ ] Descriptive Click ContinueBe sure Mann-Whitney U is checked in the Test Type area.Click OK You are now ready to analyze the output data To perform the subsequent comparisons, repeat the above steps, except indicate in the DefineGroups dialog box the groups of interest. For this example, use Groups 1 and 3 for the secondcomparison and Groups 2 and 3 for the third comparison.SPSS OUTPUTComparing Group 1 (Placebo) to Group 2 (Low Dose)NPar TestsDescriptive StatisticsDiff ScoreVitamin C TreatmentN3030Mean-.202.00Std. Deviation5.182.830KRUSKAL-WALLIS TESTPAGE 5Minimum-91Maximum123
Mann-Whitney TestRanksDiff ScoreVitamin C TreatmentPlaceboLow DoseTotalN101020Mean Rank13.907.10Sum of Ranks139.0071.00Test StatisticsbDiff Score16.00071.000-2.586.010.009aMann-Whitney UWilcoxon WZAsymp. Sig. (2-tailed)Exact Sig. [2*(1-tailed Sig.)]a. Not corrected for ties.b. Grouping Variable: Vitamin C TreatmentComparing Group 1 (Placebo) to Group 3 (High Dose)NPar TestsDescriptive StatisticsDiff ScoreVitamin C TreatmentN3030Mean-.202.00Std. Deviation5.182.830Minimum-91Mean Rank13.057.95Sum of Ranks130.5079.50Mann-Whitney TestRanksDiff ScoreVitamin C TreatmentPlaceboHigh DoseTotalN101020KRUSKAL-WALLIS TESTPAGE 6Maximum123
Test StatisticsbDiff Score24.50079.500-1.939.052.052aMann-Whitney UWilcoxon WZAsymp. Sig. (2-tailed)Exact Sig. [2*(1-tailed Sig.)]a. Not corrected for ties.b. Grouping Variable: Vitamin C TreatmentComparing Group 2 (Low Dose) to Group 3 (High Dose)NPar TestsDescriptive StatisticsDiff ScoreVitamin C TreatmentN3030Mean-.202.00Std. Deviation5.182.830Minimum-91Mean Rank11.0010.00Sum of Ranks110.00100.00Mann-Whitney TestRanksDiff ScoreVitamin C TreatmentLow DoseHigh DoseTotalN101020Test StatisticsbMann-Whitney UWilcoxon WZAsymp. Sig. (2-tailed)Exact Sig. [2*(1-tailed Sig.)]Diff Score45.000100.000-.382.702.739aa. Not corrected for ties.b. Grouping Variable: Vitamin C TreatmentKRUSKAL-WALLIS TESTPAGE 7Maximum123
APA RESULTSBased on the results produced from the above example, the APA results would be:A Kruskal-Wallis test was conducted to evaluate differences among the three vitamin Cconditions (Placebo, Low Dose of Vitamin C, and High Dose of Vitamin C) on median change innumber of days with cold symptoms (number of days with colds during treatment minus numberof days with colds prior to treatment). The test, which was corrected for tied ranks, wassignificant χ2(2, N 30) 6.92, p .03. The proportion of variability in the ranked dependentvariable accounted for by the vitamin C treatment variable was .24, indicating a fairly strongrelationship between vitamin C treatment and the change in the number of days with colds.Follow-up tests were conducted to evaluate pairwise differences among the three groups,controlling for Type I error across tests by using the Bonferroni approach. The results of thesetests indicated a significant difference between the placebo group and the low-dose vitamin Cgroup. The typical decrease in number of days with cold symptoms after treatment was greaterfor the low-dose vitamin C treatment group than for the placebo group.*The following Case Summaries Table may be needed to better understand the above results Case SummariesDiff ScoreVitamin C TreatmentPlaceboLow DoseHigh reen, S. B., & Salkind, N. J. (2008). Using SPSS for Window and Macintosh: Analyzing andunderstanding data (5th ed.). Upper Saddle River, NJ: Pearson Prentice Hall.KRUSKAL-WALLIS TESTPAGE 8
KRUSKAL-WALLIS TEST PAGE 5 To conduct the Mann-Whitney U test in SPSS, use the following steps: Click Analyze, click (mouse over) Nonparametric Tests, and then click 2 Independent-Samples o You should now be in the Two-Independent Samples Tests dialog box Click on your (Test Variable), and click to move it to the Test Variable List: boxFile Size: 246KBPage Count: 8