Transcription
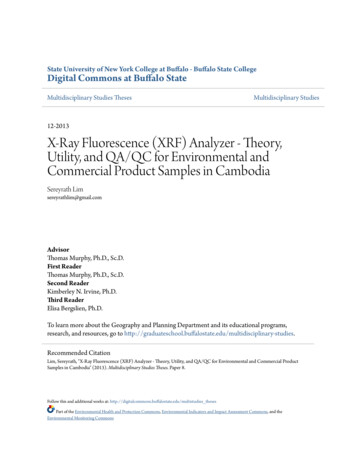
State University of New York College at Buffalo - Buffalo State CollegeDigital Commons at Buffalo StateMultidisciplinary Studies ThesesMultidisciplinary Studies12-2013X-Ray Fluorescence (XRF) Analyzer - Theory,Utility, and QA/QC for Environmental andCommercial Product Samples in CambodiaSereyrath Limsereyrathlim@gmail.comAdvisorThomas Murphy, Ph.D., Sc.D.First ReaderThomas Murphy, Ph.D., Sc.D.Second ReaderKimberley N. Irvine, Ph.D.Third ReaderElisa Bergslien, Ph.D.To learn more about the Geography and Planning Department and its educational programs,research, and resources, go to linary-studies.Recommended CitationLim, Sereyrath, "X-Ray Fluorescence (XRF) Analyzer - Theory, Utility, and QA/QC for Environmental and Commercial ProductSamples in Cambodia" (2013). Multidisciplinary Studies Theses. Paper 8.Follow this and additional works at: s thesesPart of the Environmental Health and Protection Commons, Environmental Indicators and Impact Assessment Commons, and theEnvironmental Monitoring Commons
X-Ray Fluorescence (XRF) Analyzer – Theory, Utility, and QA/QC for Environmental andCommercial Product Samples in CambodiabySereyrath LimAn Abstract of a ThesisinMultidisciplinary StudiesSubmitted in Partial Fulfillmentof the Requirementfor the Degree ofMaster of ArtsDecember 2013Buffalo StateState University of New York
ABSTRACT OF THESISX-Ray Fluorescence (XRF) Analyzer – Theory, Utility, and QA/QC for Environmental andCommercial Product Samples in CambodiaLaboratory facilities in developed countries provide a variety of options for analysis ofenvironmental samples and commercial commodities that could impact human health. The sameis not true in developing countries and there is a great need to identify technologies that could beused to provide robust, accurate, cost-effective analysis that minimizes the need for extensivetechnical training. An X-ray Fluorescence (XRF) analyzer seems to be an analytical techniquethat could be such a tool for developing countries. Therefore, the objective of this thesis was toassess the performance and utility of a handheld, portable XRF unit in analyzing different typesof environmental and commercial commodity samples in Cambodia. Because a number ofdifferent materials were analyzed, this thesis has a slightly different format than typical. Each ofthe following three chapters has its own methodology, results and discussion sections. Thisapproach was taken because the materials analyzed and methods for sampling the materials wereso different, it was clearer to separate the analyses into separate, individual chapters. Thisabstract provides a brief overview of each chapter.1. Chapter OneThe need to have a more robust, cost effective and less time-consuming form forenvironmental samples in the field where samples could not be brought in for the laboratoryanalysis led to the manufacture of a first X-ray fluorescence (XRF) analyzer. This first chapteroutlines the theory of the XRF, its advantages and limitations, and provides some QA/QC of a
handheld XRF (XL3t 900, Billerica, MA) on skin whiteners, which were purchased and donatedby university students for mercury levels.The results showed that up to 98 samples (16%) of creams analyzed contained mercuryhigher than 20 ppm, and 64 concoctions out of 192 samples were contaminated with more than20 ppm mercury. Although there were suppressions (20%) of mercury at concentrations near15,000 ppm (i.e. an under-estimation), the XRF proved to be an excellent tool capable ofdetecting metals; particularly mercury in semi-solid solutions.2. Chapter TwoPhnom Penh, the capital city of Cambodia, is home to some 1.4 million people andundergoing urbanization. In spite of its urbanization, Phnom Penh has yet to have a primarywastewater treatment plant and adequate sewage drainage system in place. There are two maininterceptor sewer channels that drain wastewater and storm water from the southern part of thecity into a natural wetland, Boeung Cheung Ek. These two sewer channels are the Tum PunSewer System and the Meanchey Sewer System. These are open sewer systems which collect alltypes of industrial, hospital, institutional and household wastes, and in turn discharge into thewetland. In Cambodia data related to metals contamination in sediment and street dust are verylimited. So, this chapter of the thesis seeks to determine metal concentrations, spatial patternsand sources in sewer, wetland and street dust samples. Metals levels also are compared withUnited States Environmental Protection Agency (USEPA), New York State Department ofEnvironmental Conservation (NYSDEC), and Provincial Sediment Quality (PSQ), Ontario,Canada guidelines.
The results showed that although there are elevated metal concentrations in the sewer andwetland sediments and street dust samples, they are still lower than those reported elsewheresuch as in Hong Kong, Greece, China, Korea, the US, and Malaysia. One sewer site (M1) hadsignificantly higher metals levels than any other site of the two sewer systems, because it isgeographically surrounded by industries and factories. The metal concentrations, especially Pb,Zn, and Cu, decreased with distance from this site. The levels of Pb in street dust appearedhigher in high-density traffic areas and decreased with distance from the busy traffic streets.Although leaded gasoline can be a source of lead in street dust and sediments, Cambodiaapparently complies with the EU guideline on the level of lead use in gasoline. In addition toleaded gasoline, diesel fuel can also contain metals but the levels are subject to further analysis.Other sources of metals in street dust include tire abrasion, brake lining and transmission oil. Toreduce the levels of metals, the two sewer systems should be dredged periodically. The dredgingalso would increase channel flow capacity during storm events. Source tracking of metals shouldbe conducted in more detail to inform management strategies. For the management of street dust,street sweeping and washing may be effective means to allay the metal toxicity levels.3. Chapter ThreeLead (Pb), which is a potentially hazardous toxicant, can be an additive agent of jewelryitems and children’s toys. It is added to polyvinylchloride (PVC) pipes, so that it would providerigidity, lower manufacturing costs and resistance to sunlight. Lead also has been a paint additiveand this is of great concern in North America. Cambodia imports most of its consumer goodsfrom other countries, but the regulatory inspection on imported products is not strictly enforceddue to the lack of customs inspection tools, facilities and trained professionals. The purpose of
this chapter is to assess jewelry items, children’s toys and paints for potential metalcontamination from various markets in Phnom Penh, Cambodia and Bangkok, Thailand bymeans of the handheld X-ray fluorescence (XRF) analyzer.The results indicated that significant levels of Pb were used in the products (up to 43% injewelry items and 4.3% in paints). These findings suggested that more restrictive regulations onthe sales and use of toxic products should be imposed, so that health risks can be minimized.The XRF was manufactured, and over the years, has been re-engineered to provide thefeatures necessary to operate in the field where laboratory-based assays not are suited. The XRFhas some limitations for some elements like Cr and Hg in soils, the analyses of which necessitatelaboratory-based verification such as an AAS or ICP. It also does not have the capacity to assessthe degree of dermal and oral absorption of metals, although these aspects are still evolving.Nonetheless, the XRF would be an ideal tool for on-site and in situ investigation in Cambodia;particularly for customs officers, environmental researchers and engineers.
State University of New YorkCollege at BuffaloX-Ray Fluorescence (XRF) Analyzer – Theory, Utility, and QA/QC for Environmental andCommercial Product Samples in CambodiaA Thesis in Multidisciplinary StudiesbySereyrath LimSubmitted in Partial Fulfillmentof the Requirementsfor the Degree ofMaster of ArtsDecember 2013Approved By:Thomas Murphy, Ph.D., Sc.DAdjunct Professor of Geography and PlanningChairperson of the Committee/Thesis AdviserKevin J. Railey, Ph.D.Associate Provost and Dean of the Graduate School
THESIS COMMITTEEThomas Murphy, Ph.D., Sc.D.Adjunct Professor of Geography and PlanningChairperson of Thesis Committee/Thesis AdviserKimberley N. Irvine, Ph.D.Professor of Geography and PlanningElisa Bergslien, Ph.D.Associate Professor of Earth Sciences
Chapter 1: X-Ray Fluorescence (XRF) – Theory,Utility, and QA/QC for Commercial Product Samplesin CambodiaTABLE OF CONTENTS1. INTRODUCTION . 11.1 Background . 11.2 Chapter Objectives . 21.3 Theory of the XRF . 21.3.1 Selectivity . 41.4 XRF Sources . 61.4.1 Radioisotope Sources . 61.4.2 X-Ray Tube Source. 61.5 Factors Affecting XRF Calibration . 81.6 Interferences . 91.7 Detection Limit . 112. LITERATURE REVIEW . 142.1 Analysis of Sediments. 142.2 Analysis of Street Dust . 152.3 Analysis of Jewelry Items and Children’s Toys . 162.4 Analysis of Lead in Paints . 172.5 Analysis on Skin Whiteners . 193. METHODOLOGY . 213.1 Instrumentation . 213.2 Reducing Radiation Exposure. 233.2.1. Monitoring Radiation Exposure. 243.3 Mercury Contamination in Skin Whiteners . 254. RESULTS . 264.1 Illustration of QA/QC – Skin Whitening Creams . 264.2 Analysis of Skin Whiteners . 32i
5. DISCUSSION . 355.1 Mercury in Skin Whiteners . 356. CONCLUSION . 367. REFERENCES . 37ii
LIST OF FIGURESFigure 1. The process of x-ray fluorescence. . 3Figure 2. Mechanism of X-ray fluorescence of an atom . 4Figure 3. Comparison of elemental spectra . 5Figure 4. Laboratory-based MDXRF analyzer . 7Figure 5. Handheld Thermo Scientific Niton XL3t XRF analyzer . 8Figure 6. Components of a handheld XRF analyzer . 22Figure 7. A desktop stance of an XLi XRF analyzer . 24Figure 8. Comparison between XRF XL3t and ICP-OES Hg analysis . 27Figure 9. XRF measurement of high range spike Hg . 30Figure 10. XRF measurement of low-range spiked Hg . 31iii
LIST OF TABLESTable 1. Definition of USEPA validation quality criteria. 28Table 2. XRF measurement of spiked Hg with dimethylsulfoxide (DMSO) . 28Table 3. XRF replicability measurement of Hg in market skin-whitening creams . 32Table 4. XRF measurement of Hg level from the Educational Clinics . 34iv
1. INTRODUCTION1.1 BackgroundThe world’s growing environmental and public health concerns have promptedresearchers and professionals to seek alternative forms of analytical tools, which are more robust,portable, cost effective and easy to operate with minimal sample preparation. The conventionalmethods for metals analysis such as the atomic absorption spectrometry (AAS), inductivelycoupled plasma atomic emission spectroscopy (ICP-AES), and inductively coupled plasmasoptical emission spectrometry (ICP-OES) through sequential digestion, often require lengthysample preparation time, and take a number of days to obtain results. In some instances,validated data are needed to reflect on-site decision making and the number of samples to beanalyzed. The X-ray fluorescence analyzer is a well suited alternative for a variety of analyticalapplications.X-ray fluorescence spectrometry (XRF) is an analytical screening tool that was first usedto analyze lead (Pb) in paint in the 1970s during abatement and exposure studies (Kalnicky andSinghvi 2001), and has since been used in environmental testing of alloys, geological materials,sediments, glasses, with very minimal sample preparation and treatment (Sitko 2009; Lawryk etal. 2009). Over the years, the XRF has gained acceptance from the environmental researchcommunity as a viable analytical tool because of the efficiency of the radioisotope sourceexcitation coupled with extremely sensitive detectors and other electronics, hence offering multielement analysis capability, economy, high speed and simplistic operation, where its advantagesand limitations are well comprehended.1
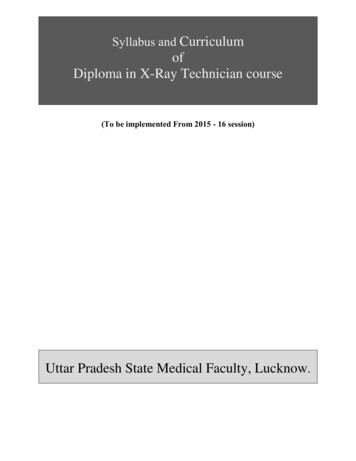
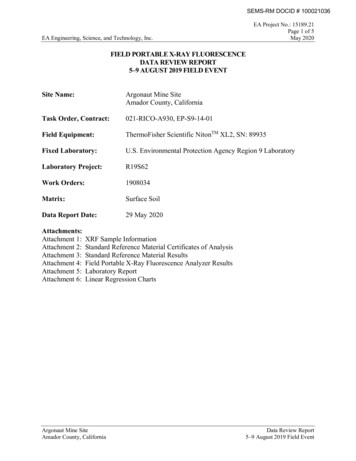
1.2 Chapter ObjectivesThe objectives of this study are to provide the basic concepts of the XRF and assess theperformance of a handheld XRF, Niton XL3t 900 Series (Thermo Fisher Scientific, Waltham,MA), on various consumer products in Cambodia.1.3 Theory of the XRFThe basics of the XRF lie in the atoms of the receiving sample emitting different energieswhen they are excited by X-rays. The excited photons enable the qualitative and quantitativeanalysis of most elements in a given sample (Kalnicky and Singhvi 2001). First the X-raysdislodge an atom from the inner shell. The atom from an outer shell fills the inner shell (K or L).The excited atom releases energy in the X-ray region of the wavelength as it returns to theground state. The released photons with energy are equivalent to the difference between the twodifferent shells. For instance, the transition from the L-shell to the K-shell results in a spectralline, which is designated K , while the transition from the M-shell to the K-shell provides aspectral line, which is designated Kβ (Figure 2). Thus, each element possesses differentcharacteristic lines in the spectrum because each type of orbital transition produces a distinct Xray. Clark et al. (1999) showed that when certain atoms are excited, they release energy in theform of fluorescence as they return to the unexcited state. The photons emitted are then detectedby the instrument. Figure 1 provides an overview of the basics in theory of the XRF.2
Mechanism of XRFFigure 1. The three step process describing x-ray fluorescence.Source: USEPA Method 6200 and Field Portable X-ray Fluorescence Manual: 2007, Figure 2, p.3.3
Transitional Steps of AtomsFigure 2. Mechanism of X-ray fluorescence of an atom.1.3.1 SelectivityThe XRF can be used to detect most of the elements in the periodic table ranging fromNa to U and even higher atomic number (Z) elements, although the detection of low Z elementsrequires the use of a vacuum or helium purge gas (Palmer et al. 2009). Modern field portableXRF instruments, however, have improved solid state detectors with sufficient energy resolutionfor multi-element analysis with few spectral interference problems, and they do not require liquidnitrogen cooling. Many models have been developed and marketed for specific applications such4
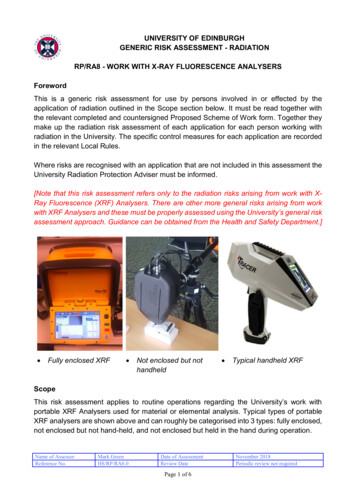
as the analysis of Pb in paint (Dost 1996). Under normal circumstances, a positive detection of asample is confirmed by multiple fluorescence lines with different energy that can be expanded toshow limited resolution of the analyzer (Figure 3). However, the interpretation of the XRFspectra containing multiple fluorescence line overlaps can be very complicated due to thefundamental limitations of the detector in distinguishing photons with similar energies.XRF Spectral LinesFigure 3. Comparison of three pure element spectra and a spectrum taken from a brass sample.5
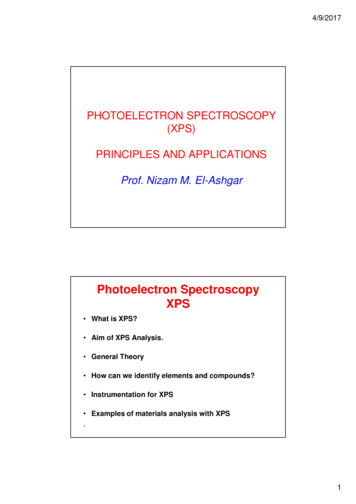
1.4 XRF Sources1.4.1 Radioisotope SourcesA variety of excitation sources may be used to irradiate a sample. Various radioisotopesources such as Fe-55, Co-57, Cd-109, and Am-241 have been used, giving off radiation at aspecific energy level. Because no single excitation source can efficiently excite the entire rangeof elements with different atomic numbers, two or three excitation sources can be used tomaximize the efficiency of the XRF detection on a wide range of concerned elements (Bertin1975)The analyzer emits primary radiation through which the sample being analyzeddetermines the intensity of the secondary (scattered) radiation. Based on its composition,thickness and density, the sample may absorb more or less of the primary-beam radiation. If thesample is small, thin, and low in density, it would allow much more of the radiation beam toescape, and the escaping radiation is known as the secondary (scattered) radiation (ThermoFisher Scientific 2010). There should always be a sample in contact with the measurementwindow when the x-ray tube is on. Individuals should never place any part of the body in theprimary beam path as this may potentially lead to cancer. Therefore, caution should be takenwhen analyzing samples that are small and low in density.1.4.2 X-Ray Tube SourceHigh-power X-ray tubes are another alternative source of the XRF, and are oftenassociated with laboratory XRF instrumentation, which results in a higher sensitivity (Figure4).The handheld XRF spectrometry system needs to be confirmed by the laboratory analysis6
because the laboratory-based XRF requires sequential extraction of heterogeneity of the sampleand higher energy source. Low-power X-ray tubes (1-50W) are sometimes considered to be aqualitative tool (Parsons et al. 2012) but it depends upon the analysis and calibration whether theanalysis is qualitative or quantitative. In spite of a number of advantages aforementioned, theshort half-life of the XRF sources may have implications for the instrument’s sensitivity. Thus,the sources needed to be replaced when the sensitivity is reduced. Calibration standards are thusmandatory and units may require servicing after two years.Laboratory XRF AnalyzerFigure 4. Laboratory-based Oxford instrument MDX1080 MDXRF analyzer.7
Handheld XRF AnalyzerFigure 5. Handheld Thermo Scientific Niton XL3t XRF analyzer.1.5 Factors Affecting XRF CalibrationEspecially for quantitative analysis, XRF methods require calibration of the XRFanalyzer with standards of known concentrations. The calibration simply compares the X-rayintensity of the elements of interest to the certified, known concentrations of a type of sample(e.g. solids, liquids, and films). During a calibration procedure the following factors, which mayinfluence the accuracy and precision of the method, should be considered: 1). detector resolutionand relationship to the spectral inferences; 2). sample matrixes; 3). accuracy and suitability of8
standards; and 4). sample morphology (i.e. uniformity, water content, particle size distributionand surface condition) and sample measurement geometry (Kalnicky and Singhvi 2001).These limiting factors can be addressed so that an appropriate and meaningful calibrationcan be done. Different detectors have different efficiency to resolve overlapped X-ray spectrallines. For example, overlapping lines between As-K and Pb-L might not be well separated bycertain detectors, resulting in analytical error. Matrix effects occur when other elements interferewith the target element, and this interference can have an impact on the measured X-ray intensityof the target element. These effects produce a non-liner intensity response versus target elementconcentration, and they appear as either X-ray absorption or enhancement phenomena. Theseeffects can be corrected when the XRF analyzers are calibrated (Parsons et al. 2012). Moreover,the standard concentrations should have accurate concentrations of those elements of interest tobe analyzed with a suggested time measurement. Also, the standard should exhibit the sametexture as the sample to be analyzed in order to have an accurate calibration method. It is welldocumented that the sensitivity of the XRF decreases as the distance between the sample beinganalyzed and the excitation source increases. This discrepancy can be reduced by maintaining thesame measurement geometry between all calibration standards and sample measurements. Forbest results, the window of the probe should be in direct contact with the sample.1.6 Interferences1.6.1 Effects of Particle SizeThe XRF analytical method has been demonstrated on different chemical composition ofall kinds of materials. The materials can be in solid, liquid, powder, filtered or other form.9
However, particle size in solid samples can influence the XRF accuracy. For example, Criss(1976) reported that the sensitivity of an XRF measurement goes down as the sizes and densitiesof the particles increase, because the X-ray absorption losses increase. Similarly, Maruyama etal. (2008) found that particle size effect in XRF showed a clear decrease in the XRF intensitieswhen these were observed with larger particle size. Both studies reported that correction can bemade.In regard to metal distribution at different particle size fractionations, it is welldocumented that finer particles tend to preferentially adsorb metals and be associated with highermetals concentrations (Forstner and Whitman 1983). For example, Luo et al. (2011) reported anenrichment of Pb, Cu and Zn in soils 100 um in an urbanized area in Hong Kong which wasstrongly influenced by anthropogenic activities and vehicular emissions. Clark et al. (1999)found soil samples that were sieved to 125 um had a higher Pb content than those sieved to 250 um. German and Svensson (2002) ascertained metals are a function of particle diameterand proportional to the inverse of the particle diameter, i.e. the highest metal concentrations areassociated with finest fractions.1.6.2 Moisture InterferenceSample moisture can affect the accuracy of the analysis. It was reported that samplemoisture as much as 20% can affect the analysis (Kalnicky and Singhvi 2001). So, soil andsediment samples should be routinely dried to remove all matric moisture when the water contentexceeds 20%. Limiting factors that affect the XRF performance capability include sensitivity ofinstrumental techniques; low concentration of element of interest; interference of other elements10
in the matrix; and using large volume of water as representative samples (Kalnicky and Singhvi2001).1.6.3 Elemental InterferenceThe XRF is sensitive to chemical matrix effects, and these effects occur as either spectralinterferences (peak overlaps), or as X-ray absorption and enhancement phenomena. Both of theseeffects are common in contaminated soils. The most common interference for As is Pb betweenthe emissions at 10.54 KeV and 10.55 KeV, respectively. To overcome this inference, an inbuiltauto-correction was employed using the Pb L emission line at 12.61 KeV to estimate theintensity of the Pb L emission (Model XLt 700 series) (Palmer et al. 2009). For instance,Parsons et al. (2012) reported that in soils, Pb interferes with As while a high Fe contentproduces a high background for Mn and Cu. As examples of absorption and enhancementeffects, Fe tends to absorb Cu X-rays, reducing the intensity of the Cu measured by the detector,while Cr will be enhanced at the expense of Fe because the absorption edge of Cr is a little bitlower in energy than the fluorescent peak of Fe. These effects can be mathematically correctedand compensated for.1.7 Detection LimitThe detection limit (DL), which is defined as three times the calculated standarddeviation, is influenced by variations in the physical matrix of the sample, radioisotopes and theelements of analysis. It also has been reported that the detection limits are influenced by theduration of analysis – the longer the analysis is, the lower the DLs tend to be. In a paperpublished by Schramm et al. (1999), they argued that long measurement times will result in a11
low detection limits and high precision. It should also be noted that, the use of one X-ray tube ina specific excitation arrangement cannot give optimal excitation conditions for light and heavyelements. So, the duration to obtain a DL of an element of interest can be different from that ofanother.Parsons et al. (2012) showed that time of analysis can determine whether the datacollected are quantitative or qualitative based on the USEPA quality criteria (Table 1). Theauthors found in their previous research that a suitable compromise between measurement timeand precision for a variety of metals is 120s while others use shorter measurement times, e.g. 45ssuch as in Kilbride et al. (2006). However, the optimal time required or considered adequate inresulting in quantitative data reflects the type, homogeneity and elements of interest of thesample. For instance, the authors reported that the XRF gave qualitative data for Cu when thecount time was for 60 s (%RSD 20.2). However, when the analysis time was 120s(%RSD 10.9), the XRF analyzer produced quantitative data for Cu. There are three types ofquantitative data (Definitive 1, Quantitative 2, and Quantitative 3). Different elements mayrequire different analysis (longer or shorter) durations.They suggested that As at low concentrations ( 30mg/kg) exhibited no significantdifference when the analysis exceeded 100s. Manganese at 500 mg/kg and Zn at 100 mg/kgshowed no significant difference after the analysis of 300s and 50s, respectively, but showeddifferences at a shorter time of analysis. However, not only are detection limits influenced byphysical matrix effects and the elements of analysis, but they are also affected by high analyteconcentrations (USEPA 2008). It is, therefore, recommended that only analyte concentrationscloser to the minimum detection limit should be used. Despite the USEPA’s (2008)recommendation on the use of low analyte concentration that may affect the sensitivity of the12
XRF, Murphy et al. (2012) found a strong linear regression with an r2 value of .999 for skincreams spiked with DMSO (Dimethylsulfoxide) up to 30,000 ppm. So, the DL of the XRF reallydepends on the type of the instrument and the type of sample media.13
2. LITERATURE REVIEW2.1 Analysis of SedimentsContamination of metals in soil has been well documented in recent years and morenumerous studies are being carried out in different parts of the world (Powell and Alexander2003; Mendil and Uluozlu 2007; Wuana and Oklelmen 2011). The analysis of potentiallycontaminated soil via conventional methods such as the atomic absorption spectrometry (AAS)often takes weeks due to sample preparation and can be expensive. For management, instantanalysis of contaminated soil, sediments or geoprospecting may be required to guide furtheranalysis and mapping of the area. The evolution of the XRF application has been reengineeredto improve the sensitivity in a more accurate and prec
handheld XRF (XL3t 900, Billerica, MA) on skin whiteners, which were purchased and donated by university students for mercury levels. The results showed that up to 98 samples (16%) of creams analyzed contained mercury