Transcription
4/9/2017PHOTOELECTRON SPECTROSCOPY(XPS)PRINCIPLES AND APPLICATIONSProf. Nizam M. El-AshgarPhotoelectron SpectroscopyXPS What is XPS? Aim of XPS Analysis. General Theory How can we identify elements and compounds? Instrumentation for XPS Examples of materials analysis with XPS٢1
4/9/2017What is XPS? X-ray Photoelectron Spectroscopy (XPS), alsoknown as Electron Spectroscopy for ChemicalAnalysis (ESCA) is a widely used technique toinvestigate the chemical composition ofsurfaces. Sample is illuminated with soft (1.5kV) X-rayradiation in an ultrahigh vacuum. The photoelectric effect leads to the productionof photoelectrons, the energy spectrum of whichcan be determined in a beta-ray spectrometer.٣X-ray Photoelectron spectroscopy, based onthe photoelectric effect,1,2 was developed inthe midmid--1960’s by Kai Siegbahn and hisresearch group at the University of Uppsala,Sweden.3Sweden1. H. Hertz, Ann. Physik 31,983 (1887).2. A. Einstein, Ann. Physik 17,132 (1905). 1921 Nobel Prizein Physics.3. K. Siegbahn, Et. Al.,Nova Acta Regiae Soc.Sci., Ser. IV,Vol. 20 (1967). 1981 Nobel Prize in Physics.2
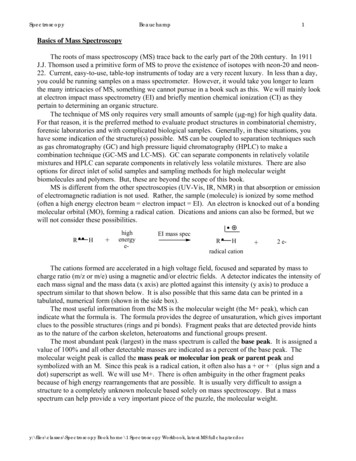
4/9/2017The Atom and the X-RayX-RayFree electronValence electronsprotonneutronelectronCore electronselectron vacancyThe core electrons respond verywell to the X-Ray energyX-Rays on the Surfacee- top layere- lower layerbut no collisionse- lower layerX-RaysOuter surfaceInner surfacewith collisionsAtoms layers3
4/9/2017X-Rays on the Surface The X-Rays will penetrate to the core e- of theatoms in the sample. Some e-s are going to be released without anyproblem giving the Kinetic Energies (KE)characteristic of their elements. Other e-s will come from inner layers and collidewith other e-s of upper layers– These e- will be lower in lower energy.– They will contribute to the noise signal of thespectrum.X-Rays and the ElectronsElectron without collisionX-RayElectron with collisionThenoisesignalcomesfromtheelectrons that collidewith other electronsof different layers.The collisions causea decrease in energyof the electron and itnolongerwillcontributetothecharacteristic energyof the element.4
4/9/2017Aim of XPS Analysis Identification of elements at surfaces (depth:10 nm). Identification of functional groups and redoxstates. Concentration and depth profiling. Estimation of over layer thickness. Comparison of bulk and surface composition. Surface homogeneity/heterogeneity Possible surface morphology of adlayers.٩Physical Bases Based upon photon in/electron out process. Photon E (Einstein ): E hνwhere : h - Planck constant ( 6.62 x 10 -34 J s ).ν - frequency (Hz) of the radiation. In XPS the photon is absorbed by an atom in amolecule or solid, leading to ionization and theemission of a core (inner shell) electron. If the photon interacts with valence levels(ionization by lost of one of them) the technique isdifferent and called UPS, Ultraviolet photoelectronspectroscopy .١٠5
4/9/2017Photoelectrıc effect١٢6
4/9/2017Introduction to the Solid StateIn solids, atomic and molecular energylevels broaden into bands that in principlecontain as many states as there areatoms/molecules in the solid.١٣Process of PhotoionizationA hνA eE(A) h ν E(A ) E(e-)KE h ν – [ E(A ) - E(A) ] The difference in energy between theionized and neutral atoms, is generallycalled the binding energy (BE) of theelectron:KE h ν - BE١٤7
4/9/2017The Photoelectric ProcessEjected PhotoelectronIncident XX-rayFreeConduction BandnElectron LevelFermiValence BandLevel2pL2,L,L332sL11sKnXPS spectral lines areidentified by the shellfrom which the electronwas ejected (1s, 2s, 2p,etc.).etcTheejectedphotoelectron has kineticenergy::energyKE hv – BE - φnFollowing this process,the atom will releaseenergy by the emissionof an Auger Electron.Electron.١٦8
4/9/2017The BE is a direct measure of the energy required to justremove the electron concerned from its initial level to thevacuum level and the KE of the photoelectron is againgiven by :KE h ν - BENOTE - the binding energies (BE) of energy levels insolids are conventionally measured with respect to theFermi-level of the solid, rather than the vacuum level.This involves a small correction to the equation givenabove in order to account for the work function (φ) ofthe solid, but for the purposes of the discussion belowthis correction will be neglected.١٧Binding Energy (BE)vThe Binding Energy (BE) is characteristic of the core electrons foreach element.vThe BE is determined by the attraction of the electrons to the nucleus.vIf an electron with energy x is pulled away from the nucleus, theattraction between the electron and the nucleus decreases and theBE decreases.vEventually, there will be a point when the electron will be free of theThis is the point with 0 energynucleus.0B.E.xp of attraction between theelectron and the nucleus. Atthis point the electron is freefrom the atom.These electrons areattracted to the protonwith certain bindingenergy x9
4/9/2017Why the Core Electrons? An electron near the Fermi level is far from the nucleus,moving in different directions all over the place, and will notcarry information about any single atom.– Fermi level is the highest energy level occupied by anelectron in a neutral solid at absolute 0 temperature.– Electron binding energy (BE) is calculated with respect tothe Fermi level. The core e-s are local close to the nucleus and have bindingenergies characteristic of their particular element. The core e-s have a higher probability of matching theenergies of AlKα and MgKα X rays.Valence eCore e-Atom19XPS Spectra1- Characteristic binding energy associated with eachcore atomic orbital i.e. each element will give rise to acharacteristic set of peaks in the photoelectronspectrum at kinetic energies determined by thephoton energy and the respective binding energies.2- The presence of peaks at particular energiestherefore indicates the presence of a specific elementin the sample under study.3The intensity of the peaks is related to theconcentration of the element within the sampledregion. (quantitative analysis of the surfacecomposition).٢٠10
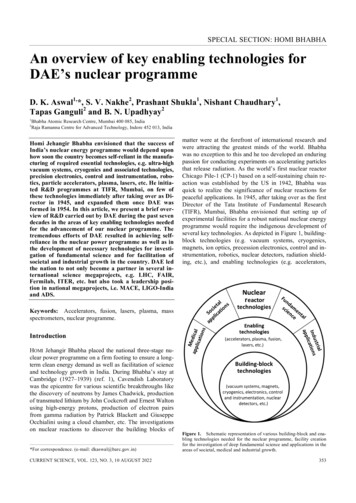
4/9/2017KE versus BEKE hv – BE - Ø# of electronsKE can be plotteddepending on BE.Each peak represents theamount of e-s at a certainenergythatischaracteristic of someelement.EEEBinding energy(eV)BE increase from right to left1000 eV0 eVKE increase from left to rightXPS Spectrum The XPS peaks are sharp. In a XPS graph it is possible to see Augerelectron peaks. The Auger peaks are usually wider peaks in aXPS spectrum. Aluminum foil is used as an example on thenext slide.11
4/9/2017XPS SpectrumO 1sO AugerO becauseof Mg sourceCO 2sAlAlIdentification of XPS Peaks The plot has characteristic peaks for eachelement found in the surface of the sample. There are tables with the KE and BE alreadyassigned to each element. After the spectrum is plotted you can look forthe designated value of the peak energy fromthe graph and find the element present on thesurface.12
4/9/2017X-rays vs. e- Beam X-Rays– Hit all sample area simultaneously permittingdata acquisition that will give an idea of theaverage composition of the whole surface. Electron Beam– It can be focused on a particular area of thesample to determine the composition ofselected areas of the sample surface.XPS Technology Considerasnondestructive.– because it producessoft x-rays to inducephotoelectronemission from thesample surface Provide information aboutsurface layers or thin filmstructures Applicationsintheindustry:– Polymer surface– Catalyst– Corrosion– Adhesion– Semiconductors– Dielectric materials– Electronics packaging– Magnetic media– Thin film coatings13
4/9/2017How Does XPS Technology Work? A monoenergetic x-ray beam emits photoelectrons from the fromthe surface of the sample. The penetration of the x-ray photons about a micrometer of thesample The XPS spectrum contains information only about the top 10 100 Ǻ of the sample. Ultrahigh vacuum environment to eliminate excessive surfacecontamination. Cylindrical Mirror Analyzer (CMA) or hemispherical sectoranalyzer (HSA) measure the KE of emitted e-s. The spectrum plotted by the computer from the analyzer signal. The binding energies can be determined from the peak positionsand the elements present in the sample identified.Instrumentation:COMPONENTS OF XPSvA source of X-raysvAn ultra high vacuum (UHV)vAn electron energy analyzerv magnetic field shieldingvAn electron detector systemvA set of stage manipulators14
4/9/2017The basic requirements: A source of fixed-energy radiation (an x-raysource). An electron energy analyzer (which can dispersethe emitted electrons according to their kineticenergy, and thereby measure the flux of emittedelectrons of a particular energy). A high vacuum environment (to enable theemitted photoelectrons to be analyzed withoutinterference from gas phase collisions).٢٩XPS InstrumentX-Ray SourceIon SourceSIMS AnalyzerSecondary ion massspectrometry (SIMS)Sample introductionChamber15
4/9/2017X-ray PhotoelectronSpectrometer٣١Diagram of the Side View of XPS SystemX-Ray sourceIon sourceDetectorSIMSAnalyzerAxial Electron GunSample ing PumpIon Pump16
4/9/2017Schematic Diagram of XPS٣٣Energy of LightWavelength(λ)106µm 103µm 1 µm10-3µm 10-6µm10-6eV1 KeV10-3eV 1 eV1 MeVEnergyX-rayShort wave radioBroad-cast(E)17
4/9/2017X-Ray Sources Irradiate the sample surface, hitting the core electrons(e-) of the atoms. The X-Rays penetrate the sample to a depth on theorder of a micrometer. Useful e- signal is obtained only from a depth of around10 to 100 Å on the surface. Normally, the sample will be radiated with photons of asingle energy (MgKα or AlKα). This is known as a monoenergetic X-Ray beam. The X-Ray source produces photons with certainenergies:– MgKα photon with an energy: hν 1253.6 eV– AlKα photon with an energy :h ν 1486.6 eVThe emitted photoelectrons will therefore have kineticenergies in the range of ca. 0 - 1250 eV or 0 - 1480 eVX-ray Source Requirements 1. High X-ray flux at sample2. Narrow X-ray line width3. Multiple-anode capability4. Ability to move the X-ray source (X-Y)and retract it (Z) 5. Long anode and filament lifetime٣٦18
4/9/2017The X-ray source for XPS: In contrast to the electron source, the X-raysource energy depends on the choice of theanode material, resulting in the availability of anumber of discrete energies rather than acontinuous variation of the energy, as exists forelectron and ion guns. The photon energy must be sufficiently high toexcite intense photoelectron peaks from allelements of the periodic table. For XPS analysis, it is very important toconsider the energy resolution of the primary Xrays.٣٧Early x-ray sourceX-ray tubeStandard lab Xray source is byvery high energy ebeam hitting theanode.19
4/9/2017X-ray spectrum from x-ray tubeCharacteristic lines from the X rayfluorescence process (XRF) and abroad background (Bremsstrahlung),which is strongly depends on theenergy of the electronMonochromatic X-rayGoal to achieve1.2.3.EnergyRowland CircleAnalyzerNarrow peak widthReduced backgroundNo satellite & GhostpeaksQuartzCrystal Dispersernλ 2dsinθe-SampleX-ray AnodeForquartz(1010)surface, d 0.42 nm and78.5 degree for Al Kα0.93 nm20
4/9/2017Synchrotron RadiationThe synchrotron storage ring is a tubular vacuum chamber made to:Hold an electron beam travelling through it at nearly the speed of light.Maintain the high energy of the electron beam. As the accelerating electronscircle the ring at relativistic velocities, they give off intense beams of lightincluding x-rays. By using a monochromator the light will beMonochromatic.Key properties of synchrotron radiation:high intensitytunability in wide rangenear-coherence ﺔﻛﺳﺎﻣﺗﻣ polarized.pulsedwell collimatedNUS has such a source in Singapore!Sample charging effectsThe light for XPS always charges surface positively (shifting ofspectrum to higher binding energy) and leads to general instability(spectral noise).For the metal sample, which can be grounded and the charges canbe quickly gone.However, for insulator, this effects are serious and need to betreated.For XPS (evenAES) never forgetground thesample !!!C 1s shifts due to the charging21
4/9/2017Inhomogeneous Surface ChargingCharging can even change the line shape due to InhomogeneousSurface Charging, which have different positive voltage on thesurface.In a lot of cases,thereisonlyspectral shift due tocharging, which canbe determined bycomparisonwithknownelementalXPSlines,forexample C 1s.Vacuum System The instrument usesdifferent pump systemsto reach the goal of anUltra High Vacuum(UHV) environment. The Ultra High Vacuumenvironmentwillprevent contaminationof the surface and aidan accurate analysis ofthe sample.University of Texas at El Paso, Physics DepartmentSide view of the Phi 560 XPS/AES/SIMS UHV System22
4/9/2017UHV for Surface Analysis? Why٤٥XPS AnalyzerAnalyzer Requirements1. Precision energy measurement across awide energy range2. High-energy resolution capability3. Ability to define the analysis area and, ifpossible, to change it4. High dynamic range and low noisedetector٤٦23
4/9/2017Instrumentation (analyzers)Analyzer:Most essential part of any electron spectroscopy,its characteristic are: energy range, energyresolution, sensitivity and acceptance angle.Normally its functions involve: retarding اﻋﺎﻗﺔ ofthe incoming electron, selection of the electronswith right kinetic energy (pass energy), detectingof the electrons (channeltron)Detection of electron energy (Analyzers) Mainly two types of detectors are used in AES and XPSsystems: The cylindrical mirror analyser (CMA) and thehemispherical sector analyzer (HSA). In the past, the CMA was preferred for AES systems merely forgeometrical reasons and for its high analyzer transmissionfunction, and the HSA analyzer for XPS for its superior energyresolution. More and more, however, depending on the constructor and onthe requirements of the customer, the HSA detector is alsoused in AES systems. A multifunctional AES-XPS system is evidently operated byonly one electron detector, and mostly a HSA type is chosen. Yet, it is important to mention that not all of the requirementsimposed by the type of analysis coincide for XPS and AES .٤٨24
4/9/2017The hemispherical sector analyzers (HSA All constructors use HSA detectors for electron dispersionanalysis in XPS. A typical configuration is shown in Fig. bellow. The HSA is designed to have a constant and as high aspossible energy resolution for the detection ofphotoelectrons. The best energy resolution in XPS is 0.4 eV,corresponding to the line width of the monochromator. In order to reduce the size of the analyzer, it is standardpractice to retard the kinetic energies of thephotoelectrons either to a user-selected analyzer energy,called pass energy, or by a user-selected ratio.٤٩Mode of fixed analyzer transmission mode (FAT) Also known as the constant analyzer energy mode (CAE). In this mode of operation, which is applied for the detection ofphotoelectrons, a constant voltage is applied across the hemispheresallowing electrons of a particular energy to pass between them. The most important characteristic in this case is a constant energyresolution in the spectrum as a function of the energy, in contrast tothe CMA analyser where a relative energy resolution is obtained. The electrons are emitted from the specimen and transferred to thefocal point of the analyzer by the lens assembly. At this point they are retarded electrostatically before entering theanalyzer itself. Those electrons with energies matching the pass energy of theanalyser are transmitted, detected and counted by the electrondetector. The retarding field potential is then ramped, and so the electrons arecounted as function of energy.٥٠25
4/9/2017Improving Sensitivity of HSA To improve the sensitivity of the HSA, the electrondetection is done by a multichannel detectorsystem. Depending on the type of system, the number ofelectron multipliers may go up to 16. This parallel electron detection is especiallyuseful when a monochromator is used due to theloss of intensity of the primary X-rays.٥١٥٢26
4/9/2017Sample Preparation & Surface Damage in XPS1. Any Sample that is vacuum stable can be analyzedby XPS.2. Sample containing volatile components can becooled to low temp. to avoid devolatilization3. Normally, Solid materials, such as metals ceramics& polymer, are fairly stable under X-ray irradiationand damage caused by X-ray is minimal during atypical XPS experiment4. Films, plaques اﻟواح or powders can be mounted ona sample holder with a double-sided sticky tape ﺷرﯾط ﻻﺻق of low volatility first and then examined asbulk samples.٥٣5. Certain Polymer & Biological samples wouldundergo some chemical changes under prolongedX-ray exposures in an XPS experiment.Examples are: PTFE, PVC, PVA, especially., whenthe materials are in thin films.6. To minimize the damage, the exposure timeshould be as short as possible, and the samplesare cooled to low temperatures.7. The causes for the XPS induced damage include:secondary electrons generated at X-ray source &impinging on the polymer or biological samplesurface.٥٤27
4/9/2017XPS InstrumentThe XPS is controlled byusing a computer system.The computer system willcontrol the X-Ray typeandpreparetheinstrument for analysis.University of Texas at El Paso, Physics DepartmentFront view of the Phi 560 XPS/AES/SIMS UHV System and thecomputer system that controls the XPS.Where do Binding Energy Shifts Come From? Orelement or compound identification.٥٦28
4/9/2017Elemental Shifts٥٧Elemental Shifts29
4/9/2017Binding Energy DeterminationThe photoelectron’s binding energy will be based onthe element’s final-state configuration.Initial StateFreeFinal StateElectonConduction BandLevelFermiConduction BandLevelValence BandValence Band2p2s1sElectronic EffectSpin-Orbit Splitting or Spin-Orbit Coupling Some electronic levels (most obviously 3p and 3d ) giverise to a closely spaced doublet, Which appear whenspectra expanded. Permitted J values L S Coupling between L: The Angular Q.N., S: UnpairedSpin The lowest energy final state is the one with maximum J The relative intensities of the two peaks reflects thedegeneracies of the final states (gJ 2J 1), 2D 5/2:gJ 2x{5/2} 1 6 (lower B.E)2 D 3/2:gJ 2x{3/2} 1 4 (higher B.E) These two values determines the probability of transitionto such a state during photoionization.٦٠30
4/9/2017٦١٦٢31
4/9/2017s-Orbital٦٣p-Orbital٦٤32
4/9/2017d-Orbital٦٥f-Orbital٦٦33
4/9/2017Chemical ShiftsThe exact binding energy of an electron depends notonly upon the level from which photoemission isoccurring, but also upon :1) The formal oxidation state of the atom.2) The local chemical and physical environment.Changes in either (1) or (2) give rise to small shifts in thepeak positions in the spectrum - so-called chemical shifts .Atoms of a higher positive oxidation state exhibit ahigher binding energy due to the extra coulombicinteraction between the photo-emitted electron and theion core.٦٧ The shifts are typically a few to 10 eV or more, andtherefore detectors with a high energy resolution are used. To subtract chemical information , it is imperative todetermine peak positions as accurately as possible. The line of interest is preferentially evoked اﯾﺿﺎح by meansof a monochromatic X-ray source, and recorded with thehighest possible energy resolution. When dealing with small chemical shifts, overlapping peaksmay anyway occur in the spectra. Peak deconvolution ﻓك اﻟﺗداﺧل and peak fitting tools areavailable in the commercial data handling systems.٦٨34
4/9/2017 The capability to distinguish between different chemical statesis the main characteristic of XPS. Due to this, another acronym is in use for this technique: ESCA,which stands for ‘Electron Spectroscopy for Chemical Analysis’.FWHM:fullwidth at halfmax. Int.٦٩٧٠35
4/9/2017Chemical Shifts-Electronegativity Effects٧١Why Chemical Shift In AES, the situation is lesspromisingØ Firstly, most AES lines are by nature broader than XPSlines.Ø Secondly, the Auger transition involves three electrons andthe overall chemical shift is influenced by the three energylevels concerned. In general, similar shifts of a few eV as for XPS are to beexpected, especially when core electrons are involved in thetransition. Since in AES-specific equipment, detectors with lowerenergy resolution are used. It is clear that chemical shifts in AES are not often measuredaccurately. Moreover, peaks corresponding to transitions with valenceelectrons are broad and poorly defined, which makes the٧٢assignment of chemical shifts nearly impossible.36
4/9/2017Thechemicalshifts due to thevariation of thedistribution of thecharges at theatom site is themain reason forthe other name ofXPS:ESCA (ElectronSpectroscopy forChemicalAnalysis)As the samples shown before, binding energies of Al3 is higherthan the metal atom, in the meanwhile, the binding energy ofO atom (more positive charge) is higher than the O2- ion.Chemical Shifts- Electronegativity Effects٧٤37
4/9/2017Electronic Effects- Spin-Orbit CouplingTi MetalTi OxideC1s envelope has been resolved into five componentsof polystyrene surface exposed to an oxygen plasma.٧٦38
4/9/2017Final State Effects-Shake-up/ Shake-offResults from energy made available in the relaxation of thefinal state configuration (due to a loss of the screening effect ofthe core level electron which underwent photoemission).photoemission). Monopole transition: Only the principle quantumnumber changes. Spin and angular momentumcannot change. Shake-up: Relaxation energy used to exciteelectrons in valence levels to bound states(monopole excitation). Shake-off: Relaxation energy used to exciteelectrons in valence levels to unbound states(monopole ionization).7839
4/9/2017Ni MetalNi Oxide٧٩Shake-up and shake-offPhotoemission process canleave the ions in the groundstate (main peak) and alsopossibly in an excited sate(shake-up/shake-offsatellites), the latter makesthe KE of photoelectron less:higher BE.- excitation of electron tobound state shake-upsatellite.- excitation of electron tounbound(continuum)state shake-off satellite.- excitation of hole stateshake-down satellite - rare.40
4/9/2017vThe shown is XPSspectra for Cu 2pphotoemissionatdifferent chemical states.vThe shake-up Lines doesnot exist in Cu metal, andis unique for CuO AndCuSO4Energy loss lineseph esolide*ph e**solidPhotoelectrons travelling through the solid can interact with other electronsin the material. These interactions can result in the photoelectron exciting anelectronic transition, thus losing some of its energy (inelastic scattering).Most common are due to interband or plasmons (bulk or surface).(bulk plasmon)Surface plasmon41
4/9/2017Electron Scattering EffectsPlasmon Loss PeakO 1s21 eVInsulatingMaterialx4The plasmon loss satellites are rarely sharp in insulators but veryprominent in the metals.The main peak is normally observed at higher binding energy withseveral lines with the same energy intervals and reduced intensity, andthe interval can be not only single one due to different origins: bulk orsurface plasmons, bulk one is more prominent and interval larger (21/2factor of the surface one).Final State Effects- Multiplet SplittingFollowingphotoelectronemission, the remainingunpaired electron maycouple with other unpairedelectrons in the atom,resulting in an ion withseveral possible final stateconfigurations withasmany different energies.This produces a line whichis split asymmetrically intoseveral components.42
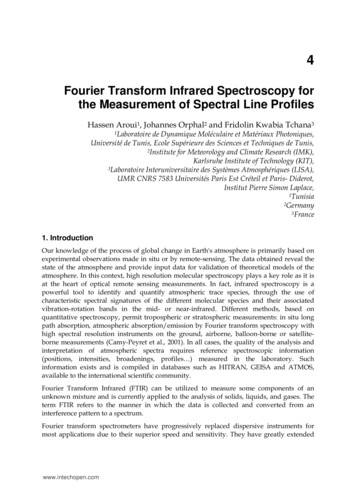
4/9/2017Relative Sensitivities of theElements123dRelative Sensitivity1084f62p44d1s20Li B N F Na Al P Cl K Sc V M Co Cu G As Br Rb Y Nb Tc Rh Ag In Sb I Cs La Pr P Eu Tb Ho T Lu Ta Re Ir Au Tl BiBe C O Ne M Si S Ar Ca Ti Cr Fe Ni Zn G Se Kr Sr Zr M Ru Pd Cd Sn Te Xe Ba Ce Nd S G Dy Er Yb Hf W Os Pt Hg PbElemental SymbolXPS of Copper-Nickel alloy120PeakAreaCu 2p100NiCuN(E)/ET V/sec2.653.65%CuLMM CuNiLMM CuLMM NiLMMLMM NiLMMNi 2p40Ni 3p20Cu 3p0-1100-900-700-500-300-100Binding Energy (eV)43
4/9/2017Applicationsof X-ray PhotoelectronSpectroscopy (XPS)٨٧Which Materials AnalyzedvXPS is routinely used to analyze inorganic compounds,metals, semiconductors, polymers, ceramics, etc.vOrganic chemicals are not routinely analyzed by XPSbecause they are readily degraded by either the energyof the X-rays or the heat from non-monochromatic Xray sources.44
4/9/2017ANALYSIS OF XPSvXPS detects all elements with (Z) 3. It cannotdetect H (Z 1) or He (Z 2) because thediameter of these orbitals is so small, reducingthe catch probability to almost zerovDedection unit: ppt and some conditions ppm.For example: determination ofalumınum oxide thickness wıth xps45
4/9/2017XPS Analysis of Pigment from MummyArtwork٩١Analysis Carbon Fiber- Polymer CompositeMaterial by XPS٩٢46
4/9/2017Analysis of Materials for Solar Energy Collection byXPS Depth ProfilingThe amorphous SiC/SnO /SnO2 Interface٩٣٩٤Electron Spectroscopy for Chemical Analysis (ESCA)47
4/9/2017a) The C1s spectrum (resolved into component peaks) for thehardsegmentpolyurethane;٩٥(b) the O1s spectrum for the hard-segment polyurethane٩٦48
4/9/2017(c ) the N1s spectrum for the hard-segment polyurethane٩٧X-rays will penetrate deeply into asample, and stimulate electronemissionspecimen.throughouttheOnly those electrons emitted fromthe surface zone that havesuffered no energy loss willcontribute to the photoemissionpeak.٩٨Electrons emitted from the surfacezone that have lost some energydue to inelastic interactions willcontribute to the scatteringbackground.49
4/9/2017ESCA spectra are convolutions of the information from٩٩eachdepth within the sampling depth.١٠٠50
4/9/2017Hydroxy groups and ethers on a surface cannot bedistinguished based upon ESCA chemical shifts. If the surfaceis reacted with trifluoroacetic anhydride, only hydroxyl groupswill pick up F. The size of the F peak in the ESCA spectrum١٠١ be proportional to the number of reacted hydroxyl groupswillCase study of XPSCompositional Analysis of Surfaces:Case I: Analysis of surface treatment of a piston.Coating Material: Fluorocarbon١٠٢51
4/9/2017Polysiloxane Immobilized LigandSystemOOOCH 2C O C2H 5 H 2N(CH2) 2NH2NSiCH2OC O C2H5Reflux/Toluene - C2H5OHOOOOOSiCH 2CNHNH 2CH 2C NHNH2NO١٠٣١٠٤52
4/9/2017١٠٥XPS 542.419.328.79.6١٠٦53
4/9/2017Conclusion XPSis a powerful technique forcharacterizing solid surfaces. All types of inorganic soids can be analyzed. Elemental (except H, He) and chemicalanalyses within a depth of 10 nm. Quantitative technique. Extremely useful for surface treatment ofmaterials.١٠٧54
X-ray spectrum from x-ray tube Characteristic lines from the X ray fluorescence process (XRF) and a broad background (Bremsstrahlung), which is strongly depends on the energy of the electron Monochromatic X-ray 1. Narrowpeakwidth 2. Reducedbackground 3. No satellite & Ghost peaks Goal to achieve Sample XX--ray Anode Energy Analyzer Quartz .