Transcription
Operations and MaintenanceBENCHMARKSfor Health Care Facilities Report
Operations and maintenance benchmarks for health care facilitiesCommitteeTim Adams, FASHE, CHFM, CHC, Director, Member Professional Development, American Society of Healthcare EngineeringShari Epstein, CAE, Director, Research, International Facility Management AssociationWilliam L. Gregory, IFMA Fellow, PE, CFM, Vice President Facility Management, Adelphoi USATodd Wilkening, VP Research, IFMA Health Care Council Copyright 2010 by the International Facility Management Association. All rights reserved.This publication may not be reproduced, stored in a retrieval system or transmitted in whole or part, in any form or by anymeans, electronic, mechanical, photocopying, recording or otherwise without the written permission of the InternationalFacility Management Association.For more information, please contact:IFMA Research Department1 East Greenway Plaza, Suite 1100, Houston, TX 77046-0104, USAPhone: 1-713-623-4362Fax: 1-713-623-6124E-mail: councils@ifma.orgISBN 1-883176-82-4
Operations and MaintenanceBENCHMARKSfor Health Care Facilities Report
Table of ContentsIntroductionUsing This Report7About this Report7Methodology7Definitions for Operations and MaintenanceBenchmarks for Health Care Facilities Report9Section 1:Facility DescriptionIndustries Represented13Facility Description13Location of Hospital14Hospitals by Region14Climate Zones for the United States and Canada15Facility Age16Facility Setting16Ownership17Developed Acres18Days and Hours of Operations18Central Plant19Staff Size19Operating Budget20Facility Size21Adjusted Patient Days and Discharges22Space per Occupant22Customer Satisfaction23Section 2:Utilities4Utility Costs24Utility Consumption27Energy Use Index28Energy Management Practices28Building Automation System29Operations and Maintenance Benchmarks for Health Care Facilities Report IFMA 2010
Table of ContentsSection 3:maintenanceMaintenance Categories31Maintenance Costs32Roads and Grounds34Facility Operating CurrentReplacement Value (CRV) Index35Maintenance Tracking35Maintenance Management System Used36Maintenance Staffing37Maintenance Management39Administrative Support40Total Maintenance41Maintenance Service Provision41Section 4:Environmental ServicesEnvironmental Services Costs46Environmental Services Staffing47Contractor Practices47Section 5:WasteWaste Utilization50Section 6:Linen ServicesLinen Services52Section 7:Cost of OperationsCost of Facility Operations54Operations and Maintenance Benchmarks for Health Care Facilities Report IFMA 20105
IntroductionWe are pleased to have completed the first significant benchmarking in health care facilitymanagement operations as a combined effort of the International Facility ManagementAssociation (IFMA) Health Care Council and American Society for Healthcare Engineering(ASHE). The IFMA Health Care Council and ASHE joined in a collaborative effort with the signingof a Memorandum of Understanding on October 25, 2007. This combined effort joined IFMA’sexpertise in facility management with the expertise of the ASHE in health care engineering toproduce this significant work.For those of us that work in facility operations for acute care hospitals know only too well howimportant it is to have good data not only on cost but metrics of cost to establish productivitymeasures, metrics of our contributions to the overall business and the resulting appropriateallocation of precious resources. Collaborative benchmarking at the FM and C-Suite levels hasproven to be an absolute in winning together.I sincerely thank each and every one of our IFMA and ASHE members as well as other healthcare professionals who participated in completing this inaugural benchmarking survey. We alsoacknowledge the contribution of the members’ support staff who assisted in collecting thenecessary data to respond to the questionnaire. It is our hope we can continue this effort toupdate the work every couple of years.A special thanks to Tim Adams, ASHE’s Director of Professional Development; Todd WilkeningVP of Research of IFMA’s Health Care Council; and Shari Epstein, IFMA’s Director of Research fortheir tireless efforts and passion in making the final result a reality.William L Gregory, PE, CFM, IFMA FellowPresidentIFMA Health Care Council6Operations and Maintenance Benchmarks for Health Care Facilities Report IFMA 2010
IntroductionUsing This ReportThe information contained in thereport represents a “self-report”from ASHE and IFMA members. Allinformation was voluntarily providedbut was not checked with sitevisits. When interpreting the data,it is important to remember thatevery facility is different, and everyorganization operates using differentaccounting and measuring practices.The data listed in this report will notprovide a perfect comparison ofyour organization to that of anotherhospital, but it should give you a goodidea how your facility fits into the rangeof performance.The percentile charts in this reportallow you to see how your operationranks against other organizations.The arrows beside some chartsshow the “best-in-class” direction.Using your facility’s numbers for theperformance indicator, determinewhether your building is above orbelow the median (50th percentile).If your facility falls way above orbelow the median, you may want toexamine your cost or procedures inthat area. However, your hospital maydiffer from the median due to type offacility, climate, or labor market. Thedata should help you identify areaswhere you can improve your facilityoperation.Readers will see arrows pointing inan upward or downward directionnext to several of the percentilecharts in this report. In many casesthe arrow points toward the lowestcost; however, the organization withthe lowest cost may not profess tohave the best practice. There maybe a reason why a cost is so low.For example, a hospital buildingscheduled for demolition would likelyapply minimal resources and thuscosts would be lower.Using this report is the first stepin benchmarking. After you haveidentified areas where your facilityoperations could be improved, youshould conduct additional researchbefore reengineering the process.One should not immediately rushto find out which health careorganization is “best in class” andcopy their practice. Instead youshould look for a more homogeneousgroup in which to compare.AcknowledgementsIFMA and ASHE rely on thewillingness and generosity of theirmembers to compile the data andcomplete this lengthy benchmarkingsurvey. Without their data, therewould be no report. We thank thesededicated participants for theircontribution. We are thankful fortheir support to this initial endeavorbetween the two organizations.About This ReportTo create this report, a committeeof ASHE and IFMA volunteers withexpertise in environmental services,maintenance, energy managementreviewed questions posed inprevious IFMA and ASHE surveysand developed new questions tobetter match today’s practices. Oncetested, the 10-page survey was sentelectronically in March 2009 to morethan 10,000 members in the UnitedStates and Canada. Although thesurvey was issued to ASHE andIFMA members, membership wasnot a requirement to participate.Survey recipients were encouragedto circulate the survey to the personresponsible for the activity.Findings are discussed in thesections that follow. Statisticallysignificant findings are integratedin the text of the report. Whenapplicable, comparisons are madeto previous benchmarking reports.Additional copies of this report maybe ordered through IFMA’s andASHE’s bookstores.MethodologyThe Operations and MaintenanceBenchmarks for Health Care Facilitiessurvey was developed in fall of 2008.The committee used a 2005 IFMAquestionnaire, adding many questionsspecific to health care facilities suchas environmental and linen services.Committee members examined eachquestion to make sure questionswere clear, unambiguous, conciseand relevant. Questions were askedin an objective fashion in orderto obtain responses that are trulyrepresentative of industry practices.The survey was created as an Adobe.pdf interactive form document.In March 2009, IFMA and ASHEmembers received an e-mail directingthem to a link on IFMA’s websitewhere they could download theelectronic survey. Respondentswere asked to provide informationon the facilities they manage for a12-month period of time. Many choseto report the data for calendar year2008. A total of 151 surveys werereturned during a nine-month period.A completion rate of 50 percent wasconsidered usable.To ensure high quality data,highly structured coding and dataverification procedures were use.In addition, all variables and valueswere checked to verify that theywere within appropriate ranges andinappropriate outliers were correctedor removed. The majority of openended responses were read andcoded into quantifiable variablesto assist in analysis of the data.A full statistical analysis followed,using SPSS-PC . IFMA usednonparametric and bivariate statisticaltechniques to conduct the dataanalysis. Standardized data analysisprocedures included reviewingOperations and Maintenance Benchmarks for Health Care Facilities Report IFMA 20107
Introductiondescriptive frequency counts andcross tabulations of responses forvariables of interest.To maintain real world usability ofthese research findings, statisticsare most often provided in termsof absolute number of responses,percentages and mean averages.Percentages may not add to 100percent due to rounding or theacceptance of multiple responses. Inmany cases, some respondents didnot answer all questions, so the basenumbers differ among the findings.Several tables have blanks in lieu ofa number because there were notenough responses to generate a validstatistic.Additional calculations were made todetermine cost and utility consumptionper square foot, square footage peroccupant and cost per discharge.Utility consumption data waschanged to match the unit specified.Canadian cost data was convertedto U.S. currency by multiplying costsby a factor of 0.96, the currencyexchange rate on January 28, 2010.Metric numbers were converted tostandard. If data appeared out ofrange, the respondent was contactedto determine how the information wasderived and new information wassubsequently entered.understand that the results presentedin this report represent the sampleof organizations that chose to supplythe requested facility information.A confidence level and marginof error provide readers somemeasure of how much they can relyon survey responses to representall IFMA member organizations.Given the level of response to thissurvey, IFMA is 95% confident thatresponses given by all respondingorganizations can be generalizedto all IFMA member organizations,in general with a margin of error ofapproximately /- 8.0%. For example,83% of the respondents reportedthat conduct facility related customersatisfaction surveys. With an 8%margin of error for the sample size of125, the reader can be 95% certainthat between 75% and 91% of allmanagers within health care settingscollect some type of facility relatedcustomer satisfaction data. It isimportant to note that as the samplesize decreases, which occurs in manyof the tables, the margin of errorincreases. For example, a smallersample of 150 decreases the marginof error to /- 8%.This report contains the results ofthose analyses deemed to be of mostinterest to facility managers withinthe health care sector. Operationsand Maintenance Benchmarks forHealth Care Facilities is a self-reportsurvey. All data, including respondentidentification, was voluntary. As withany research, readers should exercisecaution when generalizing resultsand take individual circumstancesand experiences into considerationwhen making decisions based onthese data. While IFMA is confidentin its research, it is important to8Operations and Maintenance Benchmarks for Health Care Facilities Report IFMA 2010
IntroductionDefinitions forOperations andMaintenanceBenchmarks forHealth Care FacilitiesReportAdjusted Patient DaysThis figure is used as a way tostandardize the per unit measurebetween hospitals allowing formore valid comparisons. Adjustedpatient days is calculated by dividingtotal charges by inpatient charges,then multiplied by the number ofinpatient days and admissions.(Gross Revenue/Inpatient Revenue) xInpatient Patient DaysAdjusted DischargesAdjusted discharges is a calculationthat adjusts the number of discharges(hospitalizations) to reflect the impactof both inpatient and outpatientvolume. The formula is as follows:(Total Gross Revenue/Inpatient GrossRevenue) x Discharges (or days).For this report, we used adjusteddischarges as a means to comparecosts.AHUAir Handling Unit (AHU) - a deviceused to condition and circulate air aspart of a heating, ventilating, and airconditioning system.AverageAverage is also referred to asthe mean – the sum or total of allresponses divided by the number ofrespondents.BASBuilding Automation System (BAS)use computer-based monitoring tocoordinate, organize and optimizebuilding control sub-systems such assecurity, fire/life safety, elevators, etc.CADComputer-aided design (CAD) is theuse of computer technology to aid inthe design and especially the drafting(technical drawing and engineeringdrawing) of a part or product,including entire buildings. It is botha visual (or drawing) and symbolbased method of communicationwhose conventions are particular to aspecific technical field.CAFMComputer Aided Facility Management(software application)CAM chargesCommon Area Maintenance chargesare the amounts charged to tenantsfor expenses to maintain hallways,restrooms, parking lots, and othercommon areas.CMMSComputerized Maintenance andManagement System (softwareapplication)Central Mechanical PlantA plant that is owned by, and on thegrounds of, a multi-building facilitythat provides district heating, districtcooling, or electricity to one or morebuildings on the same facility. Thecentral physical plant may be byitself in a separate building or maybe located in a building where otheractivities occur.Climate ZonesThe U.S. Department of Energy’sEnergy Information Administrationissues a Commercial BuildingsEnergy Consumption Survey (CBECS)every few years which includes fiveclimate zones based on its 30-yearaverage heating degree-days (HDD)and cooling degree-days (CDD)for the period 1971 through 2000.Designation of a climate zone servesas an indicator of heating and aircondition use.HeatingDegree Days(HDD)ClimateZoneCooling DegreeDays (CDD)12,000 More than7,00022,000 5,500 to 7,00032,000 4,000 to 5,49942,000 4,000 52,000 or More4,000 Natural Resources Canada’s Office ofEnergy Efficiency (OEE) regionalizesCanada into four climate zones.These four zones are based upon anaverage number of heating degreedays over a 30-year period.Climate ZoneHeating DegreeDays (HDD)1 35002 3500 to 55003 5500 to 80004 8000Cooling Degree-Day (CDD)A measure of how warm a locationis over a period of time relative to abase temperature, most commonlyspecified as 65 Fahrenheit. Themeasure is computed for each dayby subtracting the base temperature(65 ) from the average of the day’shigh and low temperatures, withnegative values set equal to zero.Each day’s cooling degree-days aresummed to create a cooling degreeday measure for a specified referenceperiod. Cooling degree-days are usedin energy analysis as an indicator ofair conditioning energy requirementsor use. (Department of Energy,Energy Information Administration)Cost of OperationsAnnual cost of operation includesthe total costs associated with theday-to-day operation of a facility. ItOperations and Maintenance Benchmarks for Health Care Facilities Report IFMA 20109
Introductionincludes all maintenance and repaircosts (both fixed and variable),administrative costs (clerical, timekeeping, general supervision), laborcosts, janitorial, housekeeping andother cleaning costs, utility costs andindirect costs, i.e. all costs associatedwith roadways and grounds.Current ReplacementValueCurrent replacement value is definedas the total amount of expenditurein current dollars required to replacethe organization’s facilities to itsoptimal condition (excluding auxiliaryfacilities). It should include the fullreplacement cost for all buildings,grounds, utility systems, andgenerating plants. Furthermore, itshould meet the current acceptablestandards of construction andcomply with regulatory requirements.Insurance replacement values orbook values should not be used.Current replacement value does notinclude cost of contents.Deferred MaintenanceDeferred maintenance is definedas the total dollar amount ofexisting major maintenance repairsand replacements identified by acomprehensive facilities conditionaudit of buildings, grounds, fixedequipment, and infrastructure needs.This estimate should not includeprojected maintenance, replacementor other types of work, such asprogram improvements or newconstruction, for these items areconsidered capital projects.Exterior Gross AreaThe area of the floor measured to theoutside face of the walls that enclosethe floor(s) of the building. (ASTME1836-08)10Facility Operating CurrentReplacement Value (CRV)IndexThis indicator represents the level offunding provided for the stewardshipresponsibility of an organization’scapital assets. The indicator isexpressed as a ratio of annual facilitymaintenance operating expenditureto Current Replacement Value (CRV).(Asset Lifecycle Model for Total Costof Ownership Management, 2005)Facility ManagementFacility management is a professionthat encompasses multiple disciplinesto ensure functionality of the builtenvironment by integrating people,place process and technology.Fuel OilA liquid petroleum product used asan energy source that is less volatilethan gasoline. Fuel oil includesdistillate fuel oil (Nos. 1, 2, and 4), butthis study requested consumption offuel oil #2.Full-time EquivalentA full-time equivalent is ameasurement that standardizesthe mix of part-time and full-timeemployees within a fiscal year. Themeasurement reflects the number ofpeople necessary in terms of full-timestatus by dividing the total numberof paid hours in a year by a factor of2,080 hours.Gross Square Foot (GSF)Basis used for most calculations usedin this report.Heating Degree-Day (HDD)USA: A measure of how cold alocation is over a period of timerelative to a base temperature,most commonly specified as 65 Fahrenheit. The measure is computedfor each day by subtracting theaverage of the day’s high andOperations and Maintenance Benchmarks for Health Care Facilities Report IFMA 2010low temperatures from the basetemperature (65 ), with negativevalues set equal to zero. Each day’sheating degree-days are summed tocreate a heating degree-day measurefor a specified reference period.Heating degree-days are used inenergy analysis as an indicator ofspace heating energy requirements oruse. (Department of Energy, EnergyInformation Administration)Canada: A measure of the severityof the weather. One degree dayis counted for every degree thatthe average daily temperature isbelow the base temperature of 18 Celsius. For example, if the averagetemperature on a particular day was12 Celsius, six degree days wouldbe credited to that day. The annualtotal is calculated by simply addingthe daily totals. (Natural ResourceCanada, Office of Energy Efficiency)Interior Parking SpaceThe space used for vehicular parkingspace that is totally enclosed withinthe (occupied) building envelope.Kilowatt hour (kWh)A unit of work or energy, measuredas 1 kilowatt (1,000 watts) of powerexpended for 1 hour. One kWh isequivalent to 3,412 Btus.Major VerticalPenetrationsMajor vertical penetrations includestairs, elevator shafts, utility tunnels,flues, pipe shafts, vertical ducts andtheir enclosing walls.MeanSee definition for average. Mean andaverage are used interchangeablyand the interpretation is the same.MedianThe middle value in a range ofresponses is the median. One-halfof all respondents will be below this
Introductionvalue, while one-half will have ahigher value. The median is alsoknown as the 50th percentile. Theadvantage in using the median isthat it is not affected as much byextreme highs or lows in the rangeof values as is the case with themean.NN is the number of cases supplyingthe data being described. It isimportant to note the size of thesample for the value you arecomparing.PercentileIndicates dispersion of data and aspecific percentile identifies wherea value lies in relation to othervalues in a range of responses. The25th percentile is the lower onefourth point in the range of valuesin the group. The 50th percentile,also referred to as the median,represents a value of which onehalf of the group falls below andone-half falls above. The median isnot affected by extreme high or lowvalues whereas the mean could bedistorted.Planned Gross AreaThe portion of the floor that is totallyenclosed within the interior face ofperimeter encroachments at thefloor plane and where there are noperimeter encroachments enclosedat the inside finished surfaceof the exterior walls. To obtainplannable gross area, one wouldsubtract exterior gross to dominantportion, excluded areas, interstitialareas, restricted headroom areas,interior parking and perimeterencroachments from Exterior GrossArea. (ASTM 1836-08)Preventive MaintenancePlanned actions undertaken toretain an item at a specified level ofperformance by providing repetitivescheduled tasks which prolongsystem operation and a useful life;i.e. inspection, cleaning, lubrication,part replacement. (Cotts, Lee, 1992)Site PopulationThe number of full- and part-timeemployees, contract workers and/ortenants located at the facility(ies).Stationary EngineersStationary engineers (also calledlicensed engineers) are licensedpersonnel assigned to operate apower plant including the steamand hot water boilers or a chilledwater plant. Some states andmunicipalities require licensedengineers watch 24 hours, sevendays per week. Further, theseindividuals are not allowed toleave the power plant to performmaintenance outside the powerplant.Repair MaintenanceWork that is performed to putequipment back in service aftera failure, to extend life of theequipment, or to make its operationmore efficient. (Armstrong, 1996)Operations and Maintenance Benchmarks for Health Care Facilities Report IFMA 201011
Section 1Facility DescriptionIndustries RepresentedFacility DescriptionLocation of HospitalHospitals by RegionClimate Zones for the United States. and CanadaFacility AgeFacility SettingOwnershipDeveloped AcresDays and Hours of OperationsCentral PlantStaff SizeOperating BudgetFacility SizeAdjusted Patient Days and DischargesSpace per OccupantCustomer Satisfaction
Facility DescriptionInstitutionsRepresentedThe chart below describes the typesof institutions that participated in thisbenchmarking study. With a total of 151hospitals responding to the survey, thedistribution of institutions representedwere skewed toward large acute carehospitals and medical centers.Number ofCases (N)Percentageof SampleAcute CareHospital10167%An institution that is primarily engagedin providing diagnostic and therapeuticservices for medical diagnosis, treatment,and care, by or under the supervision ofphysicians, to injured, disabled, or sickpersons or rehabilitation services forinjured, disabled, or sick persons.BehavioralCare Facility11%An outpatient treatment center forpsychiatric and mental disorders,Alzheimer’s and developmentally disabled.Outpatient and psychiatric counseling forsubstance abuse patients.OutpatientHealthcareCenter11%An outpatient clinic where persons canreceive a wide range of medical servicesincluding diagnostic services, laboratoryservices and imaging.AmbulatorySurgeryCenter11%Any distinct entity that operatesexclusively for the purpose of providingsurgical services to patients not ritical Access Hospitals (CAH) are ruralcommunity hospitals that receive costbased reimbursement.MedicalCenter3221%A large medical complex that providesa comprehensive array of health careservices in both outpatient and A recovery facility oriented toward longterm treatment and training of sick/injuredpersons so they can function in society.Rehabilitation centers specialize betweeneither physical therapy for trauma/strokevictims.InstitutionDefinitionFACILITY DESCRIPTIONFacility DescriptionTo provide a more accuratecomparison of costs and practices,respondents were asked to reporton a single building, preferable thelargest or most active. Half of therespondents were able to do so.The balance reported on campuslocations with an average of sixbuildings and remote locations.Multiple Buildingsin Multiple Locations13%51%36%Single BuildingMultiple Buildingsin One LocationN 151Operations and Maintenance Benchmarks for Health Care Facilities Report IFMA 201013
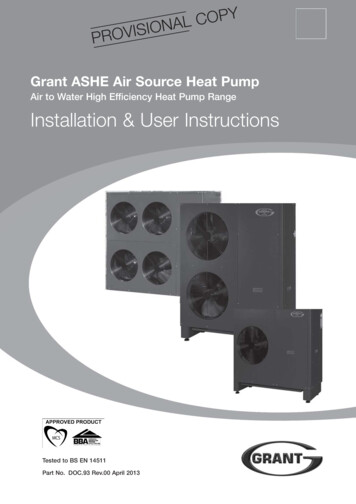
LOCATION OF HOSPITALFacility DescriptionLocation of Hospital000112101301000003830151003 8785140 54 4 56 Washington DC0 25014150 0 2160010073Hospitals by RegionThis report breaks out North Americainto 11 regions. The 10 United Statescategories are based upon postal zipcodes. For example, the region labeledPacific is composed of the five statesin which the zip code begins with thenumber nine.14RegionNPercentage of SampleCanada (AB, BC, MB, ON, QC)75%New England (CT, MA, ME, RI)1510%Northeast (NY, NJ)85%Mid-Atlantic (DC, NC, SC, VA)96%Southeast (FL, GA, TN)96%Midwest (IN, MI, OH)1711%North Central (IA, MN, WI)1711%Heartland (IL, KS, MO)107%South Central (AR, LA, TX)96%Mountain (AZ, CO, WY)96%Pacific (AK, CA, HI, OR, WA)4127%Operations and Maintenance Benchmarks for Health Care Facilities Report IFMA 2010
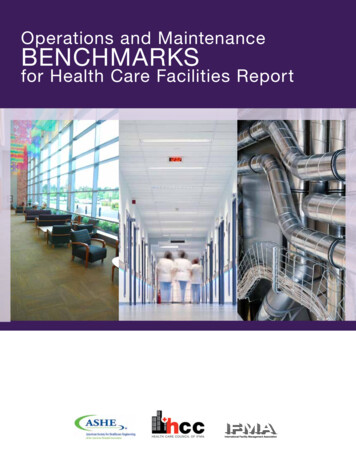
Facility DescriptionCanadaZone 1Zone 2Zone 3Zone 4United StatesZone 1Zone 2Zone 3Zone 4Climate Zones forthe United Statesand CanadaClimate and severe weathershifts can adversely affecthospitals’ energy consumptionand landscaping costs. For thatreason, respondents were asked toselect the climate zone which bestcorresponded to the location of thereported hospital.The U.S. Department of Energy(DOE) classifies the United Statesinto five climate zones which arederived by averaging the number ofannual heating and cooling degreedays in a 30-year period. NaturalResources Canada’s Office ofEnergy Efficiency (OEE) regionalizesCanada into four climate zones.These four zones are based uponan average number of heatingdegree-days over a 30-year period.Zone 5Climate ZoneNNumber of HeatingDegree DaysNumber of CoolingDegree DaysUS 1 (coldest)23More than 7,000Less than 2,000US 2335,500 to 7,000Less than 2,000US 3244,000 to 5,499Less than 2,000US 447Less than 4,000Less than 2,000US 5 (warmest)17Less than 4,0002,000 or MoreCN 1 (coldest)1More than 8,000CN 235,501 to 8,000CN 333,500 to 5,599CN 4 (warmest)0Less than 3,500Operations and Maintenance Benchmarks for Health Care Facilities Report IFMA 201015
Facility DescriptionFacility AgeFacility Age9% 5 years7%5-10 years9%11-15 years7%16-20 years24%21-30 years33%31-50 years11% 50 yearsN 149Facility SettingFacility SettingAcute Care18%38%34%Behavorial Care100%Outpatient Healthcare Center100%Ambulatory Surgery Center100%Critical Access Hospital17%33%Medical Center 6%Rehabiliation Center50%50%38%2% 8%38%37%6%25%N 148Central Secondary SuburbanBusiness DowntownAreaDistrict16Operations and Maintenance Benchmarks for Health Care Facilities Report IFMA 2010IndustrialParkRuralArea
Facility DescriptionOwnershipOwnershipCombination of Owned and LeasedLeased2%11%87%Owner-OccupiedN 151Developed Acres 5 acres5-10 acresIn this report, the annual cost ofmaintaining roads and groundsis derived by dividing cost by thenumber of developed acres.14%20%11-20 acres41%21-50 acres 50 acresDeveloped Acres11%14%N 141Operations and Maintenance Benchmarks for Health Care Facilities Report IFMA 201017
Facility DescriptionDays and Hours ofOperationsAs with most health care institutions,most of the facilities in this studyoperate round the clock and arecooled and heated accordingly. Thereare a few ambulatory and outpatientcenters which close which is why theoverall average is less than 24 for thissample.InstitutionsNHours/DayDays/WeekAcute Care101247Medical Center32247Rehabilitation Center8247Critical Access6247Overall Average15023.86.9Central Mechanical PlantCentral PlantGiven the size and complexity ofthe hospitals represented in thisstudy, it is fitting that 75% of thesample derive power from a centralmechanical plant.25%Decentralized75%CentralizedN 15018Operations and Maintenance Benchmarks for Health Care Facilities Report IFMA 2010
Facility DescriptionNumber of FTEsStaff Size23%More than 3,00020%500 or less16%18%2,001–3,000501–1,000To gauge the size of the facility anddetermine density, respondents wereasked to quantify the number ofoccupants they serve. Site populationincludes the average number of fulltime, part-time and contract workerswho occupy space over a 12-monthperiod.23%1,001–2,000N 107Mean 2,069Range 42–11,500Operating BudgetOperating Budget16%More than 500 million15%Less than 50 million19%36% 200.1 millionto 500 million 50 million to 100 millionMore than half of the hospitalsreport an annual operating budgetexceeding 200 million. This samplereflects either a 2008 or 2009 fiscalyear budget.14% 100.1 millionto 200 millionN 82Operations and Maintenance Benchmarks for Health Care Facilities Report IFMA 201019
Facility SizePlannable Gross AreaPlannable GrossAreaAll of the respondents providearea in square feet, using IFMA’smeasurement for plannable grossarea. To provide uniformity, all of theannual costs reported are divided bythis measurement. Plannable grossarea is the portion of the floor that istotally enclosed within the interior faceof perimeter encroachments at the floorplane and where
The survey was created as an Adobe .pdf interactive form document. In March 2009, IFMA and ASHE members received an e-mail directing them to a link on IFMA's website where they could download the electronic survey. Respondents were asked to provide information on the facilities they manage for a 12-month period of time. Many chose