Transcription
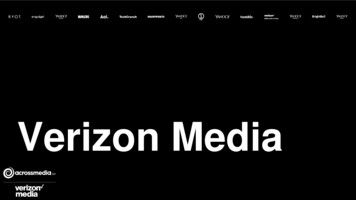
TABLE OF CONTENTSEXECUTIVE SUMMARY1MACRO TRENDS2BRAND PAC REGIONAL BENCHMARKS19EMEA REGIONAL BENCHMARKS21LATAM REGIONAL BENCHMARKS23NORTH AMERICA REGIONAL BENCHMARKS25INDUSTRY BENCHMARKS27Data NotesAll data is post-bid unless otherwiseindicated.Unless otherwise noted, year-overyear data ranges and comparisonsspan May-April (e.g., 2020 is May2019-April 2020).Key Definitions:Violation Rates (Fraud/SIVT orBrand Safety): Those impressions –either delivered or blocked – that donot comply with a client’s specifiedsettings.Incident Rates: Delivered (but notblocked) impressions that do notcomply with a client’s specifiedsettings.Block Rates: Blocked impressionsthat do not comply with a client’sspecified settings.
EXECUTIVE SUMMARYDRIVING MEDIA QUALITY& PERFORMANCE WORLDWIDEDoubleVerify’s 2021 Global Insights Report looks at media quality and performance trends from more than a trillion impressions, delivered in 80markets, across 2,100 brands. The 2021 Global Insights Report provides a market-by-market analysis for North America, LATAM, EMEA andAPAC of video and display impressions measured year-over-year (YoY) from May 2020 to April 2021 across desktop and mobile web, mobile appand CTV.The Impact of Verification: Cleaner Supply Chain, Stronger Pre-Bid Programmatic ControlThis year, many of the post-bid quality metrics we measure and benchmark (fraud, viewability and brand safety) are directionally positive –showing improvements in violation rates and demonstrating the impact verification has had on cleaning up the supply chain and the powerof programmatic pre-bid avoidance. As programmatic continues to become the dominant buying modality, global advertisers increasinglyare activating DV’s pre-bid controls to benefit from protection before ads are purchased and to circumvent post-bid blocks or incidents. DV,additionally, works diligently with our platform partners (DSPs and SSPs) to help ensure quality inventory within these marketplaces. Thesemeasures, as evidenced by this report, are bolstering quality throughout the media transaction, eliminating wasted investment, reducing relianceon post-bid controls, such as blocking, and generating trust and transparency across the digital ecosystem.104%Increase in mobile web videoimpression volume#1CTV emerges as the leadingdriver of verified video adimpressions in the USDOUBLEVERIFY GLOBAL INSIGHTS REPORT 20214%66%30%70%Decrease in brand suitabilityviolation rate YoYDecrease in global fraud/SIVTviolation rateAvg displayviewability rateAvg videoviewability rate1
MACRO TRENDSSHIFTS IN THE ADVERTISING LANDSCAPEBefore taking a deeper look into quality and performance metrics, there are several macro trends worth noting. These shifts are fundamentallychanging the advertising ecosystem and influencing everything we see across the core concerns of fraud/SIVT, brand safety and suitability,viewability and performance.Verification Surges on CTV in North AmericaAdvertisers are increasingly focused on premium video inventory. Over the past year, the volume of videoimpressions DV measures has increased 56%. Mobile web, which grew 104% year-over-year, and CTV,which grew 87% year-over-year, are driving this trend.When broken down regionally, mobile video is leading the charge. In APAC, nearly 9 out of 10 videoimpressions measured are served on mobile devices. But CTV is making real inroads. In North America,the growth of programmatic buying on CTV has fueled the demand for verification, as advertisers seektransparency across their media buys. In fact, nearly one-third (29%) of all video ad impressions arenow served on CTV devices in North America, making CTV the leading driver of the region’s verifiedimpressions. We expect this trend to continue as budgets shift from linear TV to digital video.SHARE OF VIDEO IMPRESSIONSBY DEVICE & REGIONCTV31%63%25%Impact of Cookie Deprecation 80% of Internet traffic runs on browsers that areplanning to deprecate cookiesIDFA Limitations 30% Across Apple devicesMeasures Taken to Improve Privacy WillTransform Digital AdvertisingDesktopAPAC23%44%EMEAMobile AppMobile Web28%29%14%28%18%57%25%LATAMNORTHAMERICAPrivacy concerns are not new, but, over the past year,increased privacy regulations, eventual cookie deprecation and IDFA limitations have grabbedheadlines for the impact they will have on targeting and performance measurement.The ad tech industry has responded by exploring new, privacy-friendly solutions that can becorrelated with performance and improving ways to target consumers contextually.See the “Performance” section in this report to get insights into the cookie-free data DV gathersand how this can help advertisers drive efficiency and ROI.DOUBLEVERIFY GLOBAL INSIGHTS REPORT 20212
MACRO TRENDSQuality on Programmatic Buys Now Matches That of Publisher Direct BuysFor several years, the industry has been saying that programmatic advertising has matured. According to eMarketer, U.S. programmatic adspend is set to reach almost 145 billion in 2021. But there’s more to this story than increased spend. The quality of programmatic inventory isimproving. For the first time, the brand suitability and fraud/SIVT violation rates for programmatic and publisher direct buys were nearly identical,with less than a 0.1 percentage pointdifference between them. Just one year ago,BRAND SUITABILITY VIOLATION RATEFRAUD/SIVT VIOLATION RATEthe programmatic brand suitability violationrate was 18% higher than publisher direct, and7.3% -7% YoY1.4% -31% YoYProgrammaticProgrammaticthe programmatic fraud/SIVT violation ratewas 6% higher than publisher direct. When itcomes to viewability, both programmatic and7.4% 10% YoYPublisher DirectPublisher Direct1.4% -26% YoYpublisher direct have improved year-over-year,with publisher direct seeing slightly highervideo viewable rates and programmaticedging out publisher direct on display buys.VIDEO VIEWABLE RATESDISPLAY VIEWABLE RATES66.8% 5% 5%62.4%Publisher DirectProgrammaticPublisher Direct69.7%72.5% 4%Programmatic 2%Why Quality Is Converging Across Programmatic & Publisher DirectProgrammatic and publisher direct were once strongly delineated: programmatic buys meant real-time bidding (RTB) through the openexchange, and publisher direct buys meant filling out an insertion order (IO) with each publisher on a media plan. But, today, private marketplaces(PMPs) and programmatic guaranteed deals (PGs) add flexibility to buys that blur the line between programmatic and publisher direct. It’spossible to now buy from publishers programmatically. So it’s not surprising that quality is converging.DOUBLEVERIFY GLOBAL INSIGHTS REPORT 20213
BRAND SUITABILITYBRAND SUITABILITY VIOLATIONRATES DECLINEFor the first time in the history of this report, post-bid brand suitability violation ratesdecreased. Globally, the violation rate fell 4% year-over-year. This decline is likely dueto continued adoption of pre-bid brand safety solutions, which enable advertisers toavoid unsuitable ad placements before bids – and potential violations – occur. Asadvertisers become increasingly knowledgeable about pre-bid solutions, post-bidbrand suitability violation rates will continue to decline. In fact, from January to April2021, we’ve already seen a 12% decline compared with the calendar year 2020.BRAND SUITABILITY VIOLATION RATEYEAR-OVER-YEAR7.6%6.2%Ultimately, the pandemic made advertisers more aware of the direct relationshipbetween their settings and a publisher’s ability to monetize important newscontent. Many advertisers adjusted their settings and have continued to do so inresponse to evolving news cycles – contributing to an overall reduction in violationsand blocking.Decrease inYoY Violation Rate2017-20182018-20192019-20202020-2021BRAND SUITABILITY VIOLATION RATEPAST YEAR8.5%8.0%7.5%7.0%6.5%May JunJul Aug Sep Oct Nov Dec Jan Feb Mar Apr2020DOUBLEVERIFY GLOBAL INSIGHTS REPORT 20217.3%4%The Role of COVID-192020 was a transformative year in many ways, not the least of which was the globalpandemic. At the start of the pandemic, many advertisers reacted either by blockingnews sites wholesale to avoid controversial topics or added pandemic-relatedcontent to their URL-keyword lists, driving increased block rates. The impact wasfelt by publishers. Subsequently, brands became open to understanding how theycould strike the right balance between protection and scale. As a result of directoutreach and education, DV clients were able to refine brand suitability settings tosupport trusted news publishers without compromising coverage. Following theseefforts, brand suitability violation rates declined from a peak in March 2020 bynearly 30% into April 2020.6.7 %20214
BRAND SUITABILITYBRANDS ADOPT A MORE NUANCED APPROACHTO BRAND SAFETY AND SUITABILITYOver the past several years, the industry has begun to recognize a distinction between brand safety and brand suitability, and brands havealso recognized the need to support trusted publishers, who rely on digital ad revenue to support their content development. Appearing besideobjectionable content such as pornography, terrorism and hate speech poses a reputational risk for almost any brand. Brand suitability, however,is more subjective. What’s suitable for a fashion retailer may not be suitablefor a toy brand — this is especially true when it comes to content such as newsKEYWORD VS. INAPPROPRIATE CONTENTand specific types of lifestyle content.SHARE OF BRAND SUITABILITY VIOLATIONSThe Right Tools for Each SituationBy looking at the share of brand suitability violations by type of violation, wecan understand which tools advertisers are using, and which tools they arerelying upon less frequently. Keyword block lists, which had been a staple inmany brands’ toolkits, are now being used in a more refined manner, whichis driving violation rates down. As a percentage of overall brand suitabilityviolations, keyword violations decreased from 13% to 7% from May 2020 toApril 2021. Language list violations and mobile app-specific violations havealso decreased in share.At the same time that older tools are becoming less used, page exceptionsare becoming a relied upon tool; 20% of all DV clients, and 60% of our top 75clients, use page exceptions. Page exceptions allow an advertiser to overridetheir brand suitability category settings in order to run ads on home pagesand section home pages – unlocking scale for the advertiser and monetizationopportunities for the publisher. These high profile pages are often consideredsafe by advertisers because the page is not focused on a specific articleor topic.Inappropriate Category % of ViolationsKeyword % of anFebMarApr2021The shifts in the tools advertisers are using are likely due to increased education about how best to leverage keywords, inclusion/exclusionlists and exceptions, along with the adoption of more dynamic, semantic-based inappropriate content categories, which do not require manualupdates to maintain.DOUBLEVERIFY GLOBAL INSIGHTS REPORT 20215
BRAND SUITABILITYBRANDS ADOPT A MORE NUANCED APPROACHTO BRAND SAFETY AND SUITABILITYBrand Suitability Framework and Brand Safety FloorIn January 2021, DV introduced Brand Suitability Tiers, which helps brands align protection with the brandsuitability framework and brand safety floor advanced by the American Association of Advertising Agencies(4A’s) and the Global Alliance for Responsible Media (GARM).In general, the top 10 categories avoided by DV clients align with the categories in the GARM recommendedbrand safety floor. The introduction of risk tiers on select categories allows advertisers to tune their settings toalign with safety and suitability preferences in each category – based on the topic and type (e.g., professionalvs. UGC) of content they wish to avoid.Twenty-four percent of DV clients, and 41% of our top 75 clients, have leveraged the newly-released BrandSuitability Tiers to refine the topics and types of content they are comfortable appearing alongside. This givesadvertisers more control to avoid unsuitable content without compromising scale.GROWTH IN ABS IMPRESSION VOLUME STRONGLYCORRELATES WITH DECREASE IN PROGRAMMATIC BLOCK RATEABS ImpressionsProgrammatic Block 3%6.1%6.0%Q3Q4Q12021DOUBLEVERIFY GLOBAL INSIGHTS REPORT 2021Authentic BrandSafety TargetingTop 10 Categories Avoided byDV AdvertisersTiered Categories:Adult & SexualViolenceHate Speech & Cyber BullyingTerrorismCrimeDrug AbuseNon-tiered Categories:PhishingAuthentic Brand Safety (ABS) targeting,which aligns pre- and post-bid settings toSpamhelp advertisers avoid unsuitable inventoryMalwarebefore bidding takes place, saw increasedadoption. Because of this, ABS helpedNot Mapped to Brand Safety Floor:protect more than double the number ofimpressions this past year compared withAd Clutterthe year prior – and it has protected over6.5 times as many ads January-April 2021vs. January-April 2019, as illustrated in the graph to the left. Growth in ABSimpression volume strongly correlates with a decrease in programmaticblock rate and demonstrates how adoption helps drive campaign efficiencyand effectiveness.6
BRAND SUITABILITYBRAND SUITABILITY PROTECTION ON CTVAlthough CTV is now an established channel in U.S. markets and continues to grow around theglobe, brand suitability protection on CTV is nascent. This year, DoubleVerify rolled out inclusion andexclusion lists for CTV, which allow advertisers to measure whether their actual placements matchtheir media plans. To give advertisers the power to create CTV inclusion and exclusion lists at theapp level, DV mapped disparate CTV app naming conventions and identifiers to the IAB standardtaxonomy. On average, there are 15 different app names that map to a single name within the IABframework, so mapping is critical to tracking and reporting on CTV spend.In general, bigger advertisers tend to be early adopters of brand safety and suitability tools. This istrue of DV’s largest advertisers, who are champions of CTV brand suitability. In fact, our top 75 clientsare four times more likely to have adopted inclusion and exclusion lists than other advertisers. Laterthis year, DV plans to roll out additional app-level enhancements and the ability to target or avoid CTVcontent at the programming level.Blocking on CTVTraditionally, blocking unsafe or fraudulent impressions in video environments has beendifficult because video blocking requires a technology standard called VPAID. Unfortunately,VPAID is not widely available and has no coverage in CTV.DV Video Filtering adds an additional layer of protection to video buys, effectively allowingbrands to block brand suitability and fraud/SIVT violations – even on CTV. DV Video Filteringreduces media waste and minimizes brand safety and suitability, fraud/SIVT and out-ofgeo violations. Advertisers using DV Video Filtering have seen a 49% lower brand suitabilityviolation rate than those who have not yet adopted the tool.DOUBLEVERIFY GLOBAL INSIGHTS REPORT 2021DV top clients are4xMore likely to use CTV inclusion/exclusion lists than other advertisers49%Decrease in brand suitability violationrate for advertisers who have adoptedDV Video Filtering7
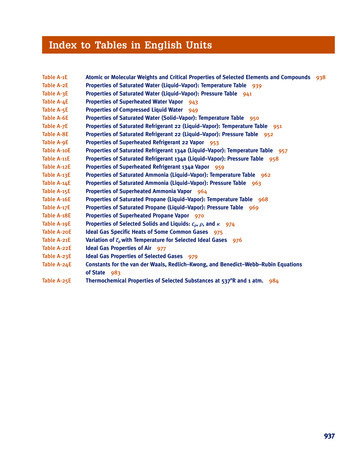
B R A N D S U ITA B I L IT Y: R E G I O N A L S C O R E C A R DVIOLATIONS DECLINESHARPLY IN EMERGINGMARKETSRegionally, the largest reduction in the rate of brand suitability violations came fromemerging digital markets, APAC and LATAM, where violation rates fell by 25% and 26%,respectively. Established markets, EMEA and North America, saw brand suitability violationrates decrease more modestly by 1% and 6%, respectively.In last year’s Global Insights Report, both LATAM and APAC saw year-over-year brandsuitability blocking and incident rate increases of more than 40% and 90%, respectively. Asthese regions grow in their understanding and adoption of brand suitability tools, especiallypre-bid protection, we will continue to see their violation rates align with the levels seen inmore mature markets.BRAND SUITABILITY VIOLATION RATEPrior Year’s Regional BenchmarkAPAC8.5% -25% YoYEMEA9.8% -1% YoYLATAM9.2% -26% YoYNORTHAMERICA6.9% -6% YoYREGIONAL SCORECARDAPACAPAC has the second lowest rate of brandsuitability violations, after a 25% decreaseyear-over-year.EMEAEMEA has the highest brand suitability violationrate, hovering just below 10%. The region sawjust a 1% year-over-year decrease, which was thelowest change globally.LATAMLATAM has the second highest brand suitabilityviolation rate, but with a decrease of 26%year-over-year, the region is on the right track.NORTHAMERICAOverall 2020-2021 BenchmarkNot only does North America have the lowestbrand suitability violation rate, the region iscontinuing to improve with a 6% IFY GLOBAL INSIGHTS REPORT 20218
FRAUD/SIVTGLOBAL FRAUD/SIVT RATES DOWN BY 30%,BUT VOLUME REMAINS STEADYGlobally, post-bid fraud/SIVT violation rates are down 30% year-over-year, from 2.0% to 1.4%. Decreasing fraud/SIVT violation rates is good news,but it doesn’t mean that fraudsters have stopped scheming.DV detects 500,000 new fraudulent device signatures every day, and the overallvolume of fraud/SIVT — meaning the number of schemes we detect and the devices andimpressions those schemes impact — has not meaningfully changed year-over-year.So while the rates of fraud/SIVT violations are down, the overall volume of fraud/SIVTviolations remains consistent.Another trend we’re seeing, however, is that fraud is not scaling at the same rate asthe legitimate marketplace. One reason for this is the increased adoption of pre-bidavoidance solutions and platform certifications that help identify and filter fraud and SIVTbefore it becomes an issue for advertisers. The impact of these measures can be seenacross devices, which all experienced year-over-year violationrate decreases.FRAUD/SIVT VIOLATION RATEMOBILE APP VIDEO 49%1.7%FRAUD/SIVT VIOLATION RATE ACROSS DEVICES(DISPLAY & VIDEO)2.1%-30% YoYDESKTOP1.6%-14% YoYMOBILEAPP0.6%0.4%-37% YoY-12% YoYMOBILEWEBCTVFraud/SIVT Violation Rates by Device and FormatFraud/SIVT violation rates by device are down across the board, led by decreaseson desktop and mobile web. That said, certain pockets of inventory did see anincrease. One of those was mobile app video, with a rise of nearly FY GLOBAL INSIGHTS REPORT 20219
FRAUD/SIVTTHE PROFILE OF FRAUD/SIVT IS CHANGINGFraud/SIVT tactics are constantly evolving. Fraudsters purposely use new tactics to exploit environments such as CTV. Last year, bot fraud madeup 78% of fraud/SIVT violations on CTV. This year, although bot fraud violations on CTV are still the most common type of CTV fraud, they aredown to 44%.The graph below shows how each device is impacted differently by the various types of fraud/SIVT. Data center traffic is a type of SIVT thattargets server-side ad insertion (SSAI) inventory, which is especially common on CTV and audio. With data center traffic, fraudsters may spoofSSAI inventory (e.g., a mobile impression may be made to look like a CTV impression), or the SSAI inventory lacks certain information, potentiallyhiding bad actors.SHARE OF FRAUD/SIVT TYPES ACROSS DEVICESAdware/Malware8%1%Bot FraudSite & App FraudData Center PCTV13%51%77%64%DOUBLEVERIFY GLOBAL INSIGHTS REPORT 202113%15%44%10
FRAUD/SIVTFRAUD/SIVT SCHEME: CTV SPOTLIGHTIncreased protection is one reason that CTV’s average fraud/SIVT violation rate is so low. Each day, the DV Fraud Lab analyzes over 2 billionimpressions and sends 100 updates to our DSP partners with new fraud signatures. Last year alone, we identified over 20 new fraud schemes.On CTV, for example, the DV Fraud Lab identified and neutralized a family of fraud schemes called OctoBot, which targeted CTV and mobile appdevices. As the Fraud Lab shut down one arm of OctoBot, another would emerge. Remaining vigilant in identifying and shutting down new andmutating schemes ensures our clients stay protected wherever they are buying media.2020-2021 Timeline of CTV SchemesCELLOTERRAFAUXTERRA(OctoBot Variant)(OctoBot Variant)Uses mobile appsto run ads in thebackground andfalsify CTV trafficUses CTV apps torun unseen ads in thebackground of contentand falsify trafficNOV 2019MAY 2020MAR 2020JUL 2020OCTOBOTVARIANTUPGRADEDMULTITERRA(OctoBot Variant)Targets mobiledevicesOCT 2020JAN 2021DEC 2020JUL 2020DV announcesongoing OctoBotfamily.MAR 2021FEB ERRA(OctoBot Variant)(OctoBot Variant)(SSAI)(OctoBot Variant)(SSAI)Spoofs over 20times the averageamount of CTVdevices typicallyconnected to asingle IP addressHijacks residentialIP addresses, whichcontain legitimateuser traffic, to hidetheir false trafficmore effectivelySSAI fraud schemespoofs over 1MIPs dailyHijacks realCTV sessionsThe largest SSAI fraudscheme, infects over3.7M daily devicesDOUBLEVERIFY GLOBAL INSIGHTS REPORT 2021OCTOBOTCONTINUESDV blocks newstrain within 24hours after it firststarts operatingAPR 2021OCTOBOTRELATIONSHIPSAfter months ofinvestigation, DVconfirms relationshipbetween the schemesknown as OctoBot11
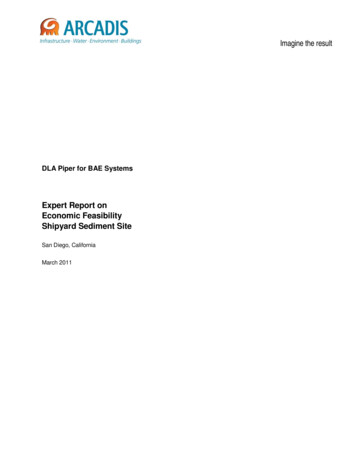
FRAUD/SIVT: REGIONAL SCORECARDPOST-BID FRAUD VIOLATIONRATES DECLINE GLOBALLYPost-bid fraud/SIVT violation rates remained relatively low across the board, with the highestrates coming from North America and EMEA. While these global rates are low, it is useful toremember that much fraud/SIVT is avoided as part of programmatic pre-bid buying. Preventingfraud/SIVT pre-bid helps keep post-bid fraud/SIVT violation rates down.APACAPAC’s fraud/SIVT violation rates saw thesmallest drop year-over-year, but the region alsohas the lowest overall fraud/SIVT violation rate,clocking in at under 1%.EMEAAlthough EMEA has the highest rate of fraud/SIVT violations, rates decreased 19%year-over-year.FRAUD/SIVT VIOLATION RATESPrior year’s regional benchmarkREGIONAL SCORECARDOverall 2020-2021 benchmarkLATAMAPAC0.8% -6% YoYEMEA1.6% -19% YoYLATAM1.1% -29% YoYNORTHAMERICA1.5% -30% YoYFraud/SIVT violation rates decreased by 29%year-over-year, and now LATAM has the secondlowest fraud/SIVT violation rate of just 1.1%.0.9%1.9%Fraud/SIVT violation rates decreased by 30%year-over-year, but at 1.5%, North America isabove the global benchmark.1.6%DOUBLEVERIFY GLOBAL INSIGHTS REPORT 2021NORTHAMERICA2.1%12
VIEWABILITYVIEWABLE RATES RISE,REACHING 70% ACROSS VIDEOViewability continues to improve across all regions and across almost all devices. Generally, video placements are slightly more viewable thandisplay placements. In fact, for the first time in the history of this report, overall video viewability reached 70% — enough to meet the IAB’srecommended target threshold for viewability. All other formats and channels experienced slight upticks, with the exception of mobile app display,which saw a 4% decrease, but still has viewable rates above 70%. Video ads on mobile apps have the highest viewable rates at 77%.DisplayVideo66.4%70.0% 4% YoY 5% YoYVIDEO VIEWABLE RATESDISPLAY VIEWABLE RATESOverall 2020-2021 verall 2020-2021 benchmark 8% YoY-4% YoY 4% YoYDOUBLEVERIFY GLOBAL INSIGHTS REPORT 2021DESKTOPMOBILEAPPMOBILEWEB70.2% 4% YoY77.0%67.7% 1% YoY 5% YoY13
VIEWABILITYSOLUTIONS FOR VIDEO ENHANCEVIEWABILITY MEASUREMENTAdvertiser demand for viewable impressions has helped viewable rates rise steadily year-over-year. High viewable rates are now almost a givenwithin a campaign — and certainly table stakes for advertisers. But just as the Internet can never be completely brand safe or free of fraud, all adscannot be viewable. From page timeouts to a user scrolling too quickly, there are a number of reasons why some ads don’t have the opportunityto be seen, which is why measuring viewability remains critical. And it is particularly challenging to measure viewability onvideo impressions.OM SDK Fueling Video MeasurementHistorically, video has been especially difficult to measure within mobile apps. Strong adoption of the OpenMeasurement (OM) Software Development Kit (SDK) has helped gradually reverse of this trend. As of Q12021, DV saw over 100K OMID-enabled apps. The share of video impressions that supported viewabilitymeasurement increased about 10% year-over-year — driven by mobile app’s supported share morethan doubling.CTV FULLYON-SCREEN RATECTVCOMPLETION RATE93.6%93.2% 100KOMID-enabled mobile appsas of Q1 2021Measuring Visibility on CTVCurrently, it is not possible to measure viewability on CTV devices in the same waywe do on mobile and desktop devices. This is because the measurement technologyused across online video inventory are not supported on CTV.DV, however, offers a proxy for viewability with DV’s Fully On-Screen Measurement,which gives advertisers insight into how long a CTV ad is played, whether all the ad’spixels were displayed on the screen and whether the ad pauses when the TV screenis turned off.Although the average completion and Fully On-Screen rates are quite high in CTV, DVsees varying performance across advertiser buys, making this an important metricfor advertisers to consider.DOUBLEVERIFY GLOBAL INSIGHTS REPORT 202114
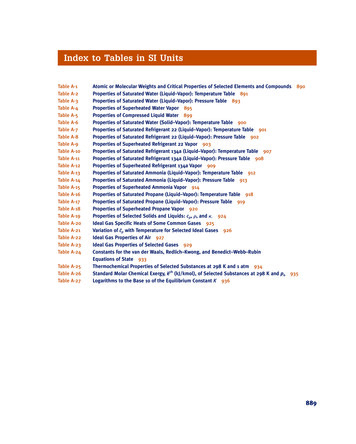
VIEWABILITY: REGIONAL SCORECARDREGIONAL SCORECARDSTRONG GLOBAL RATESSUGGEST VIEWABILITY HASBECOME TABLE STAKESAPACAlthough mobile web drove a 4% increase indisplay viewability year-over-year, APAC stilltrails other regions. APAC also saw a markedimprovement of 12% across video viewabilitythanks to mobile app growth.Continuing a multi-year trend, viewability improved across all regions. This year, emergingmarkets caught up to — and even surpassed — established markets.EMEAOverall, North America experienced the most modest gains, while LATAM showed thestrongest year-over-year increase — and now has the highest display viewable rate. Videoviewability increased for all regions except EMEA, but EMEA still has the second-strongestvideo viewable rate, which is consistently above 70% across all devices. The rest of the worldcontinues outpacing North America in video viewability, as it is the only region still shy of the70% IAB target viewable rate threshold.DISPLAY VIEWABLE RATESAPACEMEA62% 4% YoY64% 7% YoYLATAM70% 9% YoYNORTHAMERICA67% 5% YoYOverall 2020-2021 benchmarkAPAC60%EMEA60%64%64%LATAMNORTHAMERICA74% 12% YoY66%75% -3% YoY77%78% 12% YoY69% 4% YoYDOUBLEVERIFY GLOBAL INSIGHTS REPORT 2021LATAMLATAM’s display viewability is up 9% year-overyear, making it the only region to hit the 70%threshold for display. LATAM’s video viewablerate also increased significantly —12% yearover-year. In fact, all device types in this regionnow exceed 75% video viewability.VIDEO VIEWABLE RATESPrior year’s regional benchmarkDisplay viewable rates increased 7% yearover-year, continuing a steady climb. Althoughvideo viewability decreased 3% year-over-year,EMEA is still well above the IAB threshold forviewability.70%66%NORTHAMERICAIn North America, the region with the highestimpression volume, improvement has sloweddown. After 8% growth last year, the regionexperienced a 5% increase on display and4% increase on video placements this year.Viewability, though, is trending in the rightdirection and solidly higher than just a fewyears ago.15
PERFORMANCEBEYOND VIEWABILITY:ATTENTION METRICS DRIVE OUTCOMESViewability has been one of the primary metrics advertisers use to determine how their ads are performing. Increasingly, however,metrics that indicate attention from the user, such as time-in-view, audibility and other exposure and engagement indicators, are givingadvertisers deeper insights into the efficacy of their ad campaigns and allowing advertisers to optimize toward desired outcomes.DV Authentic Attention is a cookie-free, privacy-friendly way to measure impact through engagement(how a user interacts with an ad) and exposure (how an ad is positioned on a page). The technologybehind DV Authentic Attention builds on the foundation of quality laid out by the DV Authentic Ad ,an MRC-accredited metric that provides a baseline of quality. To be considered Authentic, an ad mustbe viewable, free of fraud and serve in a brand safe environment in the intended geo. Once this baselineof quality is established, DV Authentic Attention overlays 50 data points to provide deep impressionlevel insights that are actionable across marketing goals.One of the 50 data points DV Authentic Attention looks at for display ads is the length of time an ad isviewed. On video impressions, the equivalent measure is video completion and audible rates by quartile. Thefollowing analyses outline key trends we’re seeing across these two data points.DISPLAY: TIME IN VIEWWITH PERCENT CHANGEYEAR-OVER-YEAR 14%18.7sDisplay Exposure Metric: How Long Are Display Ads Viewed? 20%From 2020 to 2021, average time-in-view increased across devices. Last year, mobile app was bottom of thepack when it came to time-in-view, but now, mobile app and mobile web are almost at parity. On mobile app,the time someone sees an ad actually improved by 20% year-over-year.14.3sDESKTOPDOUBLEVERIFY GLOBAL INSIGHTS REPORT 2021MOBILEAPP 9%14.9sMOBILEWEB16
PERFORMANCEVideo Exposure Metrics: How Long Are VideoAds Seen and Heard?Completion rates across devices (excluding CTV) are fairly consistent,with similar drop-off between quartiles occurring across desktop, mobileapp and mobile web. Overall, desktop outperforms mobile devices with a71% completion rate versus 66% for mobile app and 60% for mobile web.Audibility, which is a challenging threshold to meet, changes this story.Fewer than 15% of all video ads are audible and in-view on completion(AVOC). But mobile app significantly outperforms other environmentson AVOC because of the substantially higher audible rate. Audible ratesat the fourth quartile for desktop and mo
VIEWABILITY PERFORMANCE APAC REGIONAL BENCHMARKS EMEA REGIONAL BENCHMARKS LATAM REGIONAL BENCHMARKS NORTH AMERICA REGIONAL BENCHMARKS INDUSTRY BENCHMARKS 1 2 4 9 13 16 19 21 23 25 27 Data Notes All data is post-bid unless otherwise indicated. Unless otherwise noted, year-over-year data ranges and comparisons span May-April (e.g., 2020 is May .