Transcription
FINANCIAL &OPERATINGBENCHMARKSSean Fanning & Kyle PoyarView the interactive report here.
TAB LE O F CO NT ENT SIIIIIIIVIntroductionParticipant OverviewExecutive SummaryFinancial &Operating InsightsVVIVIIVIIIProduct-LedGrowth InsightsGo-to-Market InsightsCash Flow InsightsTalent Insightsov 2021 FINANCIAL & OPERATING BENCHMARKSProprietary 2021 OpenView Advisors, LLC. All Rights Reserved2
I.IntroductionObjective data is critical to making the right strategicdecisions that can propel your long-term growth. Forthis reason, we’re releasing the results of our fifthannual Financial & Operating Benchmarks survey(formerly known as the SaaS Benchmarks Survey). Thisreport was designed specifically to enable operatorsto compare themselves against their exact peersacross the metrics that matter most in a SaaS business.This year’s survey was live from May to September.The 2021 report incorporates data from more than2,400 respondents aggregated across prior surveysas well as almost 600 this year alone.ov 2021 FINANCIAL & OPERATING BENCHMARKSOur data revealed surprising insights about the cashflow dynamics in SaaS companies, what investors arerewarding in company performance, the prevalenceof product-led growth, how to position for success ina fundraise as well as fundraising trends.We’ve also covered many of our usual favorite topicsranging from the key SaaS value drivers, pricingmodels, progress on executive diversity and muchmore. This document details the “nitty gritty” results ofour benchmarks survey to provide insight into rangesof performance across various metrics.Proprietary 2021 OpenView Advisors, LLC. All Rights Reserved3
THANKS TO OURSPONSORS & PARTNERSov 2021 FINANCIAL & OPERATING BENCHMARKSProprietary 2021 OpenView Advisors, LLC. All Rights Reserved4
II.PARTICIPANTOVERVIEW
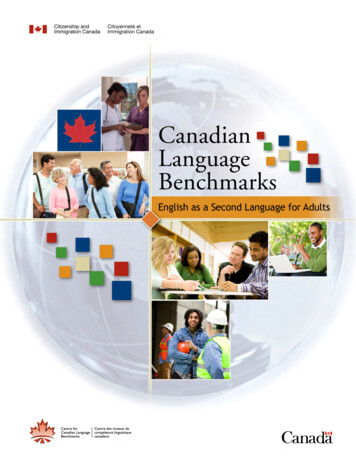
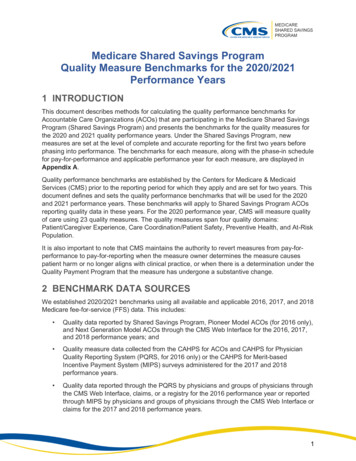
Distribution25% 1M14%18%23% 2.5M-10MBy ARR7%13% 10-20M 1-2.5M 20-50M 50MSource: 2021 OpenView Financial & Operating Metrics Survey, N rov 2021 FINANCIAL & OPERATING BENCHMARKSProprietary 2021 OpenView Advisors, LLC. All Rights Reserved6
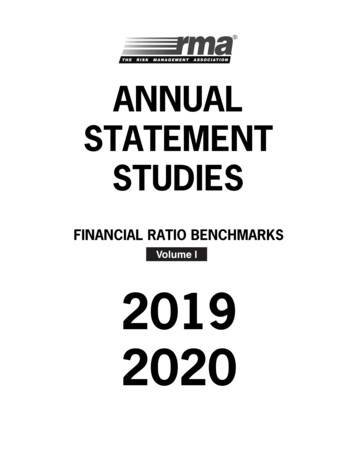
Source: 2021 OpenView Financial & Operating MetricsSurvey, N 225.Distribution50%30%7%6%CEO / Founder / Co-FounderCOO / VP of Operations3%CRO / VP of SalesEnterprise( 1,000 employees)7%Very small business(VSB, 20 employees)ByrespondentroleOther4%36%CFO / VP of FinanceCMO / VP of Marketing34%Midmarket(101-1,000 employees)2%Consumerov 2021 FINANCIAL & OPERATING BENCHMARKS21%SMB(20-100 employees)BytargetcustomersizeProprietary 2021 OpenView Advisors, LLC. All Rights Reserved7
III.EXECUTIVESUMMARYov 2021 FINANCIAL & OPERATING BENCHMARKSProprietary 2021 OpenView Advisors, LLC. All Rights Reserved8
HOW TO USE THESEBENCHMARKSWe often get asked:“How do I use these benchmarks, isn’t faster andcheaper always better?” Our answer: it depends.The focus should be on the qualitative: stage of business, state ofthe market, customer base, and what is right for the business'stakeholders (employees, customers, etc.) and its shareholders.Operationalizing benchmarks is part science, part art – not justwhere is everyone else, but also: “what makes sense for me?”ov 2021 FINANCIAL & OPERATING BENCHMARKSProprietary 2021 OpenView Advisors, LLC. All Rights Reserved9
Here are 4 tips we offer for using benchmarks:12Benchmarks are the map,not the territory:Use financial & operating benchmarksonly as a map for “acceptable ranges,”at any point in time that will eventuallyenable your business to generaterepeatable and predictable free cashflow in the future.Performance and valuation area multivariate equation:Growth is a function of investment insales and product which is a function ofgrowth and so on ov 2021 FINANCIAL & OPERATING BENCHMARKS34Sound strategy involves tradeoffs:See above. Sometimes sacrificingefficiency for growth is necessary to winthe short term or unlock the next roundof financing.Let shareholders’ risk / returnexpectation act as a guide:Different investors have different tastesfor risk and return; know what your“dream investor” looks like so you canoptimize performance vs. benchmarksthat align with their “taste.”Proprietary 2021 OpenView Advisors, LLC. All Rights Reserved10
Company performance benchmarksSIZE AND GROWTHEmployeesNumber of full-time equivalent employees at the end of Q1 2021.FundingAmount of equity capital raised to date.Annual Recurring Revenue (ARR)Company annual recurring revenue (ARR) scale at the end of Q1 2021.YoY Growth RateChange in annual recurring revenue at the end of Q1 2021 vs. Q1 2020.FINANCIALSales & Marketing SpendSpending on Sales & Marketing, including headcount, as a % of ending ARR as of Q1 2021.R&D SpendSpending on R&D, including headcount, as a % of ending ARR as of Q1 2021.Gross MarginsSubscription revenue less cost of goods sold divided by subscription revenue at the end of Q1 2021.Monthly Burn Rate (in 000’s)Net monthly operating cash burn rate at the end of Q1 2021 (total lost each month, negative values profit).SAAS VALUE DRIVERSCAC Payback (months)Months of subscription gross margin to recover the fully loaded cost of acquiring a customer.Gross Dollar RetentionAnnual gross dollar retention (after churn, exclusive of upsells & expansion) seen in cohorts.Net Dollar RetentionAnnual net dollar retention (after churn, inclusive of upsells & expansion) seen in cohorts.DIVERSITYWomen in Leadership% of female representation among employees Director-level and above.Underrepresented Minorities in Leadership% of underrepresented minority representation among employees Director-level and above.ov 2021 FINANCIAL & OPERATING BENCHMARKSProprietary 2021 OpenView Advisors, LLC. All Rights Reserved11
How to read these slides 1M 1-2.5M 2.5M-10M 10-20M 20-50M 50M18 (5-18)38 (18-38)76 (38-76)151 (76-151)151 (151-351)351 (351-463)100% (26-300%)90% (45-300%)50% (30-100%)50% (20-75%)33% (25-49%)30% (10-56%)25% (6-50%)30% (13-40%)32% (20-49%)34% (15-44%)35% (25-44%)50% (19-61%)R&D Spend50% (30-80%)40% (30-65%)34% (25-55%)39% (20-50%)25% (20-45%)30% (22-39%)Gross Margins67% (24-83%)75% (58-84%)(68-83%) KPIs75%across(62-85%)Rowsrepresent76%common80% (75-83%)79% (70-87%)Monthly Burn Rate ( in 000s) 50 (50-175) 50 (0-375) 375 (50-500) 375growth,(144-875)categoriesincludingsize and 375 (0-1250) 25 (0-1625)SIZE AND GROWTHEmployeesYoY Growth RateFINANCIALSales & Marketing SpendSAAS VALUE DRIVERSCAC Payback (months)8 (2-11)Gross Dollar Retention98% (90-100%)Net Dollar Retentionfinancial, value drivers, and diversity8 (5-15)15 (8-15)15 (11-15)18 (12-21)15 (10-17)96% (90-100%)95% (82-98%)84% (73-92%)90% (85-95%)85% (64-90%)100% (93-110%) 100% (94-110%) 106% (96-120%) 103% (86-113%) 105% (100-110%) 105% (95-120%)DIVERSITYWomen in Leadership15% (0-30%)25% (5-40%)25% (13-45%)30% (23-40%)30% (19-41%)28% (11-44%)Underrepresented Minorities in Leadership0% (0-25%)0% (0-44%)0% (0-20%)2% (0-20%)5% (0-14%)9% (5-26%)Source: 2021 OpenView Financial & Operating Metrics Survey, N 225.ov 2021 FINANCIAL & OPERATING BENCHMARKSProprietary 2021 OpenView Advisors, LLC. All Rights Reserved12
How to read these slides 1M 1-2.5M 2.5M-10M 10-20M 20-50M 50M18 (5-18)38 (18-38)76 (38-76)151 (76-151)151 (151-351)351 (351-463)100% (26-300%)90% (45-300%)50% (30-100%)50% (20-75%)33% (25-49%)30% (10-56%)of35% (25-44%)50% (19-61%)SIZE AND GROWTHEmployeesYoY Growth RateFINANCIAL25% (6-50%)Sales & Marketing Spend30% ributionR&D Spend50% (30-80%)40% (30-65%)34% (25-55%)39% (20-50%)25% (20-45%)30% (22-39%)Gross Margins67% (24-83%)75% (58-84%)76% (68-83%)75% (62-85%)80% (75-83%)79% (70-87%)Monthly Burn Rate ( in 000s) 50 (50-175)responses from companies at varyinglevels 375of (50-500)ARR, from 1M to 50M 50 (0-375) 375 (144-875) 375 (0-1250) 25 (0-1625)SAAS VALUE DRIVERSCAC Payback (months)8 (2-11)8 (5-15)15 (8-15)15 (11-15)18 (12-21)15 (10-17)Gross Dollar Retention98% (90-100%)96% (90-100%)95% (82-98%)84% (73-92%)90% (85-95%)85% (64-90%)Net Dollar Retention100% (93-110%) 100% (94-110%) 106% (96-120%) 103% (86-113%) 105% (100-110%) 105% (95-120%)DIVERSITYWomen in Leadership15% (0-30%)25% (5-40%)25% (13-45%)30% (23-40%)30% (19-41%)28% (11-44%)Underrepresented Minorities in Leadership0% (0-25%)0% (0-44%)0% (0-20%)2% (0-20%)5% (0-14%)9% (5-26%)Source: 2021 OpenView Financial & Operating Metrics Survey, N 225.ov 2021 FINANCIAL & OPERATING BENCHMARKSProprietary 2021 OpenView Advisors, LLC. All Rights Reserved13
How to read these slides 1M 1-2.5M 2.5M-10M 10-20M 20-50M 50M18 (5-18)38 (18-38)76 (38-76)151 (76-151)151 (151-351)351 (351-463)100% (26-300%)90% (45-300%)50% (30-100%)50% (20-75%)33% (25-49%)30% (10-56%)25% (6-50%)30% (13-40%)32% (20-49%)34% (15-44%)35% (25-44%)50% (19-61%)R&D Spend50% (30-80%)40% (30-65%)34% (25-55%)39% (20-50%)25% (20-45%)30% (22-39%)Gross Margins67% (24-83%)75% (58-84%)76% (68-83%)75% (62-85%)80% (75-83%)79% (70-87%)Monthly Burn Rate ( in 000s) 50 (50-175) 50 (0-375) 375 (50-500) 375 (144-875) 375 (0-1250) 25 (0-1625)SIZE AND GROWTHEmployeesYoY Growth RateFINANCIALSales & Marketing SpendSAAS VALUE DRIVERSEach cell represents the medianperformance of a company, as well astherange (bottomtop quartile)of8 (5-15)15 (8-15) quartile15 –(11-15)18 (12-21)CAC Payback (months)8 (2-11)Gross Dollar Retention98% (90-100%)96% (90-100%)100% (93-110%)100% (94-110%)106% (96-120%)103% (86-113%)105% (100-110%)105% (95-120%)Women in Leadership15% (0-30%)25% (5-40%)25% (13-45%)30% (23-40%)30% (19-41%)28% (11-44%)Underrepresented Minorities in Leadership0% (0-25%)0% (0-44%)0% (0-20%)2% (0-20%)5% (0-14%)9% (5-26%)Net Dollar Retention84% (73-92%)90% (85-95%)each metric95%at (82-98%)each respectiveARR scale15 (10-17)85% (64-90%)DIVERSITYSource: 2021 OpenView Financial & Operating Metrics Survey, N 225.ov 2021 FINANCIAL & OPERATING BENCHMARKSProprietary 2021 OpenView Advisors, LLC. All Rights Reserved14
Financial & operating metrics by ARR 1M 1-2.5M 2.5M-10M 10-20M 20-50M 50M18 (5-18)38 (18-38)76 (38-76)151 (76-151)151 (151-351)351 (351-463)100% (26-300%)90% (45-300%)50% (30-100%)50% (20-75%)35% (25-49%)30% (10-56%)25% (6-50%)30% (13-40%)32% (20-49%)34% (15-44%)35% (25-44%)50% (19-61%)R&D Spend50% (30-80%)40% (30-65%)34% (25-55%)39% (20-50%)25% (20-45%)30% (22-39%)Gross Margins67% (24-83%)75% (58-84%)76% (68-83%)75% (62-85%)80% (75-83%)79% (70-87%)Monthly Burn Rate ( in 000s) 50 (50-175) 50 (0-375) 375 (50-500) 375 (144-875) 375 (0-1250) 25 (0-1625)CAC Payback (months)8 (2-11)8 (5-15)15 (8-15)15 (11-15)18 (12-21)15 (10-17)Gross Dollar Retention98% (90-100%)96% (90-100%)95% (82-98%)84% (73-92%)90% (85-95%)85% (64-90%)SIZE AND GROWTHEmployeesYoY Growth RateFINANCIALSales & Marketing SpendSAAS VALUE DRIVERSNet Dollar Retention100% (93-110%) 100% (94-110%) 106% (96-120%) 103% (86-113%) 105% (100-110%) 105% (95-120%)DIVERSITYWomen in Leadership15% (0-30%)25% (5-40%)25% (13-45%)30% (23-40%)30% (19-41%)28% (11-44%)Underrepresented Minorities in Leadership0% (0-25%)0% (0-44%)0% (0-20%)2% (0-20%)5% (0-14%)9% (5-26%)Source: 2021 OpenView Financial & Operating Metrics Survey, N 225.ov 2021 FINANCIAL & OPERATING BENCHMARKSProprietary 2021 OpenView Advisors, LLC. All Rights Reserved15
Financial & operating metrics by ARR ( 2 0 2 1vs. 2020) 1M 1-2.5M 2.5M-10M 10-20M 20-50M 50M18 ( 8)38 ( 13)76 ( 24)151 ( 58)151 ( 69)351 ( 144)100% (0%)90% ( 30%)50% ( 9%)50% ( 4%)35% ( 15%)30% ( 9%)25% ( 5%)30% (0%)32% ( 2%)34% ( 1%)35% ( 4%)50% ( 21%)50% ( 18%)40% (0%)34% ( 2%)39% ( 11%)25% ( 2%)30% ( 8%)Gross Margins67% (0%)75% (0%)76% ( 2%)75% ( 4%)80% ( 1%)79% ( 4%)Monthly Burn Rate ( in 000s) 50 ( 0) 50 ( 0) 375 ( 200) 375 ( 200) 375 ( 0) 25 ( 25)CAC Payback (months)8 (0)8 ( 2)15 ( 4)15 ( 4)18 ( 3)15 (0)Gross Dollar Retention98% ( 8%)96% ( 6%)95% ( 5%)84% ( 3%)90% ( 3%)85% ( 5%)100% ( 1%)100% (0%)106% ( 3%)103% ( 1%)105% (0%)105% (0%)15% ( 5%)25% ( 5%)25% (0%)30% ( 1%)30% ( 10%)28% ( 13%)0% (0%)0% (0%)0% (0%)2% ( 2%)5% (0%)9% ( 4%)SIZE AND GROWTHEmployeesYoY Growth RateFINANCIALSales & Marketing SpendR&D SpendSAAS VALUE DRIVERSNet Dollar RetentionDIVERSITYWomen in LeadershipUnderrepresented Minorities in LeadershipSource: 2021 OpenView Financial & Operating Metrics Survey, N 225.ov 2021 FINANCIAL & OPERATING BENCHMARKSProprietary 2021 OpenView Advisors, LLC. All Rights Reserved16
Financial & operating metrics by most recent fundingAngel / SeedSeries ASeries BSeries CSeries D 18 (8-38)76 (38-151)151 (76-151)151 (76-251)351 (351-351) 3M ( 0.5-3M) 15M ( 8-15M) 43M ( 28-63M) 63M ( 43-63M) 88M ( 43-100M)Annual Recurring Revenue (ARR) 2M ( 0.5- 2M) 6M ( 2-6M) 15M ( 6-15M) 15M ( 6-35M) 50M ( 35-50M)YoY Growth Rate100% (41-304%)60% (35-193%)65% (29-121%)35% (23-47%)43% (13-50%)Sales & Marketing Spend28% (10-40%)33% (20-50%)33% (20-44%)39% (25-66%)42% (25-60%)R&D Spend40% (25-70%)40% (26-56%)30% (18-50%)38% (26-55%)35% (20-46%)Gross Margins70% (49-82%)78% (68-85%)78% (70-85%)80% (73-83%)78% (68-88%)Monthly Burn Rate ( in 000s) 50 (50-175) 375 (50-625) 375 (175-1250) 375 (175-1,094) 275 (0-1250)CAC Payback (months)8 (3-15)15 (8-21)15 (11-17)15 (12-28)15 (15-21)Gross Dollar Retention97% (91-100%)93% (81-98%)90% (80-97%)88% (82-92%)85% (77-92%)100% (97-120%)102% (88-110%)106% (99-125%)104% (100-108%)95% (91-118%)20% (0-40%)25% (9-37%)30% (20-50%)28% (20-40%)19% (10-40%)0% (0-50%)0% (0-20%)3% (0-20%)5% (0-14%)9% (0-20%)SIZE AND GROWTHEmployeesFundingFINANCIALSAAS VALUE DRIVERSNet Dollar RetentionDIVERSITYWomen in LeadershipUnderrepresented Minorities in LeadershipSource: 2021 OpenView Financial & Operating Metrics Survey, N 225.ov 2021 FINANCIAL & OPERATING BENCHMARKSProprietary 2021 OpenView Advisors, LLC. All Rights Reserved17
IV.FINANCIAL & OPERATINGINSIGHTSov 2021 FINANCIAL & OPERATING BENCHMARKSProprietary 2021 OpenView Advisors, LLC. All Rights Reserved18
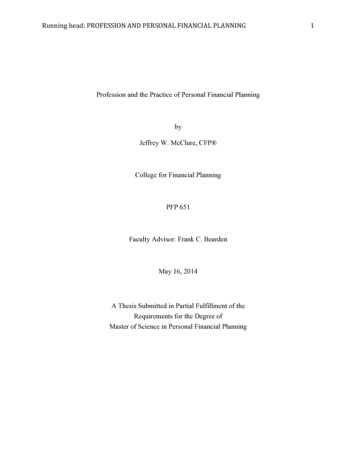
GROSS MARGIN ONSUBSCRIPTION REVENUE16%15%13%13%19%14% 50%70 to 75%80 to 85%50 to 70%75 to 80%Gross margin onsubscriptionrevenuedistributionGross margin is a key and oftenoverlooked lever in any business – 7/10companies surveyed have gross marginsin excess of 70%. Best-in-class companiesacross all ARR scales see gross margins ofat least 80%.As a reminder, gross margin shouldalways include hosting, as well as anyservices and customer onboarding costs.85 to 90%11% 90%Source: 2021 OpenView Financial & Operating Metrics Survey, N 225.ov 2021 FINANCIAL & OPERATING BENCHMARKSProprietary 2021 OpenView Advisors, LLC. All Rights Reserved19
GROSS DOLLARRETENTION RATESTop tier gross retention rates areconsistently 85-90% regardless of lastround or ARR scale.8% 60%4%70 to 80%5%60 to 70%20%80 to 90%63% 90%Gross dollarretention rates(annual)Similarly, these rates are consistentregardless of bull or bear marketconditions. This year we saw a reductionin the percentage of respondents in thelower GDR tiers (besides 60-70%, whichremained flat) and a 10% increase incompanies reporting GDR 90%.Outstanding gross dollar retentionremains “table stakes” in enterprise SaaS.Source: 2021 OpenView Financial & Operating Metrics Survey, N 225.ov 2021 FINANCIAL & OPERATING BENCHMARKSProprietary 2021 OpenView Advisors, LLC. All Rights Reserved20
NET DOLLARRETENTION RATES13% 85%13%95 to 100%21%105 to 115%7%125 to 135%10%85 to 95%18%100 to 105%11%115 to 125%7% 135%Net dollarretentionrates(annual)Net dollar retention remains a “fanfavorite” vanity metric for companies andinvestors alike. As we saw with GDR, netdollar retention rates have improvedsince 2020. Nearly half of companiessurveyed reported NDR over 105% and 3in 20 reported NDR over 125%.Net dollar retention tells the whole storyabout what is happening within yourcustomer base. While there are manyways to calculate this, we believe allretention figures should be tracked at thecohort level to most appropriatelyvisualize trends over time.Source: 2021 OpenView Financial & Operating Metrics Survey, N 225.ov 2021 FINANCIAL & OPERATING BENCHMARKSProprietary 2021 OpenView Advisors, LLC. All Rights Reserved21
Gross & net retention by ARRGross retention rates start off high, ascompanies initially refine product-marketfit, working directly with customers in onetarget segment of the market tounderstand what needs are.RETENTION RATES 8%100%96%95%90%90%85%85%84%80% 1M 1-2.5M 2.5M-10M 10-20M 20-50M 50MARR SCALESource: 2021 OpenView Financial & Operating Metrics Survey, N 225.ov 2021 FINANCIAL & OPERATING BENCHMARKSAs companies reach the 10-20Mthreshold they’ve achieved productmarket fit and address customer needs inthe total market. It becomes morecompetitive; however, companiesbecome much more effective at farmingtheir existing customer base forexpansion.As evidenced in how companies allocatetheir spending, focus begins to shift awayfrom product and towards perfecting theGTM motion, benefiting net retention(through upsell) at the expense ofsatisfying every customer use case (grossretention).Proprietary 2021 OpenView Advisors, LLC. All Rights Reserved22
Net retention by target customer typeNET DOLL AR RETENTION RATES (ANNUAL)Bottom QuartileMedianTop Quartile120%Regardless of segment, a competitiveNDR rate lies between 100% and 110%.Where we used to see meaningfullyhigher variance among VSB and SMBsegments, 2021 respondents indicateVSB is now the least variable segment,with the rest relatively equal (looking atinterquartile ranges from 2020 to nterpriseWhile we’re encouraged by the reducedspread amongst smaller SMB’s, VSBmedian NDR remains the same since2020 – churn remains a complexchallenge for vendors selling to smallerbusinesses.TARGET CUSTOMER TYPESource: 2021 OpenView Financial & Operating Metrics Survey, N 225.ov 2021 FINANCIAL & OPERATING BENCHMARKSProprietary 2021 OpenView Advisors, LLC. All Rights Reserved23
Equity capital raised by ARR*ARR SCALE 1M70% 1-2.5M62% 2.5M-10M 10-20M14%26%4% 20-50M8% 50M12%21%14%4%19%31%15%54%8%54%3%4% 4%8%40%25% 5-10M 10-20M60% 20-50M80% 50MEQUITY CAPITAL RAISEDFrothy markets paired with ventureinvestors who are motivated to deployrecord amounts of capital have providedcompanies with more access to cash thanever before.Mid-size companies ( 10–20M ARR) areincreasingly raising large amounts ofequity capital (29% have raised 50M,up from 10% last year).60%20% 5M8%29%40%0%5%100%Early-stage companies ( 1M ARR) arealso raising more, with 14% bringing inbetween 10–50M of equity capital (upfrom 0% last year).Source: 2021 OpenView Financial & Operating Metrics Survey, N 225.Note*: Excludes companies that haven’t raised capitalov 2021 FINANCIAL & OPERATING BENCHMARKSProprietary 2021 OpenView Advisors, LLC. All Rights Reserved24
Monthly cash burnM O N T H LY C A S H B U R N ( 0 0 0 ’ S )2020 Median21 Median 400 350 300 250 200 150Expansion stage businesses who were stillrefining product-market fit and their go-tomarket activities heading into thepandemic seem to have overcorrectedfor burn given the uncertainty aroundcustomer demand. This year we saw areversion to higher burn rates, no doubtfacilitated by large amounts of capitalavailable amid resurgent demand.Outside of the expansion stage ( 2.5–20M ARR), burn remained consistent withlast year’s report. 100 50- 1M 1-2.5M 2.5-10M 10-20MSource: 2021 OpenView Financial & Operating Metrics Survey, N 225. 0 burn implies breakevenor profitable.ov 2021 FINANCIAL & OPERATING BENCHMARKS 20-50M 50MARR SCALEProprietary 2021 OpenView Advisors, LLC. All Rights Reserved25
Monthly burn per FTE by ARRM O N T H LY C A S H B U R N P E R F T E ( 0 0 0 ’ S )Bottom QuartileMedianTop Quartile2020 Median 12Software companies’ largest expense istypically headcount. After normalizingburn for the turbulence relating toheadcount last year, a clearer pictureemerges.Early-stage companies ( 1M ARR) areraising more and burning much more perhead than they were in 2020 (YoYincrease of 3,500 per FTE). This may bea function of the increase in absoluteamounts of capital raised, which allowsfor more product experimentation beforemonetization (offsetting burn). 10 8 6 4 2- 1M 1-2.5M 2.5-10M 10-20M 20-50M 50MARR SCALESource: 2021 OpenView Financial & Operating Metrics Survey, N 225. 0 burn implies breakevenor profitable.ov 2021 FINANCIAL & OPERATING BENCHMARKSWhile the expansion stage ( 2.5-20M)burned more this year than last on anabsolute basis, it appears this may havebeen a function of adding more headsgiven median per head values.Proprietary 2021 OpenView Advisors, LLC. All Rights Reserved26
V.PRODUCT-LED GROWTHINSIGHTSov 2021 FINANCIAL & OPERATING BENCHMARKSProprietary 2021 OpenView Advisors, LLC. All Rights Reserved27
W H AT I SPRODUCT-LED GROWTH?Product-led growth (PLG) is an end user-focusedgrowth model that relies on the product itself asthe primary driver of customer acquisition,conversion and expansion.PLG is employed by many of the fastestgrowing software companies includingstandout public companies.ov 2021 FINANCIAL & OPERATING BENCHMARKSProprietary 2021 OpenView Advisors, LLC. All Rights Reserved28
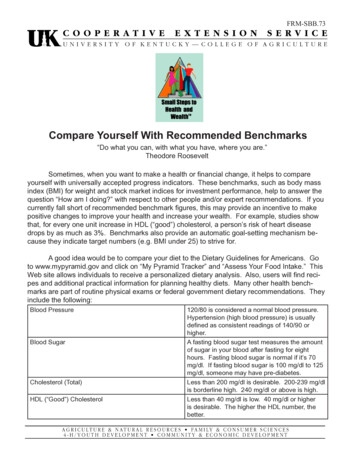
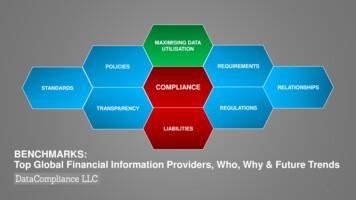
Not all enterprise SaaS is created equal; the case for PLG% CHANGE IN INDEX300.0%PLG IndexSaaS Index250.0%Product-led companies are always “openfor business”, and their lower ACV entryprices are less susceptible to budget cuts.In fact, our Product-Led Growth index hasoutperformed the SaaS index we track bynearly 2x since January 2020 – while allhave performed strongly, PLG revenue isclearly worth more to investors.200.0%150.0%100.0%50.0%0.0%-50.0%Jan Feb Mar Apr May Jun Jul Aug Sep Oct Nov Dec Jan Feb Mar Apr May Jun Jul Aug Sep20 20 20 20 20 20 20 20 20 20 20 20 21 21 21 21 21 21 21 21 21Source: Pitchbook as of 9/30/2021. SaaS index multiples calculated as enterprise value / revenue and represent medianvalue as of each date for the 70 public SaaS companies OpenView tracks.ov 2021 FINANCIAL & OPERATING BENCHMARKSProprietary 2021 OpenView Advisors, LLC. All Rights Reserved29
Adoption of product-led growth strategiesPLGCompaniesAllCompaniesFree trial offering74%47%Bottoms-up sales64%41%Dedicated growth resources (FTEs)64%21%In-product onboarding63%28%Self-service buying experience62%29%Product analytics for decision making51%28%Referral Programs50%35%Product Qualified Leads47%24%Freemium offering47%18%Despite our best efforts at evangelizingPLG, most companies are stillexperimenting, but still very fewcompanies have gone all-in – just 23% ofrespondents report PLG beingfundamental to their business which isslightly down from last year.Although free trials remain the mostpopular product-led growth strategy,respondents have begun to de-prioritizefree trials (90% in 2020) in favor ofhigher-impact alternatives like addingdedicated growth resources (up morethan 10% vs 2020).Source: 2021 OpenView Financial & Operating Metrics Survey, N 225. PLG Companies defined asthose leveraging more than three of the PLG strategies surveyed.ov 2021 FINANCIAL & OPERATING BENCHMARKSProprietary 2021 OpenView Advisors, LLC. All Rights Reserved30
Product-led growth by target customer segment% OF RESPONDENTS52%48%VSMBPLG54%46%SMBNon-PLGCompanies targeting VSB/SMB customersare adopting product-led growthstrategies at an increasing rate (up 5%and 8% since last year, respectfully).65%75%35%25%MidmarketSource: 2021 OpenView Financial & Operating Metrics Survey, N 225. PLG Companies definedEvery target segment saw a YoY uptick inPLG adoption besides large enterprises.EnterpriseTARGET SEGMENTas those leveraging more than three of the PLG strategies surveyed.ov 2021 FINANCIAL & OPERATING BENCHMARKSProprietary 2021 OpenView Advisors, LLC. All Rights Reserved31
Product-led growth ACVs by ARR scale% OF RESPONDENTS40%20%40% 1M 5k45%45%9%9%45% 1-2.5M 5-10k 10k54%55%23%18%23%27% 10-20M 20-50MPLG companies land with a lower CAC atmore digestible ACVs to start, but candrive significant expansion in accountsover time as the product spreadsthroughout large organizations.45% 2.5M-10MSource: 2021 OpenView Financial & Operating Metrics Survey, N 225. PLG Companies defined as those leveraging more than three of the PLGstrategies surveyed.ov 2021 FINANCIAL & OPERATING BENCHMARKSProprietary 2021 OpenView Advisors, LLC. All Rights Reserved32
Product-led businesses grow fasterMEDIAN GROWTH RATEPLGNon-PLGWe used to observe PLG companiesgrowing more slowly than their peers atearlier stages; they’re now outpacingtheir non-PLG peers at all ARR scales.160%140%120%100%This may be because they are able toraise the capital required to fuel earlyproduct development and usage growthwithout monetizing, then sustain thatmomentum as they gain product-marketfit and deliver more value to customers asthe company matures.80%60%40%20%- 1M 1-2.5M 2.5-10M 10-20M 20-50M 50MARR SCALESource: 2021 OpenView Financial & Operating Metrics Survey, N 225. PLG Companies definedas those leveraging more than three of the PLG strategies surveyed.ov 2021 FINANCIAL & OPERATING BENCHMARKSProprietary 2021 OpenView Advisors, LLC. All Rights Reserved33
VI.GO-TO-MARKETINSIGHTS
Growth rate by company ARRGROWTH RATE (ANNUAL)Median2020 MedianTop QuartileTop quartile growth for early-stage350%300%companies has skyrocketed since 2020 120% 200%Besides the 20—50M ARR bucket,median growth rates have risen vs. 2020.While we can reasonably expect 2020growth was stunted by the impacts of thepandemic and any slowdown inoperating investments, we’re encouragedto see companies stepping back on thegas.250%200%150%100%50%-- 1M 1-2.5MGrowth rate is more closely correlatedwith SaaS valuations than ever before.Software companies grow rapidly in theirearly stages – a typical company doublesYoY and a top quartile company morethan quadruples. 2.5-10MSource: 2021 OpenView Financial & Operating Metrics Survey, N 225.ov 2021 FINANCIAL & OPERATING BENCHMARKS 10-20M 20-50M 50MARR SCALETop quartile growth rates for early-stagecompanies are increasing two and threefold from 2020 ( 1M ARR and 1—2.5MARR, respectively). Companies are beingfounded and funded and customers areback to buying!Proprietary 2021 OpenView Advisors, LLC. All Rights Reserved35
Sales & marketing spend by ARRSALES & MARKETING SPEND (% OF ARR)Bottom QuartileMedian2020 MedianTop Quartile70%60%50%40%30%20%10%- 1M 1-2.5M 2.5-10M 10-20M 20-50M 50MSales & marketing expenses typicallybecome a SaaS company’s largestareas of spend with increased scale,overtaking product and engineering,which dominates spend at the earlierstages.After the product has been built andproduct-market fit has been found, it’stime to monetize! We continue to seecompanies invest more heavily as apercent of ARR when they enter theexpansion stage at 1M of ARR. Thisreduces as companies scale and pressfor operational excellence in sales.ARR SCALESource: 2021 OpenView Financial & Operating Metrics Survey, N 225.ov 2021 FINANCIAL & OPERATING BENCHMARKSProprietary 2021 OpenView Advisors, LLC. All Rights Reserved36
Product & engineering spend by ARRPRODUCT & ENGINEERING SPEND (% OF ARR)Bottom QuartileMedian2020 MedianTop Quartile100%80%60%40%20%- 1M 1-2.5M 2.5-10M 10-20M 20-50M 50MARR SCALEProduct & engineering expenses areusually the first place SaaS companiesprioritize spend as they work towardsproduct-market fit.Median spend was relatively flat acrossARR stages besides the earliest ( 1MARR), which saw a massive dip versus2020 (median down 18%). This could bedue to hiring issues, where the smallestcompanies simply can’t find/attract theright engineering talent, or ovacompanies benefitting from increasedearly-stage funding are choosing to investin other functional areas sooner (e.g.Sales).Source: 2021 OpenView Financial & Operating Metrics Survey, N 225.ov 2021 FINANCIAL & OPERATING BENCHMARKSProprietary 2021 OpenView Advisors, LLC. All Rights Reserved37
General & administrative spend by ARRGENERAL & ADMINISTRATIVE SPEND (% OF ARR)Bottom QuartileMedianTop Quartile2020 Median35%General & administrative expenses arereliably the smallest area of spendamong SaaS businesses.In fact, over the last four years of thisreport, G&A has yet to crack 25% oftotal operating expense spend at anyARR scale, with the lion’s share beingallocated between developing (product &engineering) and monetizing (sales &marketing) the product.30%25%20%15%10%5%- 1M 1-2.5M 2.5-10M 10-20M 20-50M 50MARR SCALESource: 2021 OpenView Financial & Operating Metrics Survey, N 225.ov 2021 FINANCIAL & OPERATING BENCHMARKSProprietary 2021 OpenView Advisors, LLC. All Rights Reserved38
Sales & marketing vs product & engineering spend by ARRMEDIAN SPEND (% OF ARR)Sales & MarketingProduct & 35%30%25%25%10%-- 1M 1-2.5M 2.5-10MSource: 2021 OpenView Financial & Operating Metrics Survey, N 225.ov 2021 FINANCIAL & OPERATING BENCHMARKS 10-20M 20-50M 50MThe waxing and waning relationshipbetween sales and product spend hasbeen a consistent observation in each ofthe last four years of this report, with eachbucket of spend reaching it’s maximum(% of ARR) at the smallest (product) andlargest (sales) ARR scale.However, the ARR threshold where thisshift in spend occurs continues to creepupwards ( 2.5M in 2019, to 10M in2020, to 20M in 2021), suggestingbusiness focus remains on the product forlonger as companies and theirshareholders are more focused oncustomer value creation for longer.ARR SCALEProprietary 2021 OpenView Advisors, LLC. All Rights Reserved39
Months to recover CAC (CAC payback)C A C PAY B A C K I N M O N T H SBottom Quartile(1)MedianTop Quartile2020 Median25201510CAC payback generally lengthens whencompanies achieve greater ARR scale –but watch out for worsening your go-tomarket efficiency as you grow. This year’sslip in payback data versus 2020 maysimply be a follow-
Here are 4 tips we offer for using benchmarks: Benchmarks are the map, not the territory: Use financial & operating benchmarks only as a map for "acceptable ranges," at any point in time that will eventually enable your business to generate repeatable and predictable free cash flow in the future. Performance and valuation are