Transcription
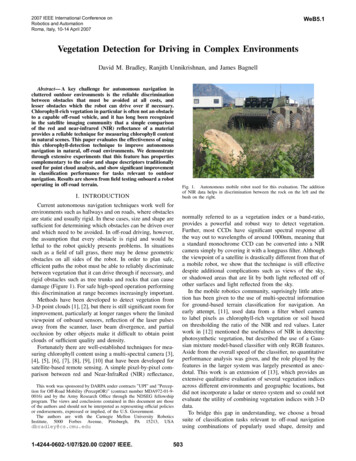
2007 IEEE International Conference onRobotics and AutomationRoma, Italy, 10-14 April 2007WeB5.1Vegetation Detection for Driving in Complex EnvironmentsDavid M. Bradley, Ranjith Unnikrishnan, and James BagnellAbstract— A key challenge for autonomous navigation incluttered outdoor environments is the reliable discriminationbetween obstacles that must be avoided at all costs, andlesser obstacles which the robot can drive over if necessary.Chlorophyll-rich vegetation in particular is often not an obstacleto a capable off-road vehicle, and it has long been recognizedin the satellite imaging community that a simple comparisonof the red and near-infrared (NIR) reflectance of a materialprovides a reliable technique for measuring chlorophyll contentin natural scenes. This paper evaluates the effectiveness of usingthis chlorophyll-detection technique to improve autonomousnavigation in natural, off-road environments. We demonstratethrough extensive experiments that this feature has propertiescomplementary to the color and shape descriptors traditionallyused for point cloud analysis, and show significant improvementin classification performance for tasks relevant to outdoornavigation. Results are shown from field testing onboard a robotoperating in off-road terrain.I. INTRODUCTIONCurrent autonomous navigation techniques work well forenvironments such as hallways and on roads, where obstaclesare static and usually rigid. In these cases, size and shape aresufficient for determining which obstacles can be driven overand which need to be avoided. In off-road driving, however,the assumption that every obstacle is rigid and would belethal to the robot quickly presents problems. In situationssuch as a field of tall grass, there may be dense geometricobstacles on all sides of the robot. In order to plan safe,efficient paths the robot must be able to reliably discriminatebetween vegetation that it can drive through if necessary, andrigid obstacles such as tree trunks and rocks that can causedamage (Figure 1). For safe high-speed operation performingthis discrimination at range becomes increasingly important.Methods have been developed to detect vegetation from3-D point clouds [1], [2], but there is still significant room forimprovement, particularly at longer ranges where the limitedviewpoint of onboard sensors, reflection of the laser pulsesaway from the scanner, laser beam divergence, and partialocclusion by other objects make it difficult to obtain pointclouds of sufficient quality and density.Fortunately there are well-established techniques for measuring chlorophyll content using a multi-spectral camera [3],[4], [5], [6], [7], [8], [9], [10] that have been developed forsatellite-based remote sensing. A simple pixel-by-pixel comparison between red and Near-InfraRed (NIR) reflectance,This work was sponsored by DARPA under contracts ”UPI” and ”Perception for Off-Road Mobility (PerceptOR)” (contract number MDA972-01-90016) and by the Army Research Office through the NDSEG fellowshipprogram. The views and conclusions contained in this document are thoseof the authors and should not be interpreted as representing official policiesor endorsements, expressed or implied, of the U.S. Government.The authors are with the Carnegie Mellon University RoboticsInstitute, 5000 Forbes Avenue, Pittsburgh, PA 15213, USAdbradley@cs.cmu.edu1-4244-0602-1/07/ 20.00 2007 IEEE.Fig. 1. Autonomous mobile robot used for this evaluation. The additionof NIR data helps in discrimination between the rock on the left and thebush on the right.normally referred to as a vegetation index or a band-ratio,provides a powerful and robust way to detect vegetation.Further, most CCDs have significant spectral response allthe way out to wavelengths of around 1000nm, meaning thata standard monochrome CCD can be converted into a NIRcamera simply by covering it with a longpass filter. Althoughthe viewpoint of a satellite is drastically different from that ofa mobile robot, we show that the technique is still effectivedespite additional complications such as views of the sky,or shadowed areas that are lit by both light reflected off ofother surfaces and light reflected from the sky.In the mobile robotics community, suprisingly little attention has been given to the use of multi-spectral informationfor ground-based terrain classification for navigation. Anearly attempt, [11], used data from a filter wheel camerato label pixels as chlorophyll-rich vegetation or soil basedon thresholding the ratio of the NIR and red values. Laterwork in [12] mentioned the usefulness of NIR in detectingphotosynthetic vegetation, but described the use of a Gaussian mixture model-based classifier with only RGB features.Aside from the overall speed of the classifier, no quantitativeperformance analysis was given, and the role played by thefeatures in the larger system was largely presented as anecdotal. This work is an extension of [13], which provides anextensive qualitative evaluation of several vegetation indicesacross different environments and geographic locations, butdid not incorporate a ladar or stereo system and so could notevaluate the utility of combining vegetation indices with 3-Ddata.To bridge this gap in understanding, we choose a broadsuite of classification tasks relevant to off-road navigationusing combinations of popularly used shape, density and503
WeB5.1color features and show the effect of augmenting thesefeatures with NIR and NDVI information. In particular foreach task we analyze the reliability of different feature setswith respect to sensing range. We demonstrate through aset of experiments that this feature has properties complementary to the color and shape descriptors traditionally usedfor point cloud analysis, and show significant improvementin classification performance for tasks relevant to outdoornavigation.The paper is organized as follows. Section II gives anoverview of existing approaches to vegetation detection usingspectral and geometric information, and its application tonavigation. Section III describes the overall system implementation on our robot platform including the sensingmodalities available and the design choices made for internalrepresentation and path planning. Section IV describes thedatasets used and presents results on voxel classificationexperiments. Section V describes how improved voxel classification translates into system level performance gains.Finally we conclude in Section VI and discuss future work.A longer version of this paper giving larger figures, as wellas simulation results of NDVI performance on hundreds ofcommon materials is available from the author’s website.II. A PPROACHES TO V EGETATION D ETECTIONThis paper combines two complementary approaches tovegetation detection, vegetation indices (also referred to asband-ratio techniques) that have long been used in the remotesensing community, and more recent 3-D structure basedtechniques from the mobile robotics community.Fig. 2. Scatter plot of NIR reflectance vs. red reflectance for all pixels ina typical image. Different regions in the scatterplot correspond to differenttypes of materials in the image. Pixels in the green region correspond tovegetation (top image), pixels in the red region are mainly soil and manmade structures (middle image), and pixels in the blue region correspondto sky (bottom image).Pixels containing vegetation and blue sky are remarkablywell separated from everything else in a natural scene.One of the most popular ways to use the informationcontained in the red and NIR bands for remote sensing applications is to compute a quantity known as the NormalizedDifference Vegetation Index (NDVI) which varies from -1(blue sky) to 1 (chlorophyll-rich vegetation) [8].A. Vegetation IndicesNDVI The spectral properties of chlorophyll-rich vegetation areprimarily determined by the absorption spectra of water andchlorophyll, and the refraction of light at cell walls [14].The water present in cells absorbs light with wavelengthslonger than 1400 nm. Chlorophyll strongly absorbs visiblelight, especially red and blue wavelengths [3]. The remaininglight is efficiently scattered by the critical internal reflectioncaused by the change in refractive index from water to airat the cell wall. As a result, those wavelengths between 700nm and 1400 nm that escape both water and chlorophyll arestrongly reflected in all directions.The sharp difference between the reflectance of vegetationat 645nm (red) and at 780nm (NIR) has long been exploitedin the field of satellite remote sensing. Kauth and Thomas [7]noticed that plotting NIR reflectance against Red reflectancefor satellite images produced a scatter diagram with a line ofpoints formed by pixels containing bare soil, and a clusterof points from pixels completely covered with vegetation.Points with a mixture of vegetation and soil appear betweenthe soil line and the vegetation point. Figure 2 shows thisscatter plot created from one of our images. Because ourcamera also includes a view of the sky, our scatter plotcontains a blue sky region ( bottom image, marked in blue) aswell as the soil region (middle image, marked in red) and thevegetation region (top image, marked in green). Clouds blendinto the soil line, but are still very distinct from vegetation.ρNIR ρREDρNIR ρRED(1)An informative interpretation of the NDVI is given in[15], where it is shown to be a measurement of the slopefrom the origin to the location of the pixel in a 45 degreerotation of the red-NIR space. Several attempts have beenmade in the remote sensing literature to correct deficienciesin this index [10], [5], [16], [15], particularly in shadowsand underexposed areas. Since the NDVI measures the slopefrom the origin, sensor noise and errors in the radiometriccalibration of the red and NIR sensors have a much greatereffect in underexposed areas. Shadows pose a more challenging problem, since the reflected light that illuminatesshadowed regions can have a spectral distribution that issignificantly different from that of sunlight, usually shiftedtowards blue wavelengths because of atmospheric scattering.The typical use of NDVI in remote sensing is to measurethe Leaf Area Index (LAI), the percentage of the groundsurface that is covered by vegetation. However, when the goalis linear classification into vegetation and non-vegetationcategories, it is useful to provide the raw NIR and red valuesas well as the NDVI to the classifier. This is because a lineardecision boundary based solely on the NDVI corresponds toa line intersecting the origin of the red-nir space, whereasa linear classifier operating on the raw pixel values and aconstant bias feature can produce a decision boundary withan arbitrary intercept. In this paper the NDVI is discussed504
WeB5.1to tie this vegetation detection technique back to its originsin the remote sensing community, but the actual classifiersevaluated in section IV use the raw pixel values as well asthe NDVI. Linear classifiers based on NDVI were shown tobe effective for a broad variety of materials in [13], usingthe USGS digital spectral library [17].have one dominant eigenvalue. Surfaces have two largeeigenvalues, and an area is declared to be scatter when thethird largest eigenvalue is a significant fraction of the largesteigenvalue. In addition, the estimated surface normal of thelocal area, another useful feature of the local point cloud, isrecovered by this computation as it is simply the eigenvectorcorresponding to the smallest eigenvalue of the covariancematrix.This 3-D method performs particularly well on certainman-made structures where the NDVI approach is knownto fail. For instance, certain types of vehicle paint give off avegetation-like NDVI signature (figure 3), but the flat sides ofvehicles are easily detected as surface 3-D structures (figure4). However, the 3-D method does require a relatively dense,high-quality point cloud, which limits its application to areascloser to the robot.III. S YSTEM OVERVIEWFig. 3. Small images show the RGB and color appearance of two scenes.Large images are the RGB image with areas of high NDVI highlightedin bright green. While generally reliable in natural scenes, NDVI can failon synthetic materials such as the paint on the truck in the right image.In this case 3-D methods would easily classify the side of the truck as arigid obstacle instead of vegetation. Note that NDVI correctly classifies thebrown dead grass in the left image as vegetation.Fig. 4. Left: average RGB values of each voxel in a scene containing cars.Right: after 3-D classification the voxels containing the flat sides of thecars are classified as obstacles (blue). Voxels containing curved car surfaceshave more of a vegetation-like signature (green), and voxels correspondingto ground are marked in red.B. 3-D Point DistributionA complementary approach to vegetation detection, presented in [18], uses the spatial distribution of the local ladarpoint cloud to classify the region into surfaces, linear structures, and a class referred to as scatter, which includes treecanopy and porous vegetation. This method first computesthe eigenvalues of the covariance matrix of the local pointcloud (defined as all points within a certain distance of thepoint of interest), and then classifies the point based on therelative magnitudes of those eigenvalues. Linear structuresThe vegetation index technique for detecting chlorophyllrich vegetation can (and has) been implemented in manydifferent ways, but since this is an experimental paper whichaddresses system-level effects we include a brief descriptionof the specific implementation to aid in analyzing the results.The robotic system used for this evaluation extends theapproach outlined in [19]. A set of laser scanners andcameras provide the input to the perception system, whichconsists of 3-D points that have been projected into cameraimages, and tagged with local properties of the image suchas color and the NDVI value (Figure 5). The local perceptionsystem then discretizes the space surrounding the robot intoa 3-D grid of voxels, and accumulates summary statisticsof the tagged laser points over each voxel. The summarystatistics include the averages of the point tags, eigenvaluesof the local point cloud scatter matrix, the surface normal(3rd eigenvector of the scatter matrix), and the probabilityand strength of laser pulse reflection from the voxel. Theperception system is then responsible for condensing this 3D grid of voxels into a 2-D grid of cost values so that theplanner (a variant of A*) can then plan a minimum cost path.Various interpretations have been proposed for the meaningof the cost values, such as mobility risk, but due to thetightly coupled nature of mobile robot systems they haveno fundamental interpretation apart from the paths that theycause the planner to produce through the environment.Costs are produced from the voxels by applying a setof learned classifiers in conjuction with several hand-tunedrules for combining the classification results in each verticalcolumn. Linear maximum entropy (multi-class logistic regression) classifiers [20], are used in order to meet the strictreal-time requirements imposed by continuous motion atseveral meters per second. These classifiers find a conditionaldistribution P (c d) for the class c(d) of training exampled D, that has maximum entropy (i.e. makes as fewassumptions as possible) subject to the constraint that theexpected value of each feature fi (d, c) of each examplematches its average value over the training set (2).XX1 Xfi (d, c(d)) P (d)P (c d)fi (d, c) (2) D c505d Dd
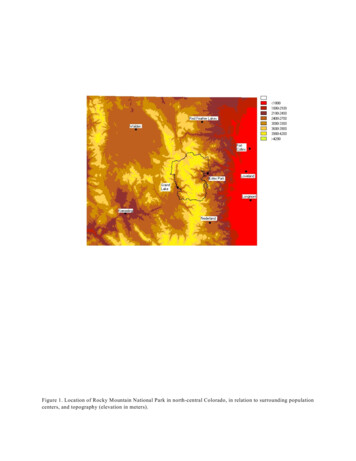
WeB5.1IV. VOXEL C LASSIFICATION R ESULTSA. Data SetThe system was trained and tested using data from two significantly different physical environments. Training examplesof rocks, bushes, grass, trees, and man-made structures suchas cars, telephone poles, and barrels were gathered from asite in Western Pennsylvania. More examples of rocks andbushes were collected several weeks later in natural terrain inthe foothills of the Colorado Rockies. Voxels were labeledby either hand-labelling the point cloud, or in some caseslabeling everything the vehicle drives over. In both cases thefeatures (density, surface normal, scatter matrix eigenvalue,RGB1 , NIR, and NDVI) of each labeled voxel were recordedevery time a new laser point in that voxel was observed.Fig. 5. Top left: A typical camera image. Inputs to the perception systemconsist of 3-D points that have been projected into the camera images andtagged with local image properties such as color (top right) and the NDVIvalue (bottom right). The points are then accumulated in a discretized 3-Dgrid of voxels, with the average NDVI of each voxel shown in the bottomleft image.In practice the empirical distribution of d in the training setis used to approximate the true distribution P (d), and a weakGaussian prior is added to control overfitting. The resultingmaximum entropy conditional distribution takes the form ofa linear classifier over the features (3), that is normalized toform a probability distribution (4).1 Pi λi fi (d,c)e(3)P (c d) Z(d)X PZ(d) e i λi fi (d,c)(4)cThe classifiers are trained from labeled data sets that aregathered by either driving the robot over areas of differentterrain type (and labelling everything that passes under therobot), or in the case of obstacles, by hand-labelling theirlocations in a set of point clouds using a simple paint-likeinterface. Currently there are two ways that classifiers areused in the system. The classification of a voxel as obstacle,vegetation, or ground influences how the data it contains isused in estimating the ground plane. Also, the rigid/nonrigid obstacle classifications of the voxels in each columnare used to compute an overall rigid/non-rigid flag for thecolumn, which allows for the assignment of different coststo rigid and non-rigid obstacles in the 2-D costmap.Because the beamwidth of the ladar we use is approximately 10x the angular resolution of the cameras, ladarpoints tagged with the center point of the ladar beam may beincorrectly tagged with pixels from the sky. Because of thiseffect voxels straddling vegetation/sky image boundaries canhave average NDVI values that look like non-vegetation (bluesky is particulary bad because of its exceptionally low NDVIvalue). To reduce this problem, the exposure on the camerasis controlled to correctly expose only those portions of theimage where ladar returns were received, which generallymeans that sky pixels are marked as overexposed and theirNDVI tags do not contribute to the voxel’s classification.B. Classification ResultsWe start our evaluation with quantitative results on theeffects of using NDVI for several important discriminativetasks. The leftmost column of Figure 6 considers the taskof discriminating between non-rigid voxels (grass, bushes,etc.) and rigid voxels (Tree trunks, rocks, cars, telephonepoles, bare ground, etc.). It shows that when the trainingand testing environments and lighting conditions are similar(but physically separate), laser features are of little value andeither RGB or NDVI features provide better performance. Asdiscussed in Section III, this task is crucial to the way therobot generates a costmap for path planning.The ladar features become crucial, however, in the morecomplicated three-way classification task used by the robotto estimate the true ground plane of the scene. This taskis similar to the previous task, with the exception that therigid voxel class is divided into an obstacle class and aroad class (horizontally oriented bare ground surfaces). Inthe center column of Figure 6 we see that combining thecamera features with the ladar features boosts the total classification accuracy by approximately 10%. This performanceboost is almost entirely from improvements in the ability todiscriminate between the obstacle and road classes, as shownin Table I. Again in this task we see that the camera featuresare very helpful in discriminating between non-rigid voxelsand the other two classes.Finally, in the rightmost column of Figure 6, we investigatethe generalization ability of the different feature sets acrossdifferent geographic environments on the task of discriminating between rocks and bushes. For this test the training setis from Pennsylvania, and the test set is from Colorado. TheNDVI features do not overfit to the training environment, andtheir performance degrades only slightly. The RGB features,on the other hand, allow the classifiers that include themto overfit to the specific lighting and flora of the trainingset, leading to vastly degraded performance in the novelenvironment.Fortunately, it is not necessary to have many NIR sensors to benefit from the generalization ability of the NDVIfeatures. As long as a representative sample of RGB-NIRtuplets are available for the current environment and lighting1 Our RGB feature vector also includes the HSV colorspace representationof the RGB values, as they are often more useful for linear classification.506
WeB5.1Fig. 6. Voxel classification accuracy vs range for several example classification problems. The top row displays training set performance and the bottomrow gives test set performance. LEFT COLUMN: Rigid obstacles (rocks, tree trunks, telephone poles, cars, etc.) vs non-rigid obstacles (grass and bushes).Inclusion of RGB or NDVI features provides a clear performance boost over ladar features alone. CENTER COLUMN: Rigid obstacles vs. non-rigidvegetation vs. ground. This task, which is used in ground plane estimation, benefits from combining ladar and RGB or NDVI features. RIGHT COLUMN:Rocks vs. bushes. The training set for this task was collected in Pennsylvania, and the test set was collected in Colorado. The NDVI features show superiorgeneralization to the novel environment.Ladar Features OnlyTrue ClassPredicted Class obstacle .824.6ground3.127.968.9Camera Features OnlyTrue ClassPredicted Class obstacle .64.7ground21.121.457.5(sigma of 1, 2, 4, and 8 pixels). The 100-node regressiontree used for the prediction was trained on a random samplefrom a 4-color (RGB and NIR) image with a field of viewcovering a separate portion of the same scene. Classifierswere re-trained every 25 images using an image that was20 seconds old (which corresponds to approximately 30mof travel in this sequence, enough to ensure a significantviewpoint difference). The regression tree produced less than8% of the error obtained by predicting the mean NDVI value.V. S YSTEM - LEVEL PERFORMANCE GAINS FROMPredicted ClassobstaclevegetationgroundAll FeaturesTrue Classobstacle vegetation88.10.26.495.15.54.7IMPROVED VEGETATION DETECTIONground4.721.274.1TABLE IC ONFUSION MATRICES FOR DIFFERENT FEATURE SETScondition, a RGB-based classifier can be trained to predictthe NDVI values. This representative sample might comefrom a single NIR camera whose field of view overlaps withthat of an existing RGB camera on the robot. Figure 7 showsthe results of predicting the NDVI value at each pixel inan image using simple features computed from the localRGB values consisting of the RGB, HSV, and Lab valuesof the pixel when blurred with a gaussian at four scalesThe increase in voxel classification accuracy from addingRGB and NDVI features improves the robot’s overall abilityto autonomously avoid rigid obstacles without being overlyafraid of bushes or tall grasses. Figure 5 shows the robot’sview of two barrels that it is avoiding during a 2 m/sautonomous run. Figure 8 shows the classification maps therobot generates from this position with and without the NDVIfeatures. The tall grass behind the barrels creates many falseobstacles for the ladar-only perception system. With NDVIinformation the barrels stand out clearly as the two large blueblobs, and there is only one small false-positive obstacle. Toshow generalization across environments, this run took placein Colorado using classifiers that were trained exclusively ondata collected in Pennsylvania.VI. CONCLUSIONS AND FUTURE WORKThe near-infrared and red color bands provide a robustmethod for discriminating between rigid obstacles and non-507
WeB5.1especially grateful to the UPI team for making this researchpossible, and in particular to Carl Wellington and Cris Dimafor all of their hard work and advice. The authors wouldalso like to thank the reviewers for their time and helpfulcomments.R EFERENCESFig. 7. NDVI can be predicted from RGB for a given environment andillumination condition, meaning the benefits of NDVI can be captured evenif the NIR sensors on the robot have a much more limited field of viewthan the RGB sensors. The 4-color image (RGB & NIR, only RGB shown)at top left is used to train a classifier that predicts the NDVI image (bottomright) for the RGB image at top right. The ground truth NDVI image isshown at bottom left. Note how the vegetation behind the cars is detectedagainst the dark green portion of the building.Fig. 8. Left: classification map using ladar features only. Right: addingNDVI information allows the system to be more selective, and displaythe barrels from Figure 5 clearly in the classification map without alsopicking up non-rigid vegetation. The barrels are the two large white blobs.White indicates obstacle classification (high cost), green indicates vegetationclassification (low cost), and red indicates road classification (very low cost).The position of the robot is represented as a gray rectange.rigid vegetation that thus far has been underutilized onmobile robotics systems. By showing how it contributed toperformance improvements in a field tested robotic system,we hope to encourage more widespread use of this techniqueMore work is needed in the area of color constancy, orcompensating for the effect of differences in the illuminantsencountered. The general problem of color constancy isunderdetermined, however robotic systems that use ladarsin conjuction with NIR and color cameras have a crucialadvantage in that they often have access to information suchas laser remission, surface normal, and surface shape that canbe used to help deduce the approximate spectral distributionof the illumination.VII. ACKNOWLEDGMENTSThe Authors would like to thank the Defense AdvancedResearch Projects Agency and the Army Research Office fortheir support of this research through the UPI program andthe NDSEG graduate fellowship program. The authors are[1] J.-F. Lalonde, N. Vandapel, D. F. Huber, and M. Hebert, “Naturalterrain classification using three-dimensional ladar data for groundrobot mobility,” Journal of Field Robotics, vol. 23, no. 10, pp. 839–861, October 2006.[2] J. Macedo, R. Manduchi, and L. Matthies, “Ladar-based discriminationof grass from obstacles for autonomous navigation,” in Proc. of theInternational Symposium on Experimental Robotics, Honolulu, HA,December 2000.[3] R. N. Clark, G. A. Swayze, K. E. Livo, R. F. Kokaly, S. J. Sutley, J. B.Dalton, R. R. McDougal, and C. Gent, “Imaging spectroscopy: Earthand planetary remote sensing with the usgs tetracorder and expertsystems,” J. Geophys. Res., December 2003.[4] R. E. Crippen, “Calculating the vegetation index faster,” RemoteSensing of Environment, vol. 34, pp. 71–73, 1990.[5] A. R. Huete, “A soil adjusted vegetation index (savi),” Remote Sensingof Environment, vol. 25, pp. 295–309, 1988.[6] C. F. Jordan, “Derivation of leaf area index from quality measurementsof light on the forest floor,” Ecology, vol. 50, pp. 663–666, 1969.[7] R. J. Kauth and G. S. Thomas, “The tasseled cap - a graphicdescription of the spectral-temporal development of agricultural cropsas seen by landsat,” in LARS: Proceedings of the Symposium onMachine Processing of Remotely Sensed Data, West Lafayette, IN,1976, pp. 4B–14–4B–51.[8] F. J. Kreigler, W. A. Malila, R. Nalepka, and W. Richardson, “Preprocessing transformations and their effects on multispectral recognition,”in Proc. of the Sixth International Symposium on Remote Sensing ofEnvironment, Ann Arbor, MI, 1969, pp. 97–131.[9] R. Willstatter and A. Stoll, Utersuchungenuber Chlorophyll. Berlin:Springer, 1913.[10] A. J. Richardson and C. L. Wiegand, “Distinguishing vegetationfrom soil background information,” Photogrammetric Engineering andRemote Sensing, vol. 43, pp. 1541–1552, 1977.[11] L. Matthies, A. Kelly, T. Litwin, and G. Tharp, “Obstacle detectionfor unmanned ground vehicles: A progress report,” in Proc. of theInternational Symposium on Robotics Research (ISRR), 1996, pp. 475–486. [Online]. Available: citeseer.ist.psu.edu/matthies95obstacle.html[12] R. Manduchi, A. Castano, A. Talukder, and L. Matthies,“Obstacle detection and terrain classification for autonomousoff-road navigation,” Autonomous Robots, vol. 18, pp. 81–102, 2005.[Online]. Available: citeseer.ist.psu.edu/manduchi04obstacle.html[13] D. Bradley, S. Thayer, A. T. Stentz, and P. Rander, “Vegetationdetection for mobile robot navigation,” Robotics Institute, CarnegieMellon University, Pittsburgh, PA, Tech. Rep. CMU-RI-TR-04-12,February 2004.[14] C. A. Shull, “A spectrophotometric study of the reflection of lightfrom leaf surfaces,” Bot. Gazette, vol. 87, no. 5, pp. 583–607, 1929.[15] C. Ünsalan and K. L. Boyer, “Linearized vegetation indices based on aformal statistical framework,” IEEE Trans. on Geoscience and RemoteSensing, vol. 42, no. 7, pp. 1575–1585, 2004.[16] J. Qi, A. Chehbouni, A. R. Huete, Y. H. Kerr, and S. Sorooshian, “Amodified soil adjusted vegetation index: Msavi,” Remote Sensing ofEnvironment, vol. 48, pp. 119–126, 1994.[17] R. N. Clark, G. A. Swayze, R. Wise, K. E. Livo, T. M. Hoefen,R. F. Kokaly, and S. J. Sutley, “USGS digital spectral library splib05a,USGS open file report 03-395,” 2003.[18] N. Vandapel and M. Hebert, “Natural terrain classification using 3-dladar data,” in IEEE Intl. Conf. on Robotics and Automation (ICRA),200
on synthetic materials such as the paint on the truck in the right image. In this case 3-D methods would easily classify the side of the truck as a rigid obstacle instead of vegetation. Note that NDVI correctly classies the brown dead grass in the left image as vegetation. Fig. 4. Left: average RGB values of each voxel in a scene containing cars.