Transcription
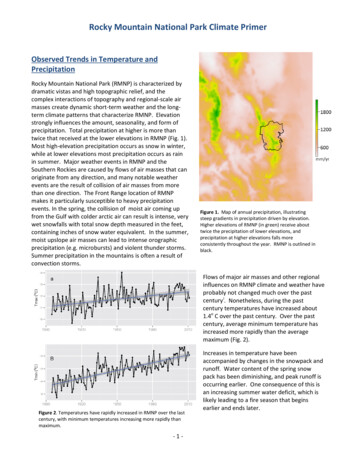
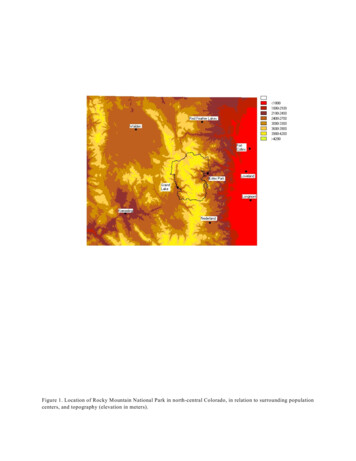
Figure 1. Location of Rocky Mountain National Park in north-central Colorado, in relation to surrounding populationcenters, and topography (elevation in meters).
Figure 2. Elk ranges as delimited by drawing polygons around the majority radiolocations of Larkins (1997).Uncommon outlying locations were not included. The grey area is the combined summer and winter range. Thewinter ranges of three herd segments determined by Lubow et al. (2002) are shown in thick black lines. The townrange corresponds to the area included in ground counts. Also shown are streams, and the Rocky Mountain NationalPark boundary.
A)B)C)Figure 3. A) Size of the elk population wintering inside the park boundaries. 1915-1964 data are from Stevens(1980), “estimates” non-statistically corrected for sightablity. 1965-1998 are from Lubow et al. (2002) “estimates”statistically corrected for sightability. B) Size of the town population, as in Lubow et al. (2002) “estimates”statistically corrected for sightablity. C) Size of the deer herd, from Stevens (1980), “estimates” non-statisticallycorrected for sightablity.
A)B)Figure 4. Topography of the Rocky Mountain National Park study area. A) Planar view with roads. B) Orthographicview from the southwest. The elk winter range lies in the valley on the eastern edge of the park.
Figure 5. Hydrography of Rocky Mountain National Park, showing the three principle watersheds feeding into the elkwinter range. Also shown are the well-studied Loch Vale W atershed (Baron et al. 1992), and the location of the BigThompson siphon, which brings water from the west to the east slope.
Figure 6. Annual precipitation recorded at Estes Park 1910-1998, and at Grand Lake 1949-1998. The two stations atGrand Lake are situated at different elevations.
Figure 7. Vegetation map resulting from combining the Rocky Mountain National Park vegetation map (boundary is the thick black line), and the ArapahoRoosevelt National Forest vegetation map (outside park boundary).
Figure 8. Vegetation map with missing areas in the RM NP/USFS map filled in with data from a Landsat-based vegetation map of Larimer County, Colorado.High elevation grasslands have been reclassified as tundra. Original classes simplified to 15.
Figure 9. Normalized difference vegetation index (NDVI) of the principle winter range areas of the 2 park herd segments and the town segment ground count area(thin black lines). The boundary of Rocky Mountain National Park is shown a thick black line. Exclosure study sites appear as small black rectangles. The NDVIvalue does not have any units but is an index that generally ranges from 0 to 1. The units are given here in scientific notation where for example 1.12E-02 means0.0112 and 3.37E-01 means 0.337.
Figure 10. NDVI in the town of Estes Park, showing roads, and biomass sampling sites. The NDVI value does not have any units but is an index that generallyranges from 0 to 1. The units are given here in scientific notation where for example 1.12E-02 means 0.0112 and 3.37E-01 means 0.337.
Figure 11. Plots of total green plus brown biomass (grams per square meter dry weight) measured at sampling sites inEstes Park town vs. NDVI values at those locations on the NDVI map: A) unexclosed plots in 1997 (r2 0.62,p 0.05); B) exclosed plots in 1998 (r2 0.27, p 0.13); C) unexclosed plots in 1998 (r2 0.55, p 0.014).
Figure 12. Vegetation classification of Estes Park, with human-influenced vegetation types, at 100m resolution. Also shown are roads and the park boundary.
Figure 13. Portion of final vegetation map used in the model representing current conditions, focusing on the elk winter range. Also shown are willow stands thathave been reclassified using data from Peinetti (2000), the 3 herd segment winter ranges, the park boundary, and the McGregor Ranch.
Figure 14. Reconstructed natural vegetation in the Estes Valley and elk winter range, for use in model scenarios. The 2 park elk ranges, Moraine Park andHorseshoe Park, and the Town count unit, are shown in thin black lines.
Figure 16. Tree size map, in diameter at breast height, using combined data of RM NP and ARNF. The area occupied by the town of Estes Park was classifiedbased on modal values for similar vegetation types in RM NP and ARNF.
Figure 18. W eather station (circles) and SNOTEL station (squares) locations.
A)B)Figure 19. Topographic precipitation redistribution map. There are no units, as this is a 0-1 scalar. Net precipitationinput is the value of this map times actual precipitation. Units are in scientific notation, for example 1.60E-01 means0.16 and 1.125E-00 means 1.125. A) Original resolution of 100m. B) Resolution used in modeling, 500m.
Vegetation map resulting from combining the Rocky Mountain National Park vegetation map (boundary is the thick black line), and the Arapaho-Roosevelt National Forest vegetation map (outside park boundary). Figure 8. Vegetation map with missing areas in the RMNP/USFS map filled in with data from a Landsat-ba