Transcription
Wetlands (2016) 36:201–213DOI 10.1007/s13157-015-0730-7ORIGINAL RESEARCHA Framework to Combine Three Remotely Sensed DataSources for Vegetation Mapping in the CentralFlorida EvergladesCaiyun Zhang 1 & Donna Selch 1 & Hannah Cooper 1Received: 29 September 2015 / Accepted: 21 December 2015 / Published online: 29 December 2015# Society of Wetland Scientists 2015Abstract A framework was designed to integrate three complimentary remotely sensed data sources (aerial photography,hyperspectral imagery, and LiDAR) for mapping vegetation inthe Florida Everglades. An object-based pixel/feature-levelfusion scheme was developed to combine the three datasources, and a decision-level fusion strategy was applied toproduce the final vegetation map by ensemble analysis ofthree classifiers k-Nearest Neighbor (k-NN), Support VectorMachine (SVM), and Random Forest (RF). The frameworkwas tested to map 11 land-use/land-cover level vegetationtypes in a portion of the central Florida Everglades. An informative and accurate vegetation map was produced with anoverall accuracy of 91.1 % and Kappa value of 0.89. A combination of the three data sources achieved the best resultcompared with applying aerial photography alone, or a synergy of two data sources. Ensemble analysis of three classifiersnot only increased the classification accuracy, but also generated a complementary uncertainty map for the final classifiedvegetation map. This uncertainty map was able to identifyregions with a high robust classification, as well as areaswhere classification errors were most likely to occur.Keywords Data fusion . Ensemble analysis . Uncertaintyanalysis . Wetland land-use/land-cover level vegetationmapping* Caiyun Zhangczhang3@fau.edu1Department of Geosciences, Florida Atlantic University, 777 GladesRoad, Boca Raton, FL 33431, USAIntroductionSignificance of Vegetation Mapping in the FloridaEvergladesThe Florida Everglades is the largest subtropical wetland inthe USA. It has a unique ecosystem that supports many threatened and endangered species. In the past century, human activities severely modified this imperiled ecosystem, resultingin many environmental issues in South Florida (e.g.,McPherson and Halley 1996). In 2000 the U.S. Congress authorized the Comprehensive Everglades Restoration Plan(CERP) to restore the Everglades ecosystem (CERP 2015).CERP is expected to take 30 or more years to complete.Many on-going and completed projects in CERP require accurate and informative vegetation maps because restorationwill cause dramatic modification to plant communities(Doren et al. 1999). The effects and progress of restorationcan be measured by monitoring changes in vegetation communities (Jones 2011). Therefore, vegetation maps derivedfrom remotely sensed data serve as valuable tools forassessing CERP restoration efforts.Efforts of Automated Vegetation Mapping in the FloridaEvergladesVegetation maps in support of CERP are mainly from manualinterpretation of large-scale aerial photographs using analytical stereo plotters (Rutchey et al. 2008). This procedure istime-consuming and labor-intensive. To address this issue,several efforts have been made to automate vegetation mapping through digital image analysis. Such efforts can begrouped into three categories. The first is the application ofsingle-source remotely sensed data such as multispectral imagery (Rutchey and Vilchek 1994, 1999; Jensen et al. 1995;
202Szantoi et al. 2015) and hyperspectral imagery (Hirano et al.2003; Zhang and Xie 2012, 2013). Studies have shown thatmost available remotely sensed imagery (e.g., Landsat) couldnot generate classifications with reasonable accuracies in theEverglades due to limitations of spatial or spectral resolution.High spatial resolution (i.e., 5 meters or smaller) hyperspectralimagery is powerful in vegetation characterization over thisregion (Zhang and Xie 2012, 2013), but data collection iscostly. The second is the employment of a combination ofsingle-source remotely sensed imagery with ancillary datasuch as environmental variables, hydrological variables, andsoil data (Griffin et al. 2011; Szantoi et al. 2013). The third isthe application of multi-source remotely sensed data throughdata fusion techniques (Zhang et al. 2013; Zhang and Xie2014; Zhang 2014), which integrate data and informationfrom multiple sources to achieve refined/improved information for decision making (Gómez-Chova et al. 2015). With theincreasing availability of multi-sensor, multi-temporal, andmulti-resolution images, data fusion has become a valuabletool for updating wetland inventory (Kloiber et al. 2015).Potential of Fusing Three Remotely Sensed Data Sourcesfor Vegetation MappingFor this study we combined three data sources for vegetationmapping including 1-m fine spatial resolution aerial photography, 30-m Earth Observing-1 (EO-1)/Hyperionhyperspectral imagery, and Light Detection And Ranging(LiDAR) data. High spatial resolution aerial photos can provide important spatial information such as texture for vegetation discrimination, but application of 1-m aerial photographyalone could not produce requisite accuracy in the Everglades(Zhang and Xie 2014). Application of very high aerial imagery (20–30 centimeters) can achieve good results (Szantoi etal. 2013, 2015), but this type of data is scarce in theEverglades. Hyperspectral sensors are more powerful thantraditional multispectral sensors in vegetation mapping dueto their rich radiometric content (Thenkabail et al. 2011).The application of hyperspectral data has become an important area of research for wetland mapping (Adam et al. 2010).However, most of the available hyperspectral sensors such asthe in-orbit spaceborne EO-1/Hyperion collect data with arelatively coarse spatial resolution (i.e., 30 meters or lower).This limits their application in the Everglades because vegetation has a high spatial and spectral heterogeneity wheresmall patches or linear/narrow shaped vegetation covers cannot be clearly defined. LiDAR contains useful information forvegetation characterization (Lewis and Hancock 2007) andhigh-posting-density (i.e., 4 pts/m2) LiDAR has been frequently combined with optical imagery to improve vegetationclassification (e.g., Onojeghuo and Blackburn 2011; Zhangand Qiu 2012). However, little work has been conducted toinclude low-posting-density (i.e., 2 pts/m2) LiDAR in theWetlands (2016) 36:201–213classification (Ke et al. 2010), especially for wetland mapping(Zhang et al. 2013; Zhang 2014). Low-posting-densityLiDAR may improve vegetation classification in the uniqueEverglades environment.In general, aerial photography, hyperspectral imagery,and LiDAR data have their pros and cons. High spatialresolution aerial photography is able to provide valuablespatial information and delineate a target boundary, but itcannot effectively discriminate the target due to coarsespectral resolution (Shaw and Burke 2003).Hyperspectral systems with a medium spatial resolution,such as EO-1/Hyperion, are powerful at identifying objects, but are not configured to map heterogeneous landscapes such as in the Everglades. LiDAR can complementspectral information by providing useful elevation information to improve vegetation identification (Zhang et al.2013). A potential drawback worth mentioning is that thesuccessful inclusion of low-posting-density LiDAR in theclassification largely depends on the methods forextracting LiDAR features. Overall, these three remotesensing systems carry complimentary information, andthe synergy between them has potential to automate vegetation mapping in the Everglades.ObjectivesThe main objective of this study is to explore the potential offusing aerial photography, hyperspectral imagery, and LiDARfor vegetation mapping in the Florida Everglades. To effectively fuse three data sources, object-based image analysis(OBIA), machine learning and ensemble analysis techniqueswere applied. Traditional pixel-based methods may lead to theBsalt-and-pepper effect in mapping heterogeneous landscapes. This issue can be overcome by OBIA techniqueswhich first decompose an image scene into relatively homogeneous object areas and then classify these object areas instead of pixels (Blaschke 2010). Three machine learning classifiers k-Nearest Neighbor (k-NN), Support Vector Machine(SVM), and Random Forest (RF) have proven useful in classifying hyperspectral imagery and combined multi-sourcedatasets (e.g., Chan and Paelinckx 2008; Waske et al. 2009;Mountrakis et al. 2010; Kloiber et al. 2015). In this study theirperformance was evaluated for classifying the fused datasetfrom three data sources. Recent studies have illustrated that anensemble analysis of multiple classifiers may improve theclassification or generate a more robust result (Zhang 2014,2015). In addition, ensemble analysis can provide an uncertainty map to complement the traditional accuracy assessmenttechniques in remote sensing (Zhang 2014). To further understand the uncertainty analysis from multiple classifiers, ensemble analysis was also explored. The specific objectivesof this study are 1) to design a framework to combine threetypes of remotely sensed datasets for complex wetland
Wetlands (2016) 36:201–213mapping; and 2) to examine the benefits of ensemble analysisof multiple classifiers, as well as the potential of the uncertainty map from ensemble analysis in accuracy assessment.Study Area and DataStudy AreaThe study site is a portion of Caloosahatchee River watershedin the central Florida Everglades (Fig. 1). The Evergladesoccupies most of the southern peninsula of Florida and extends southward from Lake Okeechobee into the Gulf ofMexico. Lake Okeechobee serves as the Bwater heart forthe Everglades, and the Caloosahatchee River functions as aprimary canal that conveys basin runoff and regulatory releases from Lake Okeechobee. The hydrology of this regionhas been severely changed because many canals were constructed along the banks of the river to support the agriculturalcommunities associated with the river. BGet the water right inthe Caloosahatchee watershed is a key component in CERP.Response of the plant community in this region is a crucialindicator of the restoration success and detailed vegetationmaps can guide the path of restoration. The selected sitecovers an area of about 30 km2 presenting a total of elevenland-use/land-cover level vegetation communities which aredescribed in Table 1.DataData sources include digital aerial photography, EO-1/Hyperion hyperspectral imagery, LiDAR, and referencedata. Fine spatial resolution aerial photographs were collected in November 2004 by the National AerialPhotography Program (NAPP). The U. S. GeologicalSurvey (USGS) orthorectified these aerial photos into dataproducts known as Digital Orthophoto Quarter Quads(DOQQs). The accuracy and quality of DOQQs meetNational Map Accuracy Standards (NMAS). DOQQs withfour spectral channels (Red, Green, Blue, and NIR) in aspatial resolution of 1 meter were used in this study. Acolor infrared composite of DOQQs for the study site isshown in Fig. 1.Hyperspectral imagery was collected in October 2005by the Hyperion Imaging Spectrometer onboard the EO-1spacecraft. EO-1/Hyperion is the first spacebornehyperspectral sensor acquiring imagery in 242 contiguousspectral bands (0.4–2.5 μm) with a spatial resolution of30 meters. The mission of EO-1/Hyperion is to evaluateon-orbit issues for imaging spectroscopy and to assess thecapabilities of a spaceborne imaging spectrometer forEarth science and observation (Folkman et al. 2001).USGS has conducted the radiometric and systematic203geometric corrections for the raw scenes. Thepreprocessed data are delivered to users as the Level 1Gst products.LiDAR data were collected using Leica ALS-50 system inDecember 2007 to support the Florida Division of EmergencyManagement. The Leica ALS-50 LiDAR system collectssmall footprint multiple returns, and intensity at 1060 nmwavelength. The average point density for the study area is1.2 pts/m2. The original LiDAR point cloud data were processed by the vendor to generate the Digital Terrain Model(DTM) using Merrick Advanced Remote Sensing processingsoftware. All the LiDAR point cloud data and DTM are available to the public at the International Hurricane ResearchCenter website. Aerial photographs, hyperspectral data, andLiDAR were collected during the dry season (from Novemberto April) and within a reasonable time span, which provides agood basis for evaluating vegetation mapping using data fusion techniques.The South Florida Water Management District (SFWMD)(one partner in CERP) provided a digital vegetation map forthis study. This vegetation map was built by the manual photointerpretation of 2004–2005 NAPP aerial photographs. Themodified Florida Land Use, Land Cover ClassificationSystem was used in the interpretation. Features were stereoscopically interpreted using a stereo plotter and calibratedfrom field surveys. The reference data was compiled on screenover DOQQs, the same digital aerial photographs as thoseused in this study. The positional accuracy of the data meetsthe NMAS.We randomly selected 738 image objects as the referencedata for the study area. The number of reference objects foreach class is listed in Table 1. The image objects were produced by segmenting the 1-m aerial photography, which aredetailed in next section. We followed a spatially stratified datasampling strategy, in which a fixed percentage of sampleswere selected for each class. The number of reference objectsfor each class was estimated based on the image segmentationresults and the digital vegetation map. The selected referenceobjects were manually labeled and refined by jointly checkingthe digital vegetation map, aerial photography, andhyperspectral imagery. The selected reference objects for eachclass were split into two halves with one for calibration andthe other for validation. Non-vegetation objects were maskedout using the digital vegetation map since the main concern ofthis study was vegetation.MethodologyData PreprocessingLow-signal-noise ratio bands, uncalibrated bands, andsevere stripping bands of the EO-1/Hyperion imagery
204Wetlands (2016) 36:201–213Fig. 1 Map of the Florida Everglades (a), and study site shown as a color infrared (CIR) 1-meter aerial photography (b), and a color composite from the30-meter EO-1/Hyperion imagery (Bands 40, 30, and 20 as red, green and blue, respectively) (c)were dropped, leaving 125 usable bands covering visible,near-infrared, and shortwave infrared for further analysis.After the noisy band elimination, an image-to-image registration was employed to georeference the hyperspectraldata using the aerial photography. Hyperspectral data hasa high dimensionality and contains a tremendous amountof redundant spectral information. The Minimum NoiseFraction (MNF) method (Green et al. 1988) is commonlyused to reduce the high dimensionality and inherentnoise of hyperspectral data. Previous studies have shownthat MNF transformed data can significantly improve theaccuracy of vegetation mapping in the EvergladesTable 1(Zhang and Xie 2012). We thus conducted the MNFtransformation for the hyperspectral imagery and selectedthe first nine MNF eigenimages which were the mostuseful and spatially coherent layers. For LiDAR dataprocessing, the topographic effect was eliminated firstby subtracting the Digital Terrain Model (DTM) valueunderneath each point from the elevation. This is knownas data normalization in LiDAR remote sensing. Pointswith a normalized elevation less than 0.5 foot were considered as ground points and were not used in furtheranalysis. Four DOQQ tiles were mosaicked and clippedfor the study site.Vegetation communities and the number of reference image objects for each vegetation community in the study siteVegetation typesNumber of referenceobjectsDominant species1. Improved pastures2. Unimproved pastures3. Woodland pastures4. Field crops5. Citrus groves6. Upland shrub and brushland92325611014287. Palmetto prairies8. Mixed rangeland20229. Pine flatwoods25210. Mixed Wetland shrubs11. Freshwater marshes and wet prairies1894Dominated by a single grass speciesDominated by a variety of native grassesDominated by a variety of native tree and shrub speciesDominated by hay, grasses and sugar caneOranges, grapefruits and tangerinesCommon species include gallberry, wax myrtle, saltbush,blueberries, rusty lyonia, fetterbush and other shrubs andbrush, as well as various types of short herbs and grassesDominated by Saw palmettoA mixture of herbaceous species and shrubs such as fetterbush,rusty Lyonia, dwarf blueberry and wax myrtleDominant species include slash pine, saw palmetto, gall berryand various grassesA mixture of various shrubsDominated by herbaceous vegetation
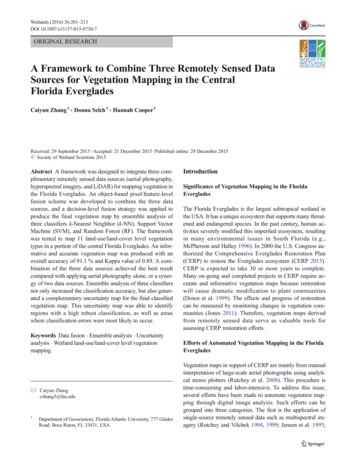
Wetlands (2016) 36:201–213205A Framework to Combine Three Remotely Sensed DataSourcesFor this study a framework was designed to fuse threeremotely sensed data to effectively map vegetation inthe Everglades, as shown in Fig. 2. Data fusion methodscan be grouped into three categories: pixel-, feature-, anddecision-level fusion (Gómez-Chova et al. 2015). Pixellevel fusion combines raw data from multiple sources intosingle resolution data to improve the performance of image processing tasks. Information may be lost during thedata resampling procedure if the spatial resolution of input data sources is different (Solberg 2006). Feature-levelfusion extracts features (e.g., textures) from each individual data source and merges these features into one ormore feature maps for further processing. Decision-levelfusion conducts a preliminary classification for each individual data source first, and then combines the classification results into one outcome. Researchers most commonly adopt the pixel-level fusion method. For example, tocombine LiDAR data with optical imagery, raster surfacesare generated first from LiDAR point clouds, and thencombined with the optical imagery pixel by pixel. A major problem with using LiDAR in this way is theFig. 2 The designed frameworkto combine three remotely senseddata sources for wetlandvegetation mappingintroduction of error in the raster surface generation step(Smith et al. 2004), which will ultimately affect the classification result. To overcome this problem, it is desirableto extract LiDAR elevation and intensity information fromthe original point cloud data.Our designed framework combines all three data fusionmethods in the mapping procedure. In the framework, thefine spatial resolution aerial photography is segmented firstto generate image objects and extract object features (i.e.,textures), which is detailed in next subsection. The extractedfeatures are then combined with pixel-level values ofhyperspectral data. This is achieved by first calculating amean spectrum of hyperspectral pixels which are within animage object and then integrating the mean spectrum withthe extracted aerial features of this object. For the LiDARdata, three types of information can be extracted: elevation,intensity, and topography. For each image object, LiDARdescriptive statistics (minimum, maximum, mean, and standard deviation) of elevation and intensity are calculatedusing all the non-ground vegetation points within an imageobject. Similarly, descriptive statistics of terrain elevationand slope for each image object are derived from theDTM using pixels within an object (Fig. 2). Recent studies(Zhang et al. 2013; Zhang 2014) have illustrated thatHyperspectralImagery(30 m)AerialPhotography(1 m)Noise EliminationMNF TransformationSegmentationNormalized Point CloudMNF ImageryImage ObjectsTexturesNon-ground Point CloudFused Hyperspectral and AerialPhotographLiDARPoint CloudLiDARDTMObject-based LiDAR Descriptors (LiDARElevation, Intensity and TopographicFeatures)Pixel/feature-level fusionUncertainty Map(output)k-NNFinal Fused DatasetSVMDecision FusionRFClassified Map (output)Validation Data(Input)Map Accuracy(output)
206extraction of LiDAR descriptors in this way is an effectiveapproach for applying the low-posting-density LiDAR intothe vegetation classification. All the LiDAR-derived featuresfor each object are then joined with the pixel-level values ofthe hyperspectral imagery and feature-level of the aerial photograph, leading to a final fused dataset from three datasources. The fusion procedure combines pixel- and featurelevel fusion methods at the object level, and thus this fusionscheme is referred to as the object-based pixel/feature-levelfusion. Three machine learning classifiers (k-NN, SVM, andRF) are used to pre-classify the final fused dataset. Theultimate outcome is derived from ensemble analysis of threeclassification results using a decision-level fusion strategy.Note that our decision-level fusion strategy is based on classification results of the fused dataset, rather than making adecision from classification results of the individual datasources. The latter is commonly used in data fusion.Consequently, an object-based vegetation map is generatedand evaluated by common accuracy assessment approaches.The ensemble analysis of three classification results alsoproduces an uncertainty map which defines the confidenceof the classification for each image object.Five advantages are expected from the designed framework. First, no information is lost in the fusion strategy because there is no image resampling in the procedure. Commonimage fusion methods resample the fine spatial resolution (i.e.,1 meter) into medium-spatial resolution imagery (i.e., 30 meter) and then fuse two images pixel by pixel. This may losevaluable information in the fine spatial resolution imagery.Second, the local noise and heterogeneity can be effectivelyreduced. The remotely sensed signal for a pixel is affected bythe surrounding pixels. Speckle frequently occurs due to intrinsic spectral variations. Using the averaged values all pixelswithin an object can reduce this effect, as well as the influenceof marginal and unusually colored pixels (Dronova 2015).Third, additional object-based spatial information (i.e., texture) can be extracted from aerial photographs, which is usefulin vegetation classification. Forth, small patches and linear/narrow shaped vegetation covers may be delineated due tothe fine spatial resolution of aerial photograph. Applicationof 30-meter image alone is not able to delineate this type offeatures. Last, errors and uncertainties in the LiDAR data processing can be avoided because the original LiDAR pointclouds are used instead of the LiDAR-generated raster layers.In addition, the object-based pixel/feature-level fusion schemecan also reduce the stripping effect caused by the calibrationdifference (Goodenough et al. 2003) in the EO-1/Hyperionsensor. The designed fusion scheme adopts the mean spectrumof the hyperspectral pixels within an object, which can helpBsmooth the stripping over the segmented region, leading toa relatively homogeneous stripping effect across the entirescene. In this way the impact of stripping of EO-1/Hyperionin the classification can be reduced.Wetlands (2016) 36:201–213Image Segmentation and Feature Extraction of AerialPhotographImage segmentation is a major step in the designed framework. We used the multiresolution segmentation algorithmin eCognition Developer 9.0 (Trimble 2014) to generate image objects from the aerial photography. The segmentationalgorithm starts with one-pixel image segments, and mergesneighboring segments together until a heterogeneity thresholdis reached. The heterogeneity threshold is determined by auser-defined scale parameter, as well as color/shape andsmoothness/compactness weights. The scale parameter is anabstract term that determines the maximum allowed heterogeneity for the resulting objects. It decides the size of the objectswith a small value generating more objects (small size), and ahigh value creating less objects (big size). The image segmentation is scale-dependent, and the quality of segmentation andclassification depend on the scale of the segmentation. To findan optimal scale for image segmentation, an unsupervisedimage segmentation evaluation approach (Johnson and Xie2011) was used. A scale of 60 was found to be optimal forthe selected site and thus was used in this study. The minimummapping unit is the smallest image object created from thisscale parameter, which is 68 m2 for the study site. Four spectral channels of the aerial photography were set to equalweights. Color/shape weights were set to 0.9/1.0 so that spectral information would be considered most heavily for segmentation. Smoothness/compactness weights were set to 0.5/0.5 so as to not favor either compact or non-compact segments. Following segmentation, object-based features of theaerial photograph were extracted. We extracted first-order andsecond-order metrics for each band of aerial photograph including mean, standard deviation, contrast, dissimilarity, homogeneity, entropy, and angular second moment. The greylevel co-occurrence matrix (GLCM) algorithm was used toextract the second-order texture measures. Detailed algorithms can be found in Trimble (2014). These features fromaerial photograph have proven valuable for vegetation mapping in the Everglades (Szantoi et al. 2013; Zhang et al. 2013;Zhang and Xie 2014; Szantoi et al. 2015) and thus were usedfor this study.k-NN, SVM, and RF ClassifiersIn the framework k-NN, SVM, and RF classifiers areemployed to pre-classify the final fused dataset. k-NN is asupervised classifier which identifies objects based on theclosest training samples in the feature space. It searches awayfrom the unknown object to be classified in all directions untilit encounters k user-specified training objects. It then assignsthe object to the class with the majority vote of the encountered objects. SVM is a non-parametric supervised machinelearning classifier. The aim of SVM is to find a hyperplane
Wetlands (2016) 36:201–213207for an input object, then the object will be assigned to the samevoted class. An uncertainty map can also be derived from theensemble analysis of three classifiers. If three classifiers votethe same class for an unknown image object, a complete agreement will be achieved. Conversely if three votes are completely different, no agreement will be obtained. If only two classifiers vote for the same class, a partial agreement will be produced. Consequently the uncertainty map will be produced inconjunction with the final classified map from the ensembleanalysis.that can separate the input dataset into a discrete predefinednumber of classes in a fashion consistent with the trainingsamples (Vapnik 1995). SVM research in remote sensing hasincreased in the past decade, as reviewed by Mountrakis et al.(2010). Detailed descriptions of SVM algorithms were givenby Huang et al. (2002) in the context of remote sensing.Kernel based SVMs are commonly used in classification,among which the radial basis function (RBF) and the polynomial kernels are frequently employed. RBF needs to set thekernel width (γ), and the polynomial kernel needs to set thedegree (p). Both kernels need to define a penalty parameter(C) that controls the degree of acceptable misclassification(Hsu et al. 2010). Both kernels were tested in this study tofind the best model for the final fused dataset. RF is a decisiontree based ensemble classifier which is valuable in processinghyperspectral imagery. Detailed descriptions of RF can befound in Breiman (2001) and in a remote sensing context byChan and Paelinckx (2008). Two parameters need to be defined in RF: the number of decision trees to create (k) and thenumber of randomly selected variables (M) considered forsplitting each node in a tree. RF is not sensitive to M and itpffiffiffiffiffiis often blindly set to M (Gislason et al. 2006). k is often setbased on trial and error.The error matrix and Kappa statistic (Congalton and Green2009) has served as the standard approach in accuracy assessment. An error matrix was constructed for the final classifiedmap and the Kappa statistics were calculated. To evaluate thestatistical significance of differences in accuracy between different classifications, the nonparametric McNemar test(Foody 2004) was adopted. The difference in accuracy for apair of classifications is considered as being statistically significant at a confidence of 95 % if z-score is larger than 1.96 inthe McNemar test.Ensemble AnalysisResultsIn the framework ensemble analysis is employed to generatethe final vegetation map from the outputs of k-NN, SVM, andRF. An ensemble analysis approach is a multiple classificationsystem that combines the outputs of several classifiers. Theclassifiers in the system should generally produce accurateresults but show some differences in classification accuracy(Du et al. 2012). A range of strategies were developed to combine the outputs from multiple classifiers. Among them themajority vote (each individual classifier votes for an unknowninput object) is straightforward. A key problem of the majorityvote is that all the classifiers have equal rights to vote withoutconsidering their performances on each individual class. Aweighting strategy may mitigate this problem by weightingthe decision from each classifier based on their accuracies obtained from the reference data (Moreno-Seco et al. 2006). Forthis study the majority vote and the weighting strategy werecombined to analyze the outputs from three classifiers. If threevotes are different for an unknown object (e.g., k-NN votesclass 1, SVM votes class 2, and RF votes class 3), then theunknown object will be assigned to the class which has thehighest accuracy among the classifiers (e.g., class 3 becauseRF has the highest accuracy among k-NN, SVM, and RF inidentifying class 1, class 2, and class 3 respectively). That is,the classifier with the best performance among three votes willobtain a weight of 1, while weights of the other two classifierswill be set
can be measured by monitoring changes in vegetation com-munities (Jones 2011). Therefore, vegetation maps derived from remotely sensed data serve as valuable tools for assessing CERP restoration efforts. Efforts of Automated Vegetation Mapping in the Florida Everglades Vegetation mapsin support ofCERP are mainlyfrommanual