Transcription
Wireshark Lab: IP v7.0Supplement to Computer Networking: A Top-DownApproach, 7th ed., J.F. Kurose and K.W. Ross“Tell me and I forget. Show me and I remember. Involve me and Iunderstand.” Chinese proverb 2005-2016, J.F Kurose and K.W. Ross, All Rights ReservedIn this lab, we’ll investigate the IP protocol, focusing on the IP datagram. We’ll do so byanalyzing a trace of IP datagrams sent and received by an execution of the tracerouteprogram (the traceroute program itself is explored in more detail in the WiresharkICMP lab). We’ll investigate the various fields in the IP datagram, and study IPfragmentation in detail.Before beginning this lab, you’ll probably want to review sections 1.4.3 in the text1 andsection 3.4 of RFC 2151 [ftp://ftp.rfc-editor.org/in-notes/rfc2151.txt] to update yourselfon the operation of the traceroute program. You’ll also want to read Section 4.3 inthe text, and probably also have RFC 791 [ftp://ftp.rfc-editor.org/in-notes/rfc791.txt] onhand as well, for a discussion of the IP protocol.1. Capturing packets from an execution of tracerouteIn order to generate a trace of IP datagrams for this lab, we’ll use the tracerouteprogram to send datagrams of different sizes towards some destination, X. Recall thattraceroute operates by first sending one or more datagrams with the time-to-live(TTL) field in the IP header set to 1; it then sends a series of one or more datagramstowards the same destination with a TTL value of 2; it then sends a series of datagramstowards the same destination with a TTL value of 3; and so on. Recall that a router mustdecrement the TTL in each received datagram by 1 (actually, RFC 791 says that therouter must decrement the TTL by at least one). If the TTL reaches 0, the router returnsan ICMP message (type 11 – TTL-exceeded) to the sending host. As a result of thisbehavior, a datagram with a TTL of 1 (sent by the host executing traceroute) willcause the router one hop away from the sender to send an ICMP TTL-exceeded messageback to the sender; the datagram sent with a TTL of 2 will cause the router two hops1References to figures and sections are for the 7th edition of our text, Computer Networks, A Top-downApproach, 7th ed., J.F. Kurose and K.W. Ross, Addison-Wesley/Pearson, 2016.
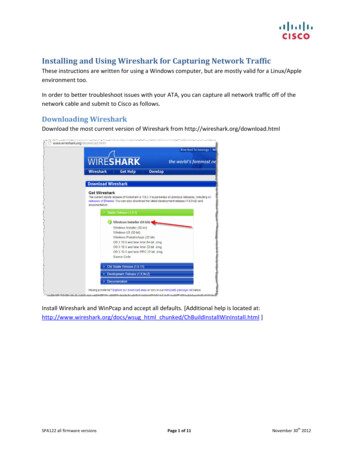
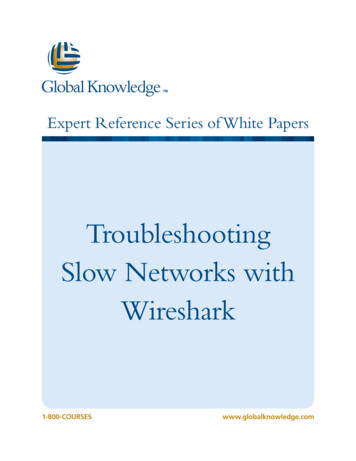
away to send an ICMP message back to the sender; the datagram sent with a TTL of 3will cause the router three hops away to send an ICMP message back to the sender; andso on. In this manner, the host executing traceroute can learn the identities of therouters between itself and destination X by looking at the source IP addresses in thedatagrams containing the ICMP TTL-exceeded messages.We’ll want to run traceroute and have it send datagrams of various lengths. Windows. The tracert program (used for our ICMP Wireshark lab) providedwith Windows does not allow one to change the size of the ICMP echo request(ping) message sent by the tracert program. A nicer Windows tracerouteprogram is pingplotter, available both in free version and shareware versions athttp://www.pingplotter.com. Download and install pingplotter, and test it out byperforming a few traceroutes to your favorite sites. The size of the ICMP echorequest message can be explicitly set in pingplotter by selecting the menu itemEdit- Options- Packet Options and then filling in the Packet Size field. Thedefault packet size is 56 bytes. Once pingplotter has sent a series of packets withthe increasing TTL values, it restarts the sending process again with a TTL of 1,after waiting Trace Interval amount of time. The value of Trace Interval and thenumber of intervals can be explicitly set in pingplotter.Linux/Unix/MacOS. With the Unix/MacOS traceroute command, the sizeof the UDP datagram sent towards the destination can be explicitly set byindicating the number of bytes in the datagram; this value is entered in thetraceroute command line immediately after the name or address of thedestination. For example, to send traceroute datagrams of 2000 bytestowards gaia.cs.umass.edu, the command would be:%traceroute gaia.cs.umass.edu 2000Do the following: Start up Wireshark and begin packet capture (Capture- Start) and then press OKon the Wireshark Packet Capture Options screen (we’ll not need to select anyoptions here). If you are using a Windows platform, start up pingplotter and enter the name of atarget destination in the “Address to Trace Window.” Enter 3 in the “# of times toTrace” field, so you don’t gather too much data. Select the menu item Edit Advanced Options- Packet Options and enter a value of 56 in the Packet Sizefield and then press OK. Then press the Trace button. You should see apingplotter window that looks something like this:
Next, send a set of datagrams with a longer length, by selecting Edit- AdvancedOptions- Packet Options and enter a value of 2000 in the Packet Size field andthen press OK. Then press the Resume button.Finally, send a set of datagrams with a longer length, by selecting Edit Advanced Options- Packet Options and enter a value of 3500 in the Packet Sizefield and then press OK. Then press the Resume button.Stop Wireshark tracing. If you are using a Unix or Mac platform, enter three traceroute commands,one with a length of 56 bytes, one with a length of 2000 bytes, and one with alength of 3500 bytes.Stop Wireshark tracing.If you are unable to run Wireshark on a live network connection, you can download apacket trace file that was captured while following the steps above on one of the author’sWindows computers2. You may well find it valuable to download this trace even ifyou’ve captured your own trace and use it, as well as your own trace, when you explorethe questions below.2Download the zip file traces.zip and extract the file ipethereal-trace-1. The traces in this zip file were collected by Wireshark running on one of the author’scomputers, while performing the steps indicated in the Wireshark lab. Once you have downloaded thetrace, you can load it into Wireshark and view the trace using the File pull down menu, choosing Open, andthen selecting the ip-ethereal-trace-1 trace file.
2. A look at the captured traceIn your trace, you should be able to see the series of ICMP Echo Request (in the case ofWindows machine) or the UDP segment (in the case of Unix) sent by your computer andthe ICMP TTL-exceeded messages returned to your computer by the intermediaterouters. In the questions below, we’ll assume you are using a Windows machine; thecorresponding questions for the case of a Unix machine should be clear. Wheneverpossible, when answering a question below you should hand in a printout of the packet(s)within the trace that you used to answer the question asked. When you hand in yourassignment, annotate the output so that it’s clear where in the output you’re getting theinformation for your answer (e.g., for our classes, we ask that students markup papercopies with a pen, or annotate electronic copies with text in a colored font).To print apacket, use File- Print, choose Selected packet only, choose Packet summary line, andselect the minimum amount of packet detail that you need to answer the question.1. Select the first ICMP Echo Request message sent by your computer, and expandthe Internet Protocol part of the packet in the packet details window.What is the IP address of your computer?2. Within the IP packet header, what is the value in the upper layer protocol field?3. How many bytes are in the IP header? How many bytes are in the payload of theIP datagram? Explain how you determined the number of payload bytes.4. Has this IP datagram been fragmented? Explain how you determined whether ornot the datagram has been fragmented.
Next, sort the traced packets according to IP source address by clicking on the Sourcecolumn header; a small downward pointing arrow should appear next to the word Source.If the arrow points up, click on the Source column header again. Select the first ICMPEcho Request message sent by your computer, and expand the Internet Protocol portionin the “details of selected packet header” window. In the “listing of captured packets”window, you should see all of the subsequent ICMP messages (perhaps with additionalinterspersed packets sent by other protocols running on your computer) below this firstICMP. Use the down arrow to move through the ICMP messages sent by your computer.5. Which fields in the IP datagram always change from one datagram to the nextwithin this series of ICMP messages sent by your computer?6. Which fields stay constant? Which of the fields must stay constant? Which fieldsmust change? Why?7. Describe the pattern you see in the values in the Identification field of the IPdatagramNext (with the packets still sorted by source address) find the series of ICMP TTLexceeded replies sent to your computer by the nearest (first hop) router.8. What is the value in the Identification field and the TTL field?9. Do these values remain unchanged for all of the ICMP TTL-exceeded replies sentto your computer by the nearest (first hop) router? Why?FragmentationSort the packet listing according to time again by clicking on the Time column.10. Find the first ICMP Echo Request message that was sent by your computer afteryou changed the Packet Size in pingplotter to be 2000. Has that message beenfragmented across more than one IP datagram? [Note: if you find your packet hasnot been fragmented, you should download the zip ark-traces.zip and extract the ipethereal-trace-1packet trace. If your computer has an Ethernet interface, a packetsize of 2000 should cause fragmentation.3]11. Print out the first fragment of the fragmented IP datagram. What information inthe IP header indicates that the datagram been fragmented? What information inthe IP header indicates whether this is the first fragment versus a latter fragment?How long is this IP datagram?3The packets in the ip-ethereal-trace-1 trace file in races.zip are all less that 1500 bytes. This is because the computer on which the trace was gathered has anEthernet card that limits the length of the maximum IP packet to 1500 bytes (40 bytes of TCP/IP headerdata and 1460 bytes of upper-layer protocol payload). This 1500 byte value is the standard maximumlength allowed by Ethernet. If your trace indicates a datagram longer 1500 bytes, and your computer isusing an Ethernet connection, then Wireshark is reporting the wrong IP datagram length; it will likely alsoshow only one large IP datagram rather than multiple smaller datagrams. This inconsistency in reportedlengths is due to the interaction between the Ethernet driver and the Wireshark software. We recommendthat if you have this inconsistency, that you perform this lab using the ip-ethereal-trace-1 trace file.
12. Print out the second fragment of the fragmented IP datagram. What information inthe IP header indicates that this is not the first datagram fragment? Are the morefragments? How can you tell?13. What fields change in the IP header between the first and second fragment?Now find the first ICMP Echo Request message that was sent by your computer after youchanged the Packet Size in pingplotter to be 3500.14. How many fragments were created from the original datagram?15. What fields change in the IP header among the fragments?
datagrams containing the ICMP TTL-exceeded messages. We'll want to run traceroute and have it send datagrams of various lengths. Windows. The tracert program (used for our ICMP Wireshark lab) provided with Windows does not allow one to change the size of the ICMP echo request (ping) message sent by the tracert program. A nicer Windows .