Transcription
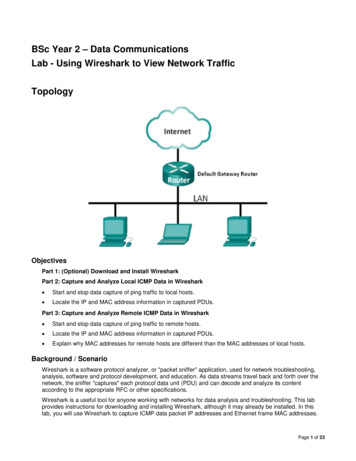
BSc Year 2 – Data CommunicationsLab - Using Wireshark to View Network TrafficTopologyObjectivesPart 1: (Optional) Download and Install WiresharkPart 2: Capture and Analyze Local ICMP Data in Wireshark Start and stop data capture of ping traffic to local hosts. Locate the IP and MAC address information in captured PDUs.Part 3: Capture and Analyze Remote ICMP Data in Wireshark Start and stop data capture of ping traffic to remote hosts. Locate the IP and MAC address information in captured PDUs. Explain why MAC addresses for remote hosts are different than the MAC addresses of local hosts.Background / ScenarioWireshark is a software protocol analyzer, or "packet sniffer" application, used for network troubleshooting,analysis, software and protocol development, and education. As data streams travel back and forth over thenetwork, the sniffer "captures" each protocol data unit (PDU) and can decode and analyze its contentaccording to the appropriate RFC or other specifications.Wireshark is a useful tool for anyone working with networks for data analysis and troubleshooting. This labprovides instructions for downloading and installing Wireshark, although it may already be installed. In thislab, you will use Wireshark to capture ICMP data packet IP addresses and Ethernet frame MAC addresses.Page 1 of 23
Lab - Using Wireshark to View Network TrafficRequired Resources 1 PC (Windows 7or 8 , Vista, or XP with Internet access) Additional PC(s) on a local-area network (LAN) will be used to reply to ping requests.Part 1:(Optional) Download and Install WiresharkWireshark has become the industry standard packet-sniffer program used by network engineers. This opensource software is available for many different operating systems, including Windows, Mac, and Linux. In Part1 of this lab, you will download and install the Wireshark software program on your PC.Note: If Wireshark is already installed on your PC, you can skip Part 1 and go directly to Part 2.Step 1: Download Wireshark.a. Wireshark can be downloaded from www.wireshark.org.b. Click Download Wireshark.Page 2 of 23
Lab - Using Wireshark to View Network Trafficc.Choose the software version you need based on your PC’s architecture and operating system. Forinstance, if you have a 64-bit PC running Windows, choose Windows Installer (64-bit).After making a selection, the download should start. The location of the downloaded file depends on thebrowser and operating system that you use. For Windows users, the default location is the Downloadsfolder.Step 2: Install Wireshark.a. The downloaded file is named Wireshark-win64-x.x.x.exe, where x represents the version number.Double-click the file to start the installation process.b. Respond to any security messages that may display on your screen. If you already have a copy ofWireshark on your PC, you will be prompted to uninstall the old version before installing the new version.It is recommended that you remove the old version of Wireshark prior to installing another version. ClickYes to uninstall the previous version of Wireshark.Page 3 of 23
Lab - Using Wireshark to View Network Trafficc.If this is the first time to install Wireshark, or after you have completed the uninstall process, you willnavigate to the Wireshark Setup wizard. Click Next.d. Continue advancing through the installation process. Click I Agree when the License Agreement windowdisplays.Page 4 of 23
Lab - Using Wireshark to View Network Traffice. Keep the default settings on the Choose Components window and click Next.f.Choose your desired shortcut options and click Next.Page 5 of 23
Lab - Using Wireshark to View Network Trafficg. You can change the installation location of Wireshark, but unless you have limited disk space, it isrecommended that you keep the default location.h. To capture live network data, WinPcap must be installed on your PC. If WinPcap is already installed onyour PC, the Install check box will be unchecked. If your installed version of WinPcap is older than theversion that comes with Wireshark, it is recommend that you allow the newer version to be installed byclicking the Install WinPcap x.x.x (version number) check box.i.Finish the WinPcap Setup Wizard if installing WinPcap.Page 6 of 23
Lab - Using Wireshark to View Network Trafficj.Wireshark starts installing its files and a separate window displays with the status of the installation. ClickNext when the installation is complete.k.Click Finish to complete the Wireshark install process.Page 7 of 23
Lab - Using Wireshark to View Network TrafficPart 2: Capture and Analyze Local ICMP Data in WiresharkIn Part 2 of this lab, you will ping another PC on the LAN and capture ICMP requests and replies inWireshark. You will also look inside the frames captured for specific information. This analysis should help toclarify how packet headers are used to transport data to their destination.Step 1: Retrieve your PC’s interface addresses.For this lab, you will need to retrieve your PC’s IP address and its network interface card (NIC) physicaladdress, also called the MAC address.a. Open a command window, type ipconfig /all, and then press Enter.b. Note your PC interface’s IP address and MAC (physical) address.c.Ask a team member for their PC’s IP address and provide your PC’s IP address to them. Do not providethem with your MAC address at this time.Step 2: Start Wireshark and begin capturing data.a. On your PC, click the Windows Start button to see Wireshark listed as one of the programs on the pop-upmenu. Double-click Wireshark.Page 8 of 23
Lab - Using Wireshark to View Network Trafficb. After Wireshark starts, click Interface List.Note: Clicking the first interface icon in the row of icons also opens the Interface List.c.On the Wireshark: Capture Interfaces window, click the check box next to the interface connected to yourLAN.Note: If multiple interfaces are listed and you are unsure which interface to check, click the Detailsbutton, and then click the 802.3 (Ethernet) tab. Verify that the MAC address matches what you noted inStep 1b. Close the Interface Details window after verifying the correct interface.Page 9 of 23
Lab - Using Wireshark to View Network Trafficd. After you have checked the correct interface, click Start to start the data capture.Information will start scrolling down the top section in Wireshark. The data lines will appear in differentcolors based on protocol.e. This information can scroll by very quickly depending on what communication is taking place betweenyour PC and the LAN. We can apply a filter to make it easier to view and work with the data that is beingcaptured by Wireshark. For this lab, we are only interested in displaying ICMP (ping) PDUs. Type icmp inthe Filter box at the top of Wireshark and press Enter or click on the Apply button to view only ICMP(ping) PDUs.Page 10 of 23
Lab - Using Wireshark to View Network Trafficf.This filter causes all data in the top window to disappear, but you are still capturing the traffic on theinterface. Bring up the command prompt window that you opened earlier and ping the IP addressthat you received from your team member. Notice that you start seeing data appear in the topwindow of Wireshark again.Note: If your team member’s PC does not reply to your pings, this may be because their PC firewall isblocking these requests. Please seePage 11 of 23
Lab - Using Wireshark to View Network TrafficAppendix A: Allowing ICMP Traffic Through a Firewall for information on how to allow ICMP traffic throughthe firewall using Windows 7.g. Stop capturing data by clicking the Stop Capture icon.Page 12 of 23
Lab - Using Wireshark to View Network TrafficStep 3: Examine the captured data.In Step 3, examine the data that was generated by the ping requests of your team member’s PC. Wiresharkdata is displayed in three sections: 1) The top section displays the list of PDU frames captured with asummary of the IP packet information listed, 2) the middle section lists PDU information for the frame selectedin the top part of the screen and separates a captured PDU frame by its protocol layers, and 3) the bottomsection displays the raw data of each layer. The raw data is displayed in both hexadecimal and decimal form.a. Click the first ICMP request PDU frames in the top section of Wireshark. Notice that the Source columnhas your PC’s IP address, and the Destination contains the IP address of the teammate’s PC you pinged.Page 13 of 23
Lab - Using Wireshark to View Network Trafficb. With this PDU frame still selected in the top section, navigate to the middle section. Click the plus sign tothe left of the Ethernet II row to view the Destination and Source MAC addresses.Does the Source MAC address match your PC’s interface?Does the Destination MAC address in Wireshark match the MAC address that of your team member’s?How is the MAC address of the pinged PC obtained by your PC?Note: In the preceding example of a captured ICMP request, ICMP data is encapsulated inside an IPv4packet PDU (IPv4 header) which is then encapsulated in an Ethernet II frame PDU (Ethernet II header)for transmission on the LAN.Part 3: Capture and Analyze Remote ICMP Data in WiresharkIn Part 3, you will ping remote hosts (hosts not on the LAN) and examine the generated data from thosepings. You will then determine what is different about this data from the data examined in Part 2.Step 1: Start capturing data on interface.a. Click the Interface List icon to bring up the list PC interfaces again.b. Make sure the check box next to the LAN interface is checked, and then click Start.Page 14 of 23
Lab - Using Wireshark to View Network Trafficc.A window prompts to save the previously captured data before starting another capture. It is notnecessary to save this data. Click Continue without Saving.d. With the capture active, ping the following three website URLs and answer questions on sheet.www.yahoo.com www.cisco.com www.google.comNote: When you ping the URLs listed, notice that the Domain Name Server (DNS) translates the URL toan IP address. Note the IP address received for each URL.Page 15 of 23
Lab - Using Wireshark to View Network Traffice. You can stop capturing data by clicking the Stop Capture icon.Page 16 of 23
Lab - Using Wireshark to View Network TrafficPart 4: FTP PDU CaptureStep 1: Start packet capture.Assuming Wireshark is still running from the previous steps, start packet capture by clicking on the Start option onthe Capture menu of Wireshark.At the command line on your computer running Wireshark, enter ftp ftp.heanet.ieWhen the connection is established, enter anonymous as the user without a password.Userid: anonymousPassword: ENTER Type bye to close the ftp session and stop the packet capture in Wireshark.Examine Packet Details.Select (highlight) a packet on the list associated with the first phase of the FTP process.View the packet details in the Details pane.What are the protocols encapsulated in the frame?Page 17 of 23
Lab - Using Wireshark to View Network TrafficHighlight the packets containing the user name and password.Examine the highlighted portion in the Packet Byte pane.What does this say about the security of this FTP login process?Part 4: HTTP PDU CaptureStep 1: Start packet capture.Assuming Wireshark is still running from the previous steps, start packet capture by clicking on the Start option onthe Capture menu of Wireshark.Note: Capture Options do not have to be set if continuing from previous steps of this lab.Launch a web browser on the computer that is running Wireshark.Enter the URL of a website eg. www.rte.ie . When the webpage has fully downloaded, stop the Wireshark packetcapture.Step 2: Increase the size of the Wireshark Packet List pane and scroll through the PDUs listed.Locate and identify the TCP and HTTP packets associated with the webpage download.Note the similarity between this message exchange and the FTP exchange.Step 3: In the Packet List pane, highlight an HTTP packet that has the notation "(text/html)" in the Info column.In the Packet Detail pane click on the " " next to "Line-based text data: html"When this information expands what is displayed?Examine the highlighted portion of the Byte Panel.This shows the HTML data carried by the packet.ReflectionWhy does Wireshark show the actual MAC address of the local hosts, but not the actual MAC address for theremote hosts?Page 18 of 23
Lab - Using Wireshark to View Network TrafficAppendix A: Allowing ICMP Traffic Through a FirewallIf the members of your team are unable to ping your PC, the firewall may be blocking those requests. Thisappendix describes how to create a rule in the firewall to allow ping requests. It also describes how to disablethe new ICMP rule after you have completed the lab.Step 1: Create a new inbound rule allowing ICMP traffic through the firewall.a. From the Control Panel, click the System and Security option.From the System and Security window, click Windows Firewall.b. In the left pane of the Windows Firewall window, click Advanced settings.Page 19 of 23
Lab - Using Wireshark to View Network Trafficc.On the Advanced Security window, choose the Inbound Rules option on the left sidebar and then clickNew Rule on the right sidebar.d. This launches the New Inbound Rule wizard. On the Rule Type screen, click the Custom radio buttonand click NextPage 20 of 23
Lab - Using Wireshark to View Network Traffice. In the left pane, click the Protocol and Ports option and using the Protocol type drop-down menu, selectICMPv4, and then click Next.f.In the left pane, click the Name option and in the Name field, type Allow ICMP Requests. Click Finish.Page 21 of 23
Lab - Using Wireshark to View Network TrafficThis new rule should allow your team members to receive ping replies from your PC.Step 2: Disabling or deleting the new ICMP rule.After the lab is complete, you may want to disable or even delete the new rule you creat
Lab - Using Wireshark to View Network Traffic Topology Objectives Part 1: (Optional) Download and Install Wireshark Part 2: Capture and Analyze Local ICMP Data in Wireshark Start and stop data capture of ping traffic to local hosts. Locate the IP and MAC address information in captured PDUs.