Transcription
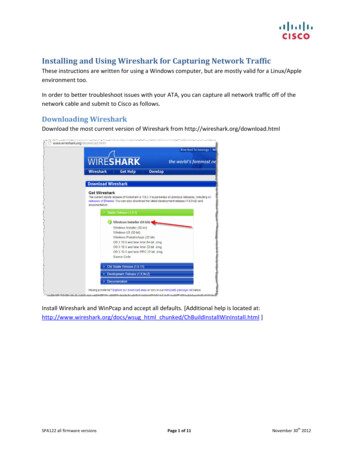
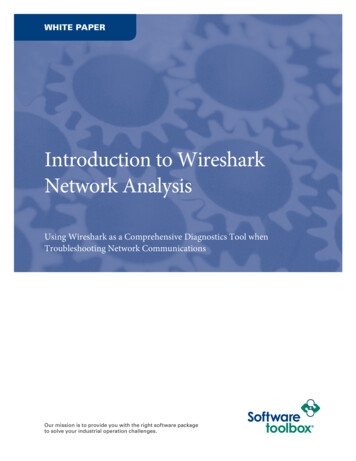
Wireshark Lab1, part a: Getting StartedVersion: 2.0 2007 J.F. Kurose, K.W. Ross. All Rights Reserved“Tell me and I forget. Show me and I remember. Involve me and I understand.”Chinese proverbOne’s understanding of network protocols can often be greatly deepened by “seeing protocols inaction” and by “playing around with protocols” – observing the sequence of messages exchangedbetween two protocol entities, delving down into the details of protocol operation, and causingprotocols to perform certain actions and then observing these actions and their consequences. In theseWireshark labs we will observe the operation of real network protocols. You will be running variousnetwork applications in different scenarios using a computer in the lab or your own computer, if youprefer. You will observe the network protocols in your computer “in action,” interacting andexchanging messages with protocol entities executing elsewhere in the Internet.The basic tool for observing the messages exchanged between executing protocol entities is called apacket sniffer. As the name suggests, a packet sniffer captures (“sniffs”) messages beingsent/received from/by your computer. It will also typically store and/or display the contents of thevarious protocol fields in these captured messages. A packet sniffer itself is passive. It observesmessages being sent and received by applications and protocols running on your computer, but neversends packets itself. Similarly, received packets are never explicitly addressed to the packet sniffer.Instead, a packet sniffer receives a copy of packets that are sent/received from/by application andprotocols executing on your machine.Figure 1 shows the structure of a packet sniffer. At the right of Figure 1 are the protocols (in thiscase, Internet protocols) and applications (such as a web browser or ftp client) that normally run onyour computer. The packet sniffer, shown within the dashed rectangle in Figure 1 is an addition tothe usual software in your computer, and consists of two parts. The packet capture library receivesa copy of every link-layer frame that is sent from or received by your computer. Recall thatmessages exchanged by higher layer protocols such as HTTP, FTP, TCP, UDP, DNS, or IP all areeventually encapsulated in link-layer frames that are transmitted over physical media such as anEthernet cable. In Figure 1, the assumed physical media is an Ethernet, and so all upper layerprotocols are eventually encapsulated within an Ethernet frame. Capturing all link-layer frames thusgives you all messages sent/received from/by all protocols and applications executing in yourcomputer.
Packet snifferPacketAnalyzerApplicationOperating SystemPacketcapture(pcap)Application—e.g. webbrowser, ftp client, etcTransport (UDP/TCPNetwork (IP)Copy of all received framesData Link (Ethernet)Physicalto/from networkFigure 1: Packet sniffer structureThe second component of a packet sniffer is the packet analyzer, which displays the contents of allfields within a protocol message. In order to do so, the packet analyzer must “understand” thestructure of all messages exchanged by protocols. For example, suppose we are interested indisplaying the various fields in messages exchanged by the HTTP protocol in Figure 1. The packetanalyzer understands the format of Ethernet frames, and so can identify the IP datagram within anEthernet frame. It also understands the IP datagram format, so that it can extract the TCP segmentwithin the IP datagram. Finally, it understands the TCP segment structure, so it can extract theHTTP message contained in the TCP segment. Finally, it understands the HTTP protocol and so,for example, knows that the first bytes of an HTTP message will contain the string “GET,” “POST,”or “HEAD,” as shown in Figure 2.8 in the text.We will be using the Wireshark packet sniffer [http://www.wireshark.org/] for these labs, allowing usto display the contents of messages being sent/received from/by protocols at different levels of theprotocol stack. (Technically speaking, Wireshark is a packet analyzer that uses a packet capturelibrary in your computer). Wireshark is a free network protocol analyzer that runs on Windows,Linux/Unix, and Mac computers. It has a large user base and well-documented support that includes:a user-guide (http://www.wireshark.org/docs/wsug html chunked/),man pages (http://www.wireshark.org/docs/man-pages/),and a detailed FAQ (http://www.wireshark.org/faq.html),It operates in computers using Ethernet, Token-Ring, FDDI, serial (PPP and SLIP), 802.11 wirelessLANs, and ATM connections (if the OS on which it is running allows Wireshark to do so).Getting Access to WiresharkIn order to run Wireshark, you will need to have access to a computer that supports both Wiresharkand the libpcap or WinPCap packet capture library. Wireshark has been installed on the Windows
computers in the Embedded Systems Lab (2245 SC). You may use this laboratory to complete theWireshark labs. Keycard access to 2245 SC can be obtained from the ECE Office, 4416 SC. Notethat it may take up to 24 hours from the time you request access until it is activated.If you prefer, you can install Wireshark on your own Windows, Linux, or Unix computer and usethat computer to complete the labs. Here is the procedure to download and install Wireshark on yourcomputer:See http://www.wireshark.org/download.html for a list of supported operating systems anddownload sitesDownload and install the Wireshark software: Go to http://www.wireshark.org/download.html and download and install the Wiresharkbinary for your computer. The libpcap software will be installed for you, if it is notalready installed within your operating system, when you install Wireshark. Download the Wireshark user guide. The Wireshark FAQ has a number of helpful hints and interesting tidbits of information,particularly if you have trouble installing or running Wireshark.If you use your own computer, you may need to use a wired Internet (802.3) connection sinceWireshark does not work with all wireless (802.11) adapters.
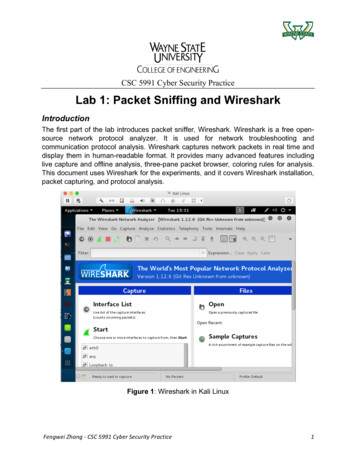
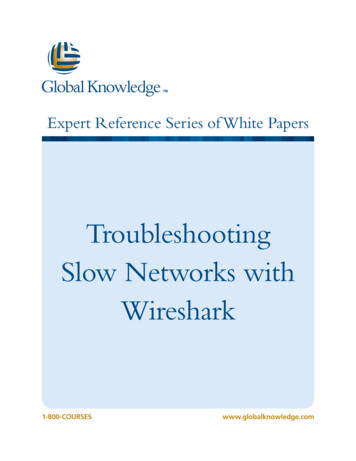
Running WiresharkWhen you run the Wireshark program, the Wireshark graphical user interface shown in Figure 2 willde displayed. Initially, no data will be displayed in the various windows.Figure 2: Wireshark Graphical User InterfaceThe Wireshark interface has five major components: The command menus are standard pull-down menus located at the top of the window. Ofinterest to us now are the File and Capture menus. The File menu allows you to savecaptured packet data or open a file containing previously captured packet data, and exit theWireshark application. The Capture menu allows you to begin packet capture. The packet-listing window displays a one-line summary for each packet captured, includingthe packet number (assigned by Wireshark; this is not a packet number contained in anyprotocol’s header), the time at which the packet was captured, the packet’s source anddestination addresses, the protocol type, and protocol-specific information contained in the
packet. The packet listing can be sorted according to any of these categories by clicking on acolumn name. The protocol type field lists the highest level protocol that sent or receivedthis packet, i.e., the protocol that is the source or ultimate sink for this packet. The packet-header details window provides details about the packet selected (highlighted)in the packet listing window. (To select a packet in the packet listing window, place thecursor over the packet’s one-line summary in the packet listing window and click with theleft mouse button.). These details include information about the Ethernet frame (assumingthe packet was sent/receiverd over an Ethernet interface) and IP datagram that contains thispacket. The amount of Ethernet and IP-layer detail displayed can be expanded or minimizedby clicking on the plus-or-minus boxes to the left of the Ethernet frame or IP datagram line inthe packet details window. If the packet has been carried over TCP or UDP, TCP or UDPdetails will also be displayed, which can similarly be expanded or minimized. Finally,details about the highest level protocol that sent or received this packet are also provided. The packet-contents window displays the entire contents of the captured frame, in bothASCII and hexadecimal format.Towards the top of the Wireshark graphical user interface, is the packet display filter field, intowhich a protocol name or other information can be entered in order to filter the information displayedin the packet-listing window (and hence the packet-header and packet-contents windows). In theexample below, we will use the packet-display filter field to have Wireshark hide (not display)packets except those that correspond to HTTP messages.
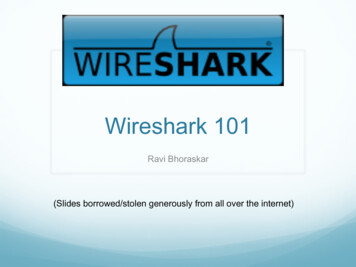
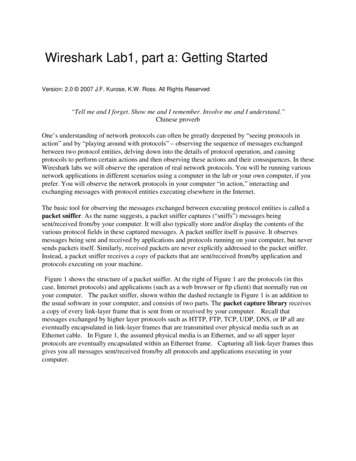
Taking Wireshark for a Test RunThe best way to learn about any new piece of software is to try it out. We will assume that yourcomputer is connected to the Internet via a wired Ethernet interface. Do the following1. Start up your favorite web browser, which will display your selected homepage.2. Start up the Wireshark software. You will initially see a window similar to that shown in Figure 2,except that no packet data will be displayed in the packet-listing, packet-header, or packet-contentswindow, since Wireshark has not yet begun capturing packets.3. To begin packet capture, select the Capture pull down menu and select Options. This will causethe “Wireshark: Capture Options” window to be displayed, as shown in Figure 3.Figure 3: Wireshark Capture Options Window4. You can use most of the default values in this window, but uncheck “Hide capture info dialog”under Display Options. The network interfaces (i.e., the physical connections) that your computer hasto the network will be shown in the Interface pull down menu at the top of the Capture Optionswindow. In case your computer has more than one active network interface (e.g., if you have both awireless and a wired Ethernet connection), you will need to select an interface that is being used tosend and receive packets (mostly likely the wired interface). After selecting the network interface (orusing the default interface chosen by Wireshark), click Start. Packet capture will now begin - allpackets being sent/received from/by your computer are now being captured by Wireshark.
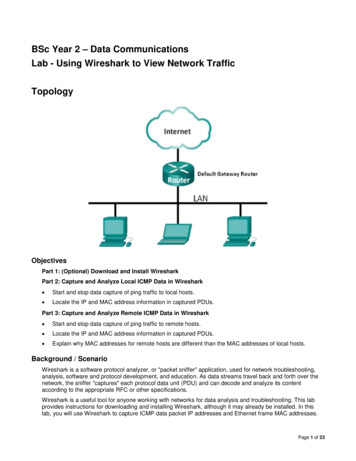
5. Once you begin packet capture, a packet capture summary window will appear, as shown in Figure4. This window summarizes the number of packets of various types that are being captured, and(importantly) contains the Stop button that will allow you to stop packet capture. Don’t stop packetcapture yet.Figure 4: Wireshark Packet Capture Window6. While Wireshark is running, enter the wireshark-file1.htmland have that page displayed in your browser. In order to display this page, your browser willcontact the HTTP server at gaia.cs.umass.edu and exchange HTTP messages with the server inorder to download this page, as discussed in section 2.2 of the text. The Ethernet framescontaining these HTTP messages will be captured by Wireshark.7. After your browser has displayed the INTRO-wireshark-file1.html page, stop Wireshark packetcapture by selecting stop in the Wireshark capture window. This will cause the Wireshark capturewindow to disappear and the main Wireshark window to display all packets captured since you beganpacket capture. The main Wireshark window should now look similar to Figure 2. You now havelive packet data that contains all protocol messages exchanged between your computer and othernetwork entities. The HTTP message exchanges with the gaia.cs.umass.edu web server should appearsomewhere in the listing of packets captured. But there will be many other types of packets displayedas well (see, e.g., the many different protocol types shown in the Protocol column in Figure 2).Even though the only action you took was to download a web page, there were evidently many otherprotocols running on your computer that are unseen by the user. We’ll learn much more about theseprotocols as we progress through the text! For now, you should just be aware that there is often muchmore going on than “meet’s the eye”!
8. Type in “http” (without the quotes, and in lower case – all protocol names are in lower case inWireshark) into the display filter specification window at the top of the main Wireshark window.Then select Apply (to the right of where you entered “http”). This will cause only HTTP messagesto be displayed in the packet-listing window.9. Select the first http message shown in the packet-listing window. This should be the HTTP GETmessage that was sent from your computer to the gaia.cs.umass.edu HTTP server. When you selectthe HTTP GET message, the Ethernet frame, IP datagram, TCP segment, and HTTP message headerinformation will be displayed in the packet-header window. By clicking plus-and-minus boxes to theleft side of the packet details window, minimize the amount of Frame, Ethernet, Internet Protocol,and Transmission Control Protocol information displayed. (Recall that the HTTP GET message thatis sent to the gaia.cs.umass.edu web server is contained within a TCP segment, which is contained(encapsulated) in an IP datagram, which is encapsulated in an Ethernet frame.)Maximize the amount information displayed about the HTTP protocol. Your Wireshark displayshould now look roughly as shown in Figure 5. (Note, in particular, the minimized amount ofprotocol information for all protocols except HTTP, and the maximized amount of protocolinformation for HTTP in the packet-header window).Figure 5: Wireshark display after step 9
10. Exit WiresharkWhat to hand inThe goal of this exercise was primarily to introduce you to Wireshark. The following questionswill demonstrate that you’ve been able to get Wireshark up and running, and have explored someof its capabilities. Answer the following questions, based on your Wireshark experimentation:1. List up to 10 different protocols that appear in the protocol column in the unfilteredpacket-listing window in step 7 above.2. How long did it take from when the HTTP GET message was sent until the HTTP OK replywas received? (By default, the value of the Time column in the packet-listing window is theamount of time, in seconds, since Wireshark tracing began. To display the Time field intime-of-day format, select the Wireshark View pull down menu, then select Time DisplayFormat, then select Time-of-day.)3. What is the Internet address of the gaia.cs.umass.edu (also known as wwwnet.cs.umass.edu)?What is the Internet address of your computer?4. Print the two HTTP messages displayed in step 9 above. To do so, select Print from theWireshark File command menu, and select “Selected Packet Only” and “Print as displayed”and then click OK.
7. After your browser has displayed the INTRO-wireshark-file1.html page, stop Wireshark packet capture by selecting stop in the Wireshark capture window. This will cause the Wireshark capture window to disappear and the main Wireshark window to dis